This is the second part of a two part series on the unusual market pattern that we have been undergoing (see part one, Peak fear or Cold War 2.0). While the market may have discounted a substantial amount of the first-order effects of a trade war, the tail-risk of the loss of business confidence in a full-blown trade war is difficult to measure. In addition, the US and China may be on the verge of Cold War 2.0, which would disrupt and bifurcate technology platforms and supply chains.
Cold War 2.0?
The Economist recently devoted a special report to how a trade war is becoming a Cold War 2.0:
Fighting over trade is not the half of it. The United States and China are contesting every domain, from semiconductors to submarines and from blockbuster films to lunar exploration. The two superpowers used to seek a win-win world. Today winning seems to involve the other lot’s defeat—a collapse that permanently subordinates China to the American order; or a humbled America that retreats from the western Pacific. It is a new kind of cold war that could leave no winners at all.
This development was not a surprise. I had warned about the risk of a Cold War 2.0 in January 2018 when the US unveiled its National Security Strategy that defined China as a “strategic competitor” (see Sleepwalking towards a possible trade war). In retrospect, that publication of the NSS document was probably as historically important as Winston Churchill’s “iron curtain” speech in 1946 that marked the start of the Cold War with the Soviet Union.
Viewed in that context, these trade talks represent only an initial skirmish in a globalized competition between two political and economic systems. While my base case scenario calls for a brief truce to be achieved probably in late 2019, the onset of Cold War 2.0 represents a tectonic shift in global trade and investment flows that will have multi-decade long investment implications.
Thucydides Trap
Historians are well acquainted with the “Thucydides Trap”, which was named after the Greek historian Thucydides who told the story of how Sparta was unable to accommodate the rise of Athens, which led to war. The Thucydides Trap has been used to explain the start of World War I, in which European powers were unable to accommodate the rise of a newly industrialized Germany.
However, war is not inevitable under the Thucydides Trap. The West was able to contain the Soviet Union while fighting a Cold War without a major World War III conflagration, and restricted conflict to localized proxy skirmishes in Korea, Vietnam, and Afghanistan. Moreover, there are numerous examples of existing geopolitical structure was able to accommodate the rise of new economic powers in a peaceful fashion, such as the rise of post-War Japan, the rise of Asian economies such as Singapore, South Korea, Taiwan, and India.
Trump’s America is leading the West into another Cold War with China. How did we get here?
Boys will be boys?
It began with a lack of historical understanding of how countries develop, and a lesson in America’s own history of economic development.
Michael Porter, in his The Competitive Advantage of Nations, outlined the development path of many national economies. They begin by exploiting their competitive advantage of cheap labor to boost the economy and employment. The next step is an import substitution strategy of copying foreign products with cheap knockoffs, which eventually gives them insights in product design. The final stage of development is an advancement higher value-added design and development.
This is the well-trodden path followed by Japan in the post-War era that made it an economic powerhouse. I can remember as a child during the 1960’s the ridicule heaped on Japanese knockoff products and cars, but that economy eventually became a dominant player in electronics (Sony, Hitachi) and autos (Honda, Toyota). The same development path was followed by other Asian Tigers. Michael Dell exploited the cheap production platforms offered mainly by Taiwan to build his PC empire.
Today’s complaints about China’s theft of intellectual property is not a surprise. I am not denying that this happens, nor am I discounting its effects. Reuters reported that the EU is also complaining about forced Chinese transfer of technology:
The European Union Chamber of Commerce in China said on Monday that results from its annual survey showed 20% of members reported being compelled to transfer technology for market access, up from 10% two years ago.
Nearly a quarter of those who reported such transfers said the practice was currently ongoing, while another 39% said the transfers had occurred less than two years ago.
All countries engage in sort of technology theft or transfer as they climb the value-added ladder. Faced with large technological gaps, theft has been the answer at a particular stage in development. Allan Golomebek documented in Real Clear Markets how America once hijacked foreign technology as an emerging market economy:
In the late 18th century, intellectual property theft was taken seriously indeed. In fact, England had criminalized the export of textile machinery, and even the emigration of textile mechanics. But such harsh measures did not deter attempts. In 1787, for example, Andrew Mitchell — who had been sent to Britain by Pennsylvania businessman Tench Coxe, a close associate of Hamilton — was trying to smuggle new technology out of the U.K when he was intercepted by British authorities. Seized after being loaded on board a ship, his trunk contained models and drawings of one Britain’s great industrial machines.
The city of Lowell, Massachusetts actually got its start after its namesake, Francis Cabot Lowell, visited England in the early 19th century and spent his time trying to figure out how the Brits had managed to automate the process of weaving cloth. Charming his way into factories, he memorized what he saw, and managed to reproduce the weaving machine.
Hamilton didn’t just send Americans to Britain in search of the secrets of the industrial revolution. He used patents to lure immigrants with skills and knowledge to move to the United States. George Parkinson, for example, was awarded a patent in 1791 for a textile spinning machine, which was really just a rip-off of a machine he had used in England. The United States also paid his family’s expenses to emigrate and re-locate to the US.
But probably the greatest thief of intellectual property in America’s early days was Samuel Slater. An immigrant from Great Britain, Slater had a unique asset when it came to stealing manufacturing ideas and processes – an incredible memory. Disappointed by the relatively primitive state of technology in his adopted country, Slater offered his services to a U.S manufacturer. Working only from his memory of the advanced tools used in his native Britain, within a year Slater managed to create America’s first automated textile mill.
From a historian’s viewpoint, the copying or theft of IP can be thought of “boys will be boys” during different stages of development. That said, none of these practices justify China’s practice of IP theft. What is different this time is the realpolitik dimension of China’s practices. Her economy is so large and so important that China has the economic muscle to realize these efforts on a much larger scale than previous historical instances.
A clash of cultures
Some of the public American complaints about the Chinese are overblown, attributable to the differences in cultures and negotiation styles. Shang-Jin Wei wrote in Project Syndicate about these cultural differences:
In an Executive MBA course on the Chinese economy that I have taught at Columbia Business School for the past ten years, we do a mock negotiation between a US and a Chinese team. We then discuss how norms and styles of negotiation may differ across cultures. One takeaway from this session is that some differences in norms of which the two sides are unaware can cause talks to break down.
Consider the example of a three-day negotiation between the US and Chinese teams that will cover nine topics. Let us say that the two sides have reached an agreement on the first six topics after two days of talks. On the final day, they reach an impasse on the last three points, and the Chinese side declares – suddenly, from the US team’s viewpoint – that they have to alter the agreement on the first six topics.
At this point, the American team may very well feel that the Chinese side is untrustworthy or insincere, and the whole negotiation may break down as a result. In my class, we discuss how talks may sometimes collapse purely due to differences in negotiating styles, without either party intending to be devious.
Most American negotiators adopt a checklist approach: if they wish to cover nine topics, they would like to reach agreement on each one in turn. The Chinese, by contrast, are accustomed to taking a more holistic approach, and follow a norm of “nothing is agreed until everything is agreed.”
In the above example, when the Chinese side agreed to positions on the first six topics, they had certain expectations about how the last three points would look at the end of the negotiations. When the discussion about these three topics turned out to be quite different from what they had expected, they asked to revisit the first six, because the various tradeoffs among the nine topics had changed.
Did the Chinese “blow up” the most recent round negotiations as Trump claimed? Yes, and no. It was just a difference in negotiation style. On the other hand, Trump has his own negotiation style. Bloomberg reported that two former Mexican NAFTA negotiators had formed their own private consulting firm to advise others on how to negotiate with the US government:
So what should you anticipate when facing Trump?
“You need to be prepared, expecting the unexpected,” Baker said in an interview. “Even when you have gotten to a place where a deal seems likely, expect an extra push. Be prepared for a hostile and extremely unpredictable environment. You need to be aware that the negotiating positions or many of the ideas that are tabled might end up the next day in a tweet. It’s not a normal negotiation.”
Currency strategist Marc Chandler criticized the American negotiation position in even blunter terms:
Say what you want about Chinese trade practices, and no one seriously defends them, but the US red lines cannot be the basis of serious negotiations. Trump has indicated that the US will not accept a mutually beneficial deal because it needs to be compensated for past wrongs, and he has explicitly stated that he will not allow China to become the largest superpower.
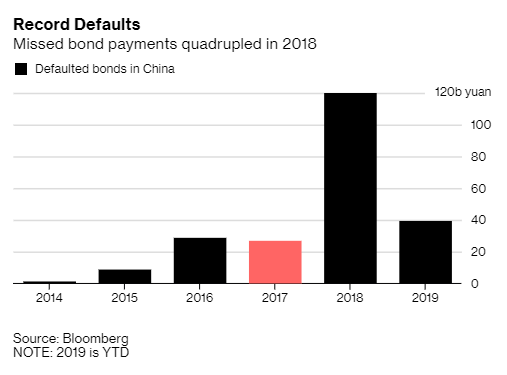
Another difference in culture and negotiation style is that the Chinese prefer to settle differences privately, rather than in full public view. Bloomberg reported on some examples of what happens when Chinese companies default on their bonds:
When a company in developed markets fails to make a bond payment on time as agreed, that information typically becomes public in swift order, and the issuer would normally be declared in default by ratings agencies and investors. But in China, sometimes things aren’t so obvious — one of many idiosyncrasies for global funds to be aware of as they consider the increasingly open local-currency Chinese market.
An opaque practice that’s increasingly concerning analysts is when a debtor stops servicing bonds through an official clearing house, and instead does private deals with bondholders that might involve late payments.
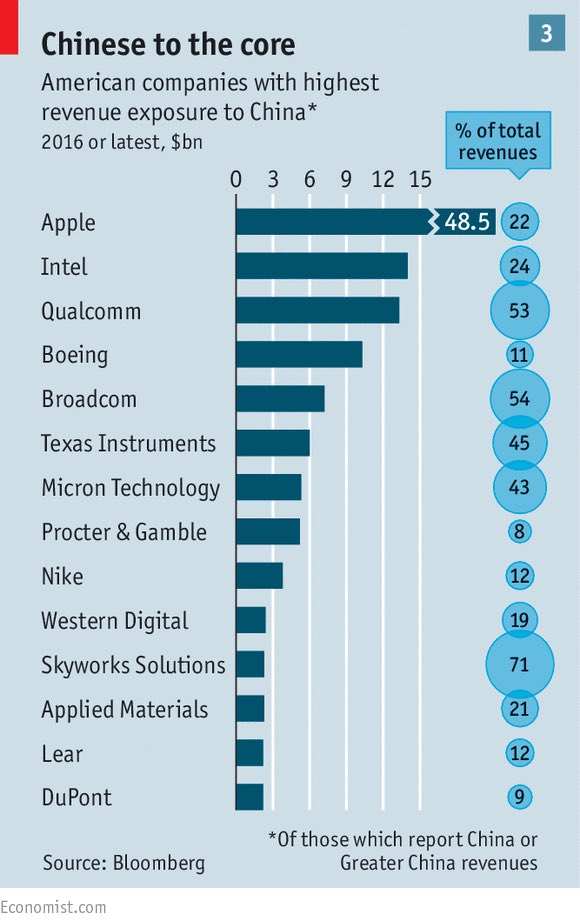
As an example of how similar transgressions have been settled quietly in the West, currency strategist Marc Chandler pointed to the example of Apple and Qualcomm dispute.
In the middle of March, Apple was found guilty of violating 3 patents owned by Qualcomm, but we don’t call it theft. Many of us share passwords, is this theft? Huawei violated the US embargo against Iran. Isn’t the penalty for such action a fine not jail time? Cold War?
In addition, the Chinese is very well aware of their own history. The current interaction with the West is often viewed in the historical context of their humiliation during the Opium Wars, when a vastly numerically Chinese population was subjugated by superior Western technology, and Beijing was forced into giving up colonial concessions. A more recent historical event that Chinese negotiators are also very well aware of are the costs the Plaza Accord imposed on Japan’s economy, as explained by The Economist:
The Plaza Accord is best understood not as a one-off event but as a critical stage in a multi-year dispute, which ranged from agriculture to electronics. America accused Japan of stealing intellectual property and plotting to control future industries. Robert Lighthizer, America’s lead negotiator against China today, earned his spurs in these earlier battles. In 1990 the two countries agreed to a “Structural Impediments Initiative”, which bears a striking resemblance to the crux of the debate today. America wanted Japan then—and wants China now—to improve its competition laws, open more widely to foreign investors and weaken its giant conglomerates (keiretsu groups in Japan, state-owned firms in China).
The rest is history. Japan fell into a multi-decade slump.
A clash of civilizations
Samuel Huntington hypothesized about a seminal Foreign Affairs article about A Clash of Civilizations as a paradigm in the post Cold War era. While Huntington’s main focus was a clash of the West against the Muslim world, the more likely coming clash is with China.
The latest trade dispute is just a microcosm of that clash. I have outlined the differences in culture, outlook, and negotiating styles of the two sides. No matter how hard American negotiators force the issue, China is a sufficiently strong economically that it will never change its legal, social, and cultural system to suit America. At the same time, a strong consensus is building in Washington that China is an economic and strategic threat. The imposition of a blacklist on Huawei, and the possible blacklist of Hangzhou Hikvision Digital Technology and other Chinese spy-tech firms, are also signals that Washington has gone beyond a trade war. It has progressed to a Cold War designed to stifle Chinese economic development.
Patrick Chovanec, who taught business at Tsinghua University in Beijing and now works at as a investment strategist in New York, lamented the hardening Washington views on China in a series of tweets:
People talk about how there has been a sea change in how people in Washington, DC think and talk about China. I’ve been thinking of my own experience of this, which I have found rather disturbing.
Five years ago, people in DC were quite curious about China. They did not know quite what to think about it, and were eager to hear new perspectives and insights they had not heard before. When visiting from China, I found nearly all doors open and interested.
Today, nearly everyone has a hardened view on China. They may never have been there, but they know what they think. Perspectives or insights that don’t fit neatly within those boxes are viewed with suspicion. Talking to people is like sitting for an ideological litmus test.
It’s rather unpleasant and I tend to avoid it. I spent more time talking to people in DC about China when I lived in China and occasionally visited, than now when I still follow these issues and live a few hours away. You’re just courting a quarrel, which is not worth it.
So it’s not merely that views on China, at least in DC, have shifted. It’s that they’ve grown hardened and insular and incurious, in a way that’s so different from just a few years ago.
The risks of Cold War 2.0
Washington has become fertile ground for Cold War 2.0. As part of its series on US-China dispute, The Economist suggested that there is not enough win-win and too much win-lose in the view of both sides, which will doom the relationship [emphasis added]:
Ask American experts how a great-power competition with China might end well, and their best-case scenarios are strikingly similar. They describe a near future in which China overreaches and stumbles. They imagine a China chastened by slowing growth at home and a backlash to its assertive ways overseas. That China, they hope, might look again at the global order and seek a leading role in it, rather than its remaking.
Chinese experts also sound alike when explaining their own best-case scenario. Put crudely, it is for America to get over itself. More politely, Chinese voices express hopes that in a decade or so America will learn the humility to accept China as an equal, and the wisdom to avoid provoking China in its Asian backyard.
It is sobering that none of these experts predicts a future in which America and China both feel like winners. That should give all sides pause. The original cold war with the Soviet Union ended with an American victory. In a new Sino-American cold war, both countries could lose.
Arguably, the Trump administration should be careful what it wishes for. A China that decouples from the West could present far greater foreign policy challenges in the future because it will be exponentially more difficult to deal with. In the modern era because of the sheer size of the Chinese economy, America has not confronted an adversary with an economy more than 40% of GDP until today, and strategies that worked in the past may be ineffective in this instance.
It is useful to remember the history of American foreign policy as we approach the 30th anniversary of the Tiananmen massacre. The strategy during Cold War 1.0 involved an economic quarantine the Soviet Union. American policy makers 30 years ago chose to remain engaged with Beijing at the time, because they were terrified of what the Chinese leadership might do otherwise if isolated. China had a history of supplying nuclear technology to Pakistan, and missiles to Middle East interests. Today, China has made largely an about face and stands against nuclear proliferation, and it is well integrated in the global economy. The US decision to remain engaged was a useful pre-condition of development, Deng Xiaopeng’s Southern Tour three years later was the catalyst for its well-known growth revival. What policy levers will the West have if China decouples and pursues a disruptive foreign policy, other than military options that could lead to a hot war?
In addition, the current Trumpian policy path of confronting China and while pressing allies to bear more of their defense costs could backfire in a spectacular fashion. In Cold War 2.0, countries will have to choose sides, and the risk is Asia becomes a Chinese sphere of influence, where China’s major Asian trading partners fall under Beijing’s orbit for economic reasons.
The way forward
Even though a new Cold War appears inevitable, that does not mean long-term investment returns will necessarily be subpar. Mike Santoli pointed out that equity returns during the Cold War were not only positive, but stellar. Can history repeat itself in Cold War 2.0? If history just rhymes, what is the new poem?

Here is how today’s world is different. America came out of World War II in a dominant position as it was the only major industrialized economy running at full strength and not devastated by war. It enjoyed an unparalleled competitive advantage over Europe and Japan, and the Soviet economy was based on an inadequate economic model that ultimately failed. Today, the Chinese economy is one of the fastest growing major economies, and it has the potential to become the biggest economy in the world in the near future. A Sino-American Cold War 2.0 conflict is likely to play out to a very different script than Cold War 1.0.
Much depends on how the relationship is managed by both sides. Under a Cold War 2.0 scenario, technology platforms and supply chains will bifurcate. Disengagement could be conducted in an orderly, or a disorderly fashion. Nouriel Roubini warned of the risks in a Project Syndicate essay:
The global consequences of a Sino-American cold war would be even more severe than those of the Cold War between the US and the Soviet Union. Whereas the Soviet Union was a declining power with a failing economic model, China will soon become the world’s largest economy, and will continue to grow from there. Moreover, the US and the Soviet Union traded very little with each other, whereas China is fully integrated in the global trading and investment system, and deeply intertwined with the US, in particular.
A full-scale cold war thus could trigger a new stage of de-globalization, or at least a division of the global economy into two incompatible economic blocs. In either scenario, trade in goods, services, capital, labor, technology, and data would be severely restricted, and the digital realm would become a “splinternet,” wherein Western and Chinese nodes would not connect to one another. Now that the US has imposed sanctions on ZTE and Huawei, China will be scrambling to ensure that its tech giants can source essential inputs domestically, or at least from friendly trade partners that are not dependent on the US.
Just like Cold War 1.0, the battlefield of Cold War 2.0 can be found in Europe, where China is trying to flex its economic muscle. Already, the budget constrained Italian government has signed on to China’s Belt and Road Initiative as a way of fracturing the western alliance:
In this balkanized world, China and the US will both expect all other countries to pick a side, while most governments will try to thread the needle of maintaining good economic ties with both. After all, many US allies now do more business (in terms of trade and investment) with China than they do with America. Yet in a future economy where China and the US separately control access to crucial technologies such as AI and 5G, the middle ground will most likely become uninhabitable. Everyone will have to choose, and the world may well enter a long process of de-globalization.
Whatever happens, the Sino-American relationship will be the key geopolitical issue of this century. Some degree of rivalry is inevitable. But, ideally, both sides would manage it constructively, allowing for cooperation on some issues and healthy competition on others. In effect, China and the US would create a new international order, based on the recognition that the (inevitably) rising new power should be granted a role in shaping global rules and institutions.
The key question is how both sides manage the relationship. There will be a divorce, but will it be amicable, or acrimonious? [emphasis added]
If the relationship is mismanaged – with the US trying to derail China’s development and contain its rise, and China aggressively projecting its power in Asia and around the world – a full-scale cold war will ensue, and a hot one (or a series of proxy wars) cannot be ruled out. In the twenty-first century, the Thucydides Trap would swallow not just the US and China, but the entire world.
The upcoming trade negotiations will be a key pivot point. Here are some key questions for American negotiators.
In this era of globalized supply chains, Trump’s 1950’s dream of returning manufacturing to American soil is nothing more than a fantasy. However, his measures have had an impact. Trade patterns are shifting, and manufacturers are moving their production away from China to other EM countries like Vietnam, Thailand, Mexico, and Eastern Europe. Can Trump and Lightizer accept this paradigm shift?

As well, will Trump insist on measures that blacklist key Chinese companies like Huawei and deny them access to US technology? China has hinted that it would retaliate by cutting off rare earth exports, which would devastate global supply chains and send the global economy into synchronized downturn. Or will both sides come to a face-saving truce, so that the parties can prepare for an orderly bifurcation of technologies and supply chains?
John Kemp, writing at Reuters, observed that supply chains eventually readjust, regardless of the immediate effects of embargoes. In the 18th and 19th Century, the American Revolution and later the Napoleonic wars cut off Britain’s Royal Navy supplies naval mast lumber from New England, Prussia, and Russia. Eventually new supplies were found from Canada, the Adriatic, India, and New Zealand. Kemp also pointed to the 20th Century examples of wartime Germany and apartheid South Africa developing coal-based substitution technology in response to a petroleum shortage.
In an environment where supply chains are disrupted and constrained, innovation like German coal gasification can still occur. While the prospect of a prolonged Cold War 2.0 may be intimidating, it does not preclude continued growth and the adoption of new productivity enhancing technologies. Long-term global equity returns can therefore parallel the equity market experience of Cold War 1.0.
In the short run, however, the risk of disruption is high. Watch how the trade negotiations evolve. The next 12-24 months will determine the long-term path of the new global order, as well as the degree of volatility that investors can expect from investments.
The week ahead
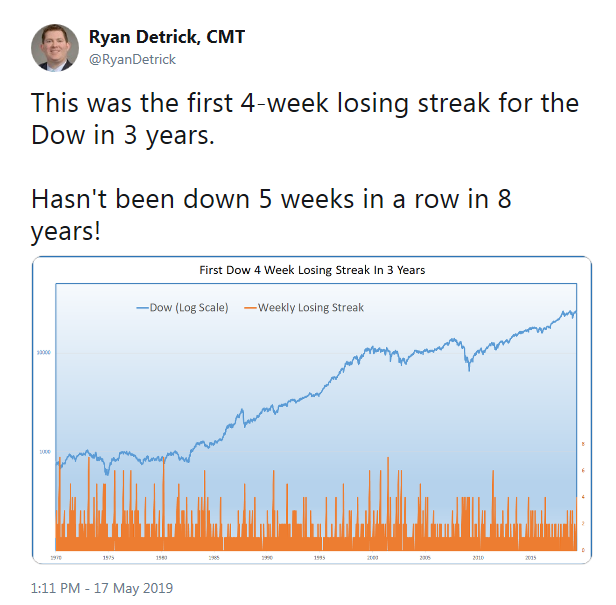
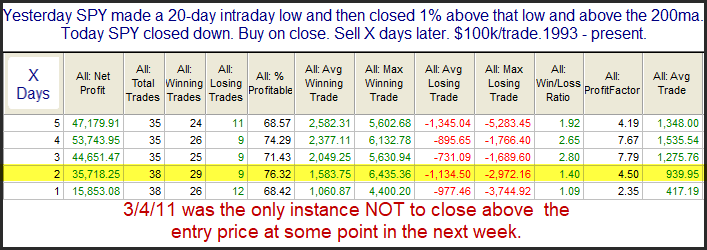
The headlines blared from Schaeffer’s Research, the Dow hasn’t fallen for five consecutive weeks since 2011. Schaeffer’s went on to torture the data until it talked with a bearish conclusion, based on recent data…
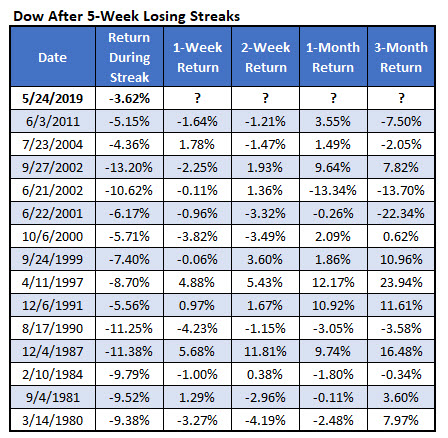
And a bullish conclusion based on longer term data.
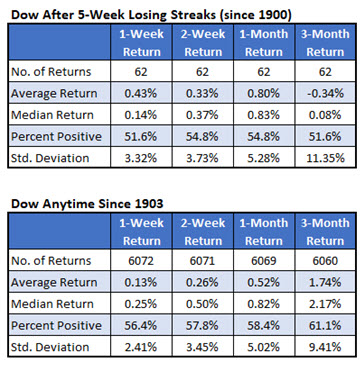
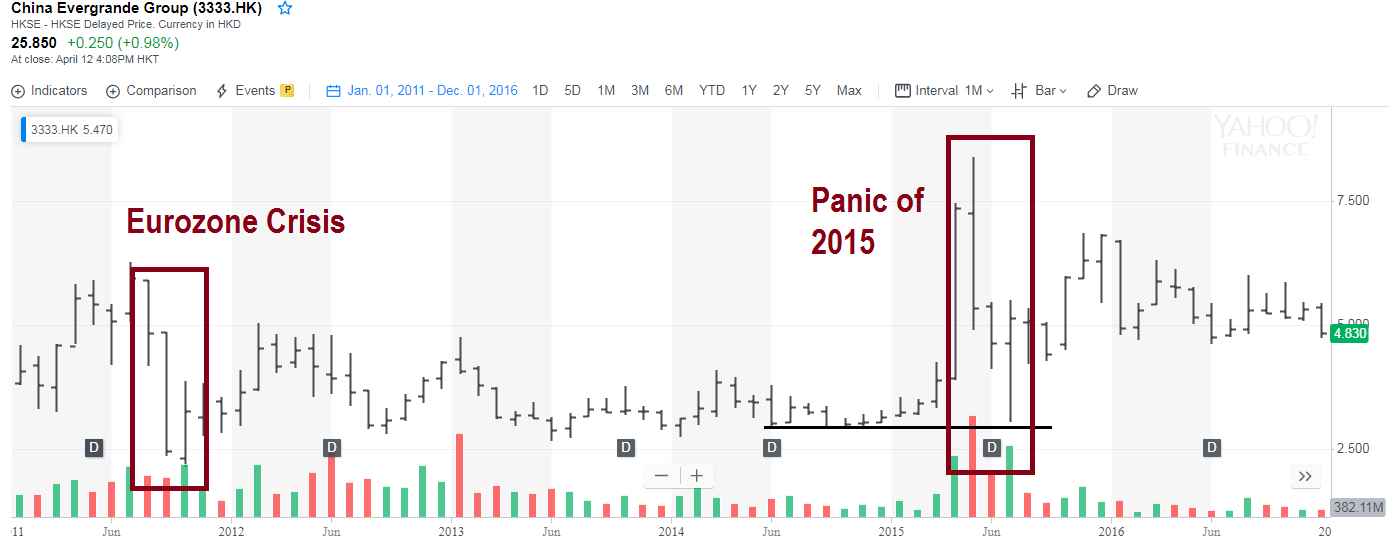
This confusing analysis does not tell us much about the near-term outlook for the stock market. Then, I got to thinking, what if 2011 could be a template for stock prices?
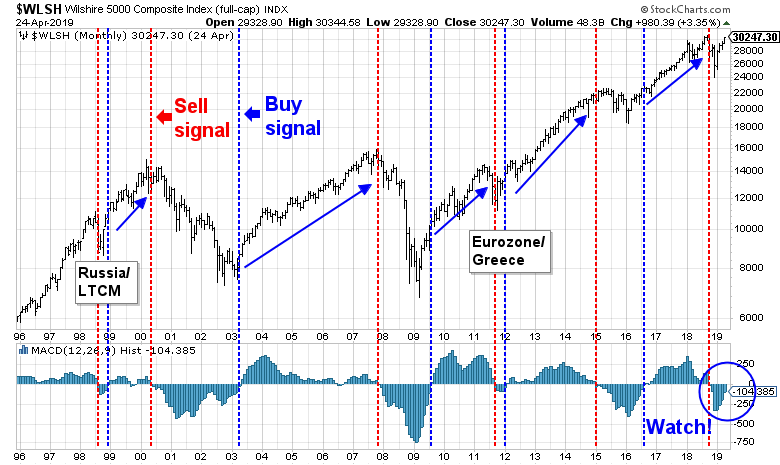
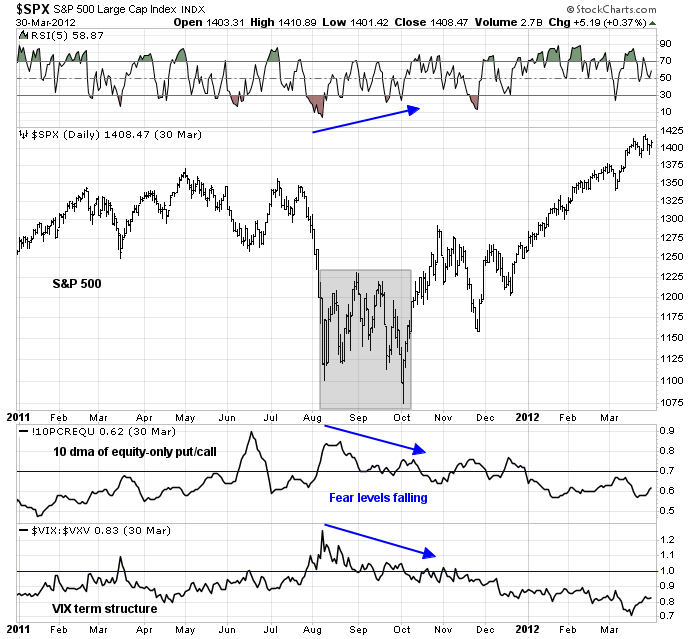
In 2011, the market was afflicted with the combination of a budget impasse in Washington, and a Greek debt crisis that raised an existential threat for the continuation of the eurozone. Bad news kept coming, as there were weekly summits, meetings to talk about more meetings, and there seemed to be no one in charge. Stock prices fell, then chopped around in a wide range for about two months, and, more importantly, stopped responding to bad news. Finally, a backroom deal was done and the ECB stepped in and rescued the market with its LTRO program.
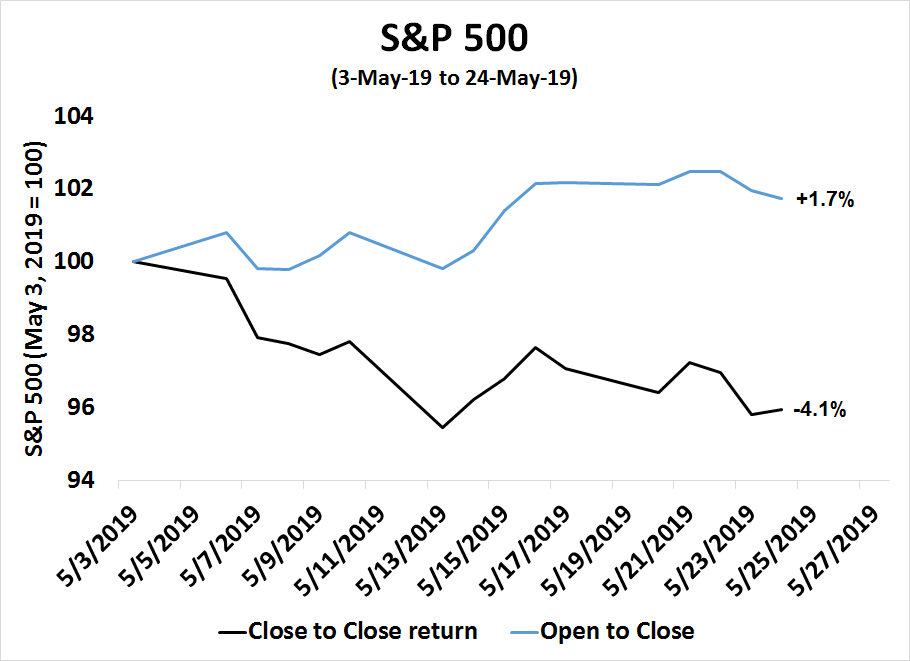
A similar template may be in play today. The market has been spooked by the prospect of a trade war that could crater the global economy. Stock prices fell, but they aren’t responding very much to the bad news. The market has been rising during daytime trading hours, and falling overnight and on weekends from trade war developments. If you had a crystal ball and knew that the trade talks were falling apart, you might guess that the market would be down 10-20%. Instead, it’s less than 5% from its all-time highs.
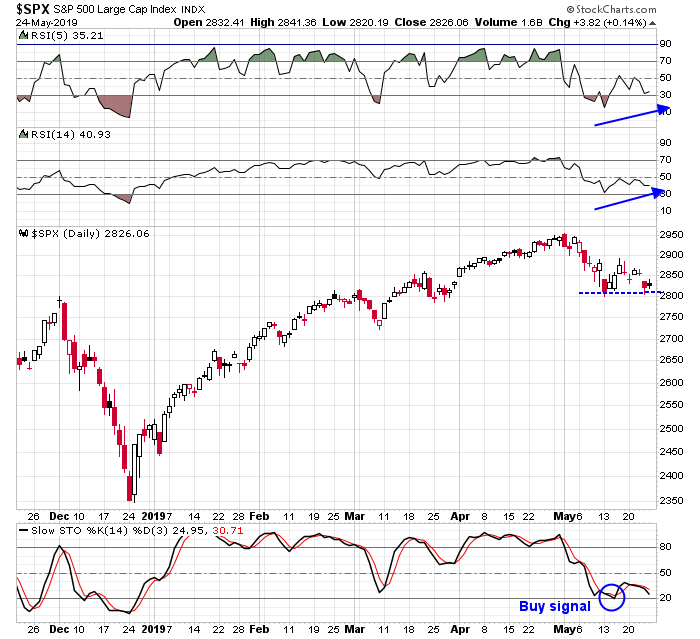
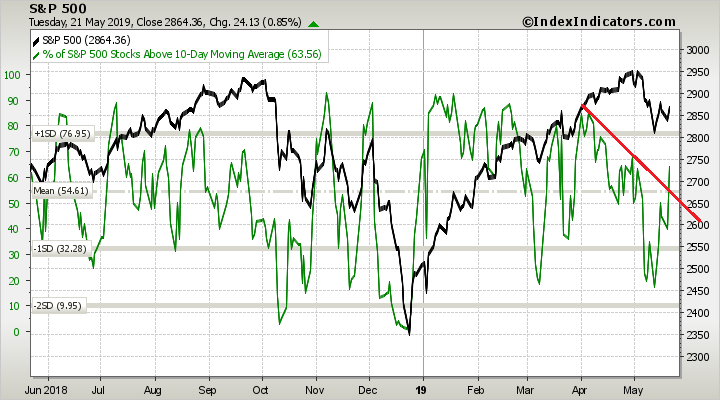
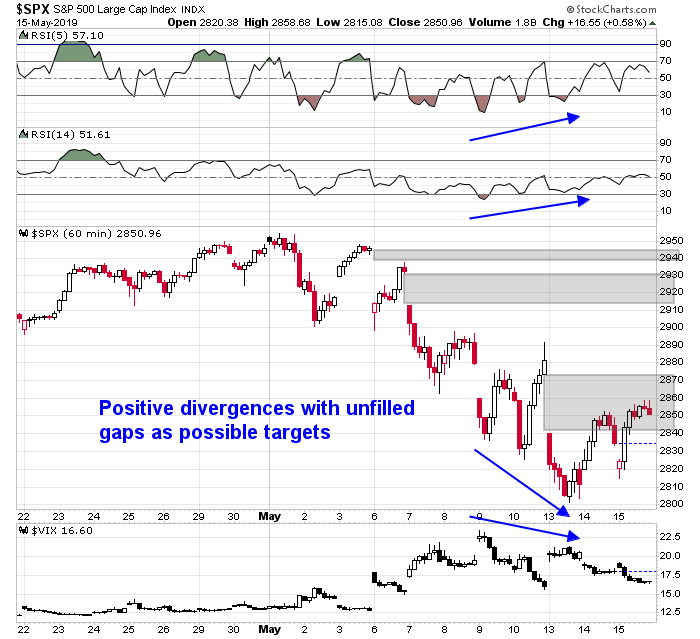
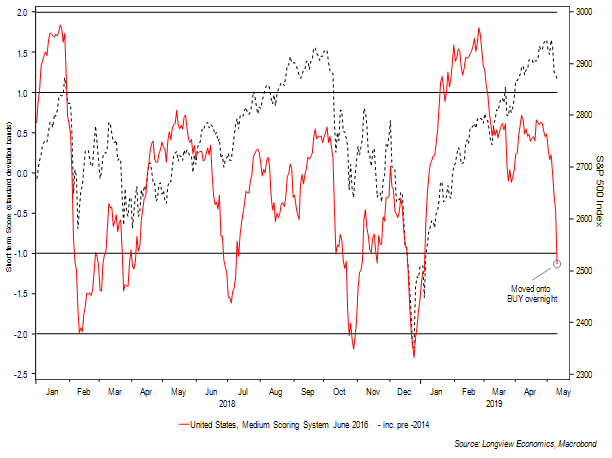
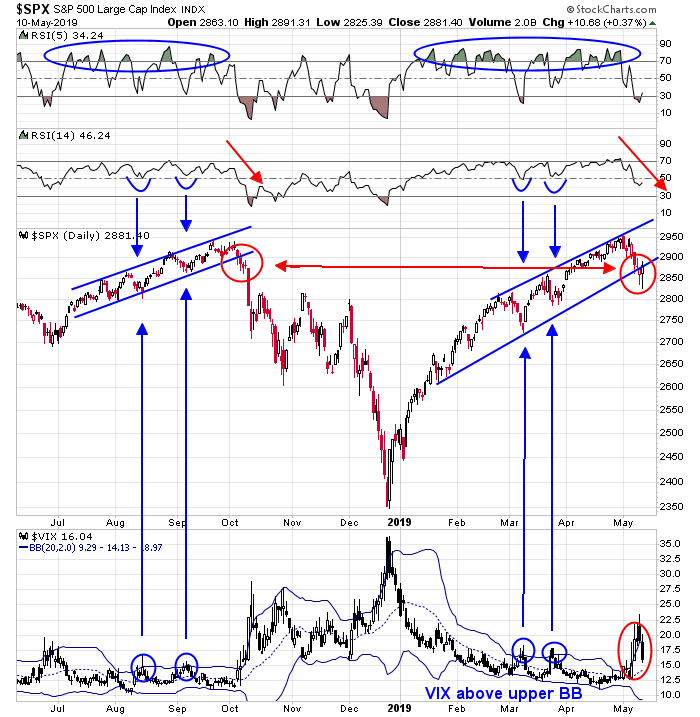
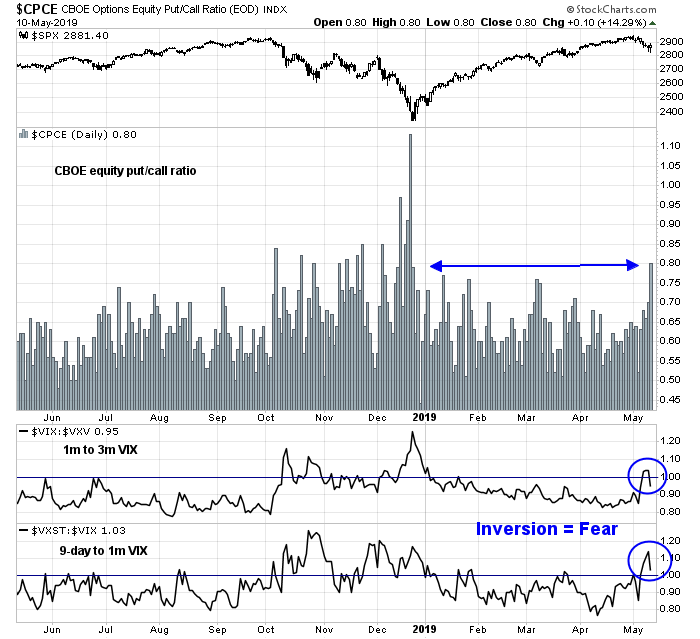
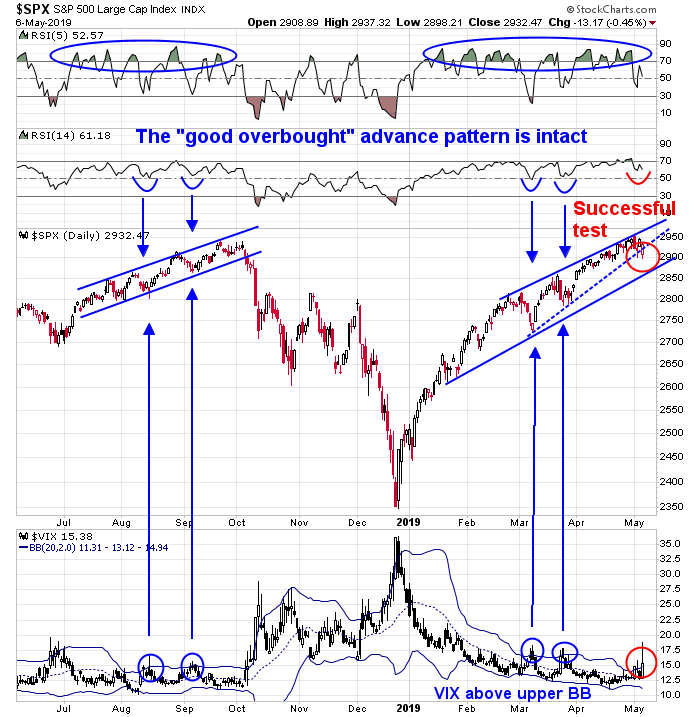
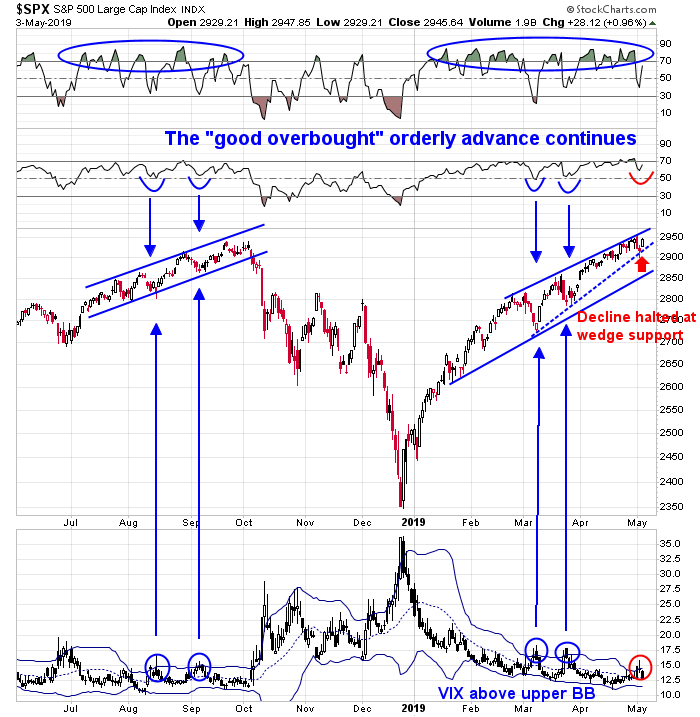
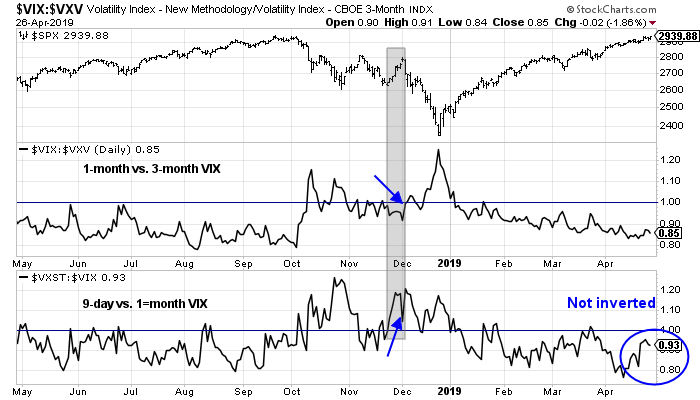
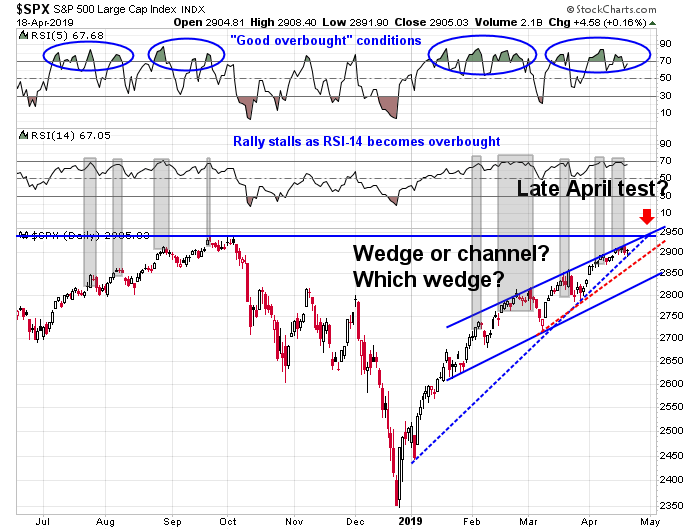
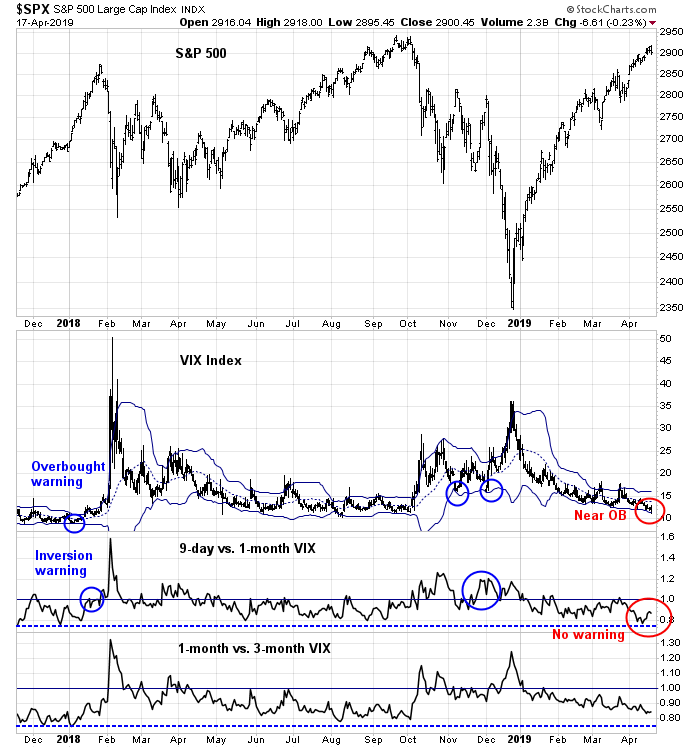
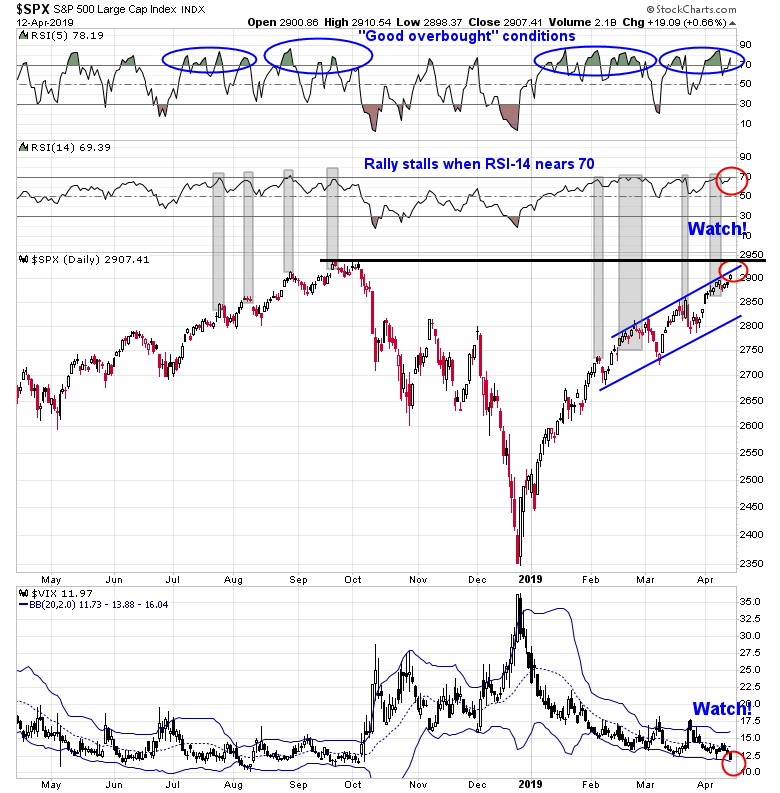
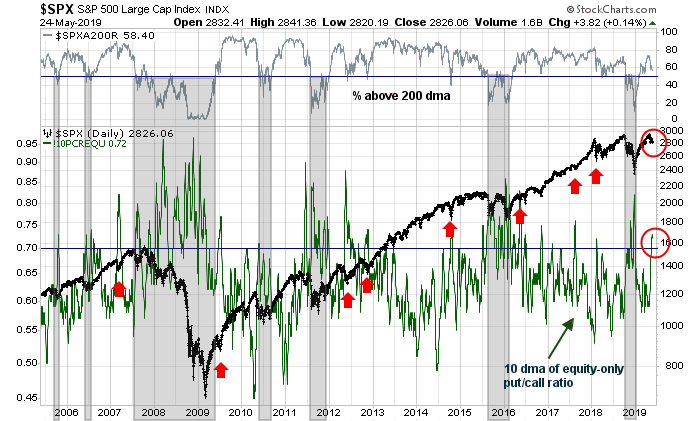
Consider how the technical and sentiment patterns developed in 2011. When the market fell in the summer of 2011, it began to exhibit a positive RSI divergence during the range bound chop. Sentiment, as measured by the VIX term structure and the 10-day moving average of the equity-only put/call ratio, spiked initially and then faded.
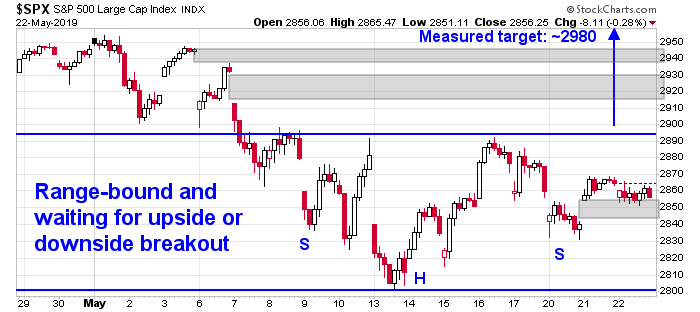
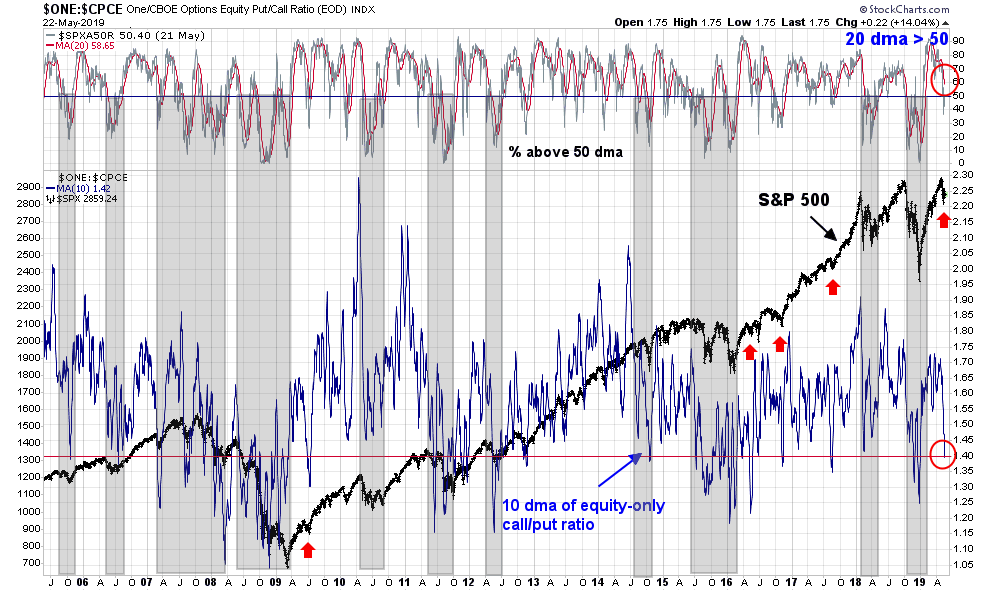
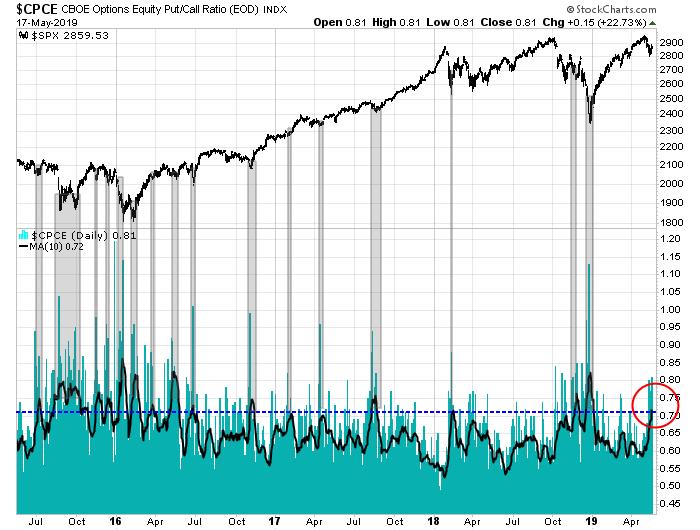
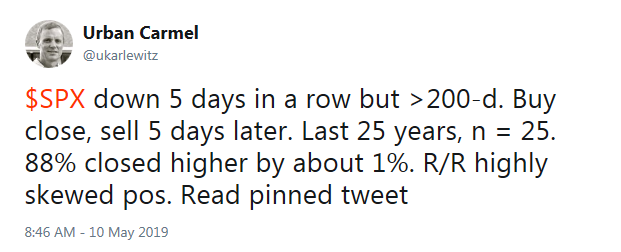
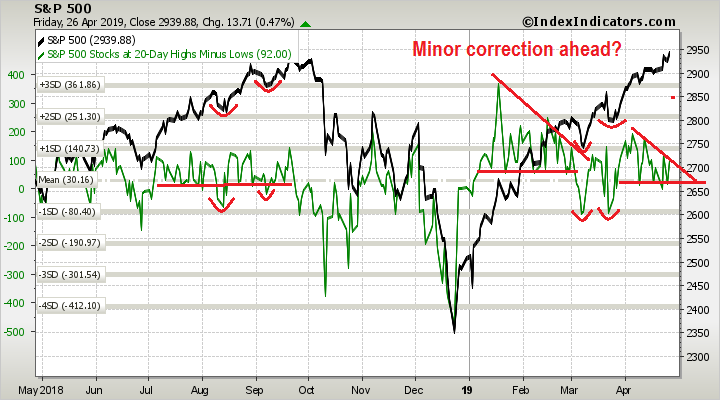
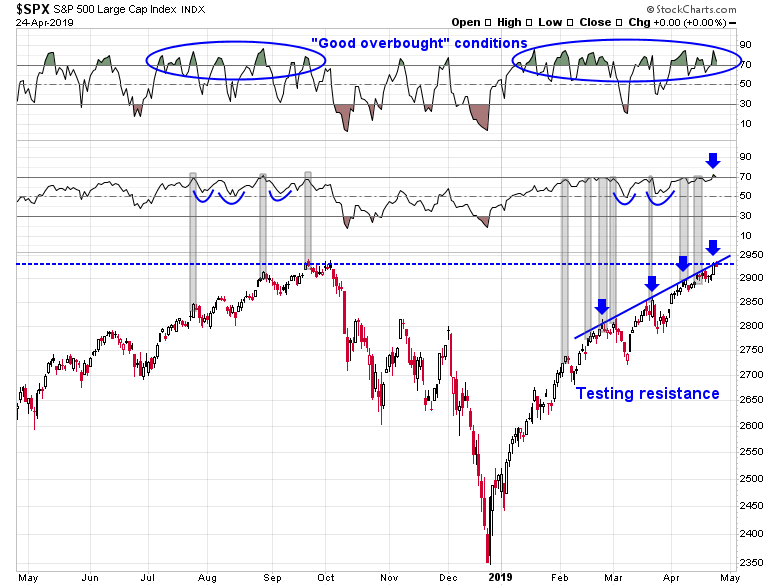
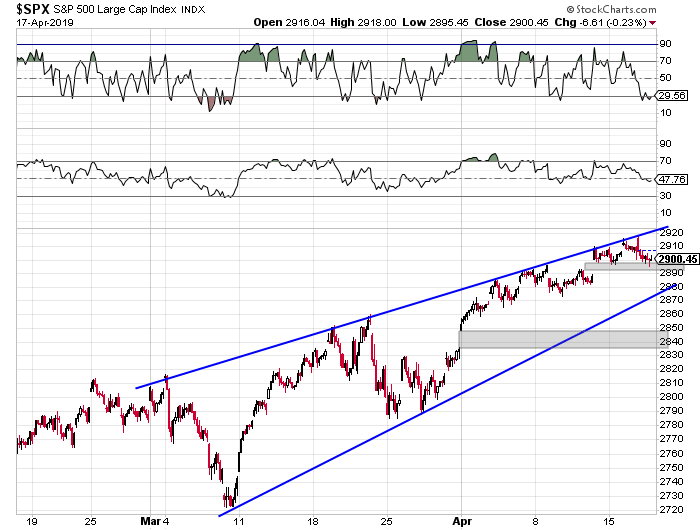
Fast forward to 2019. RSI is exhibiting a positive divergence as the index tested support at 2800. The 10 dma of the equity-only put/call ratio is making its initial fear spike, while VIX term structure fears are starting to fade. If the 2011 pattern were to be a template for 2019, 2800 support needs to hold and a trading range needs to develop as we await trade negotiation developments in the coming weeks and months.
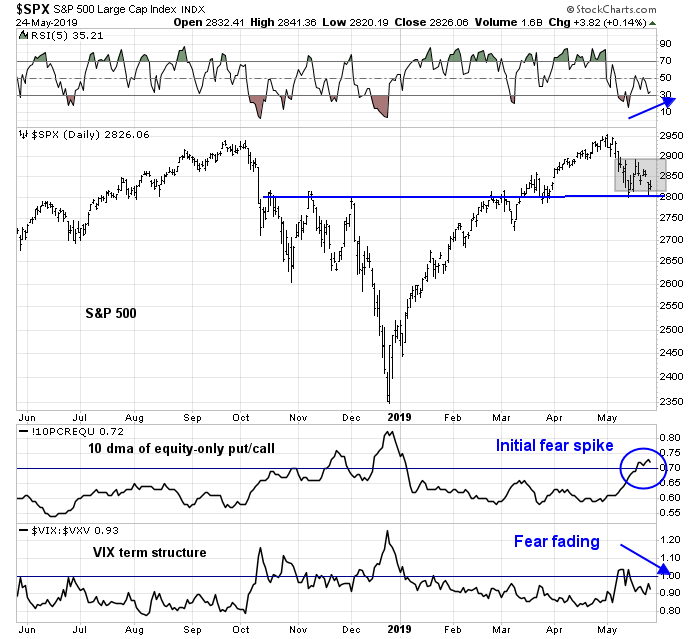
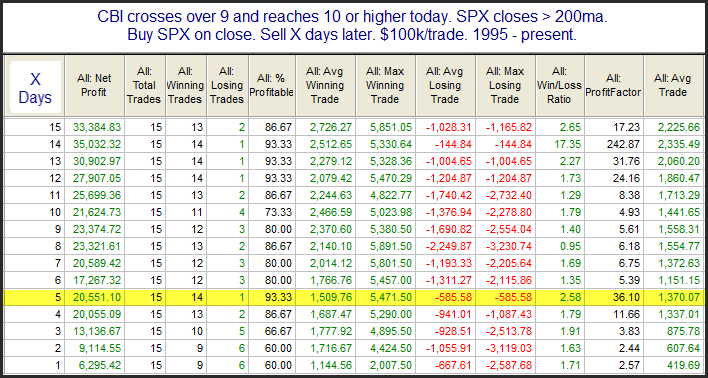
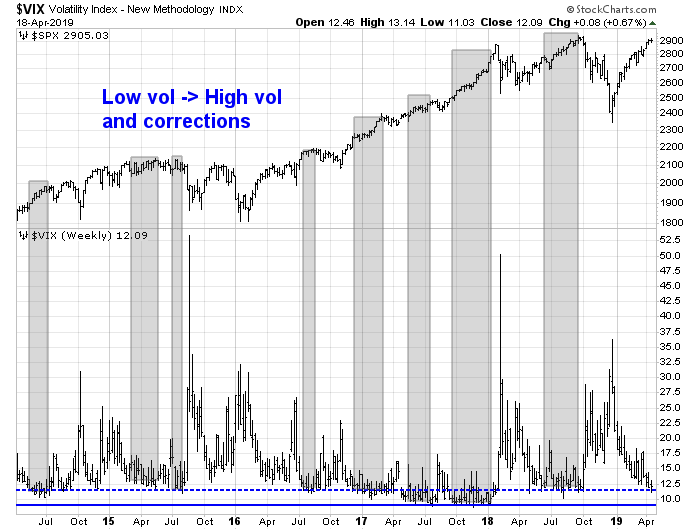
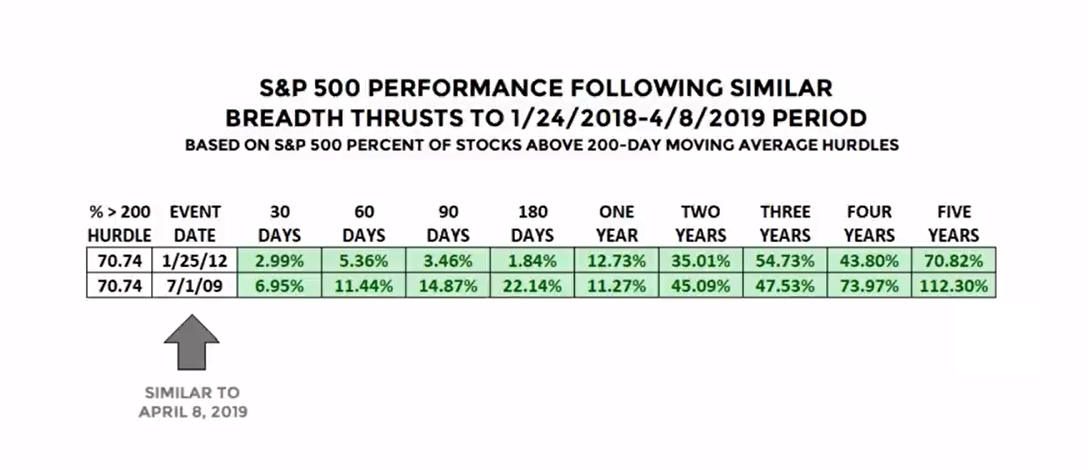
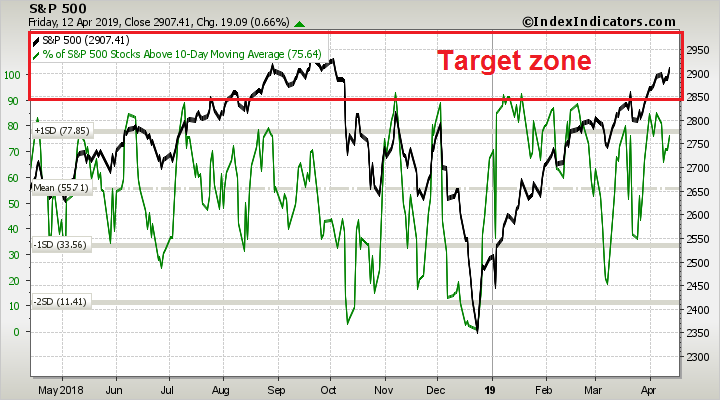
There are indications that fear levels are spiking. The 10 dma of the equity-only put/call ratio rose above 0.70. Past episodes of similar spikes when the market was not in a bear phase, as defined by % above 200 dma below 50%, (shaded regions) have seen low downside risk and V-shaped bottoms (red arrows).
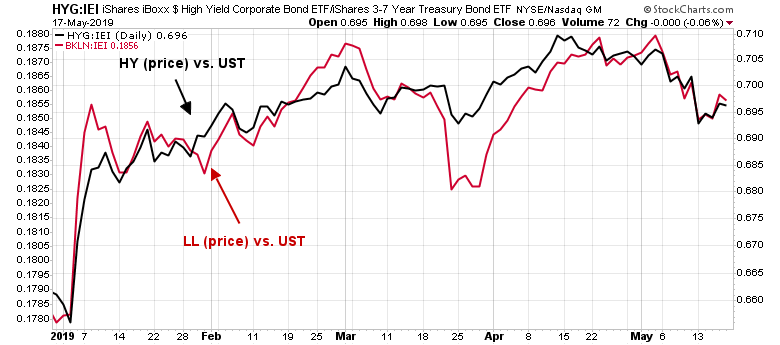
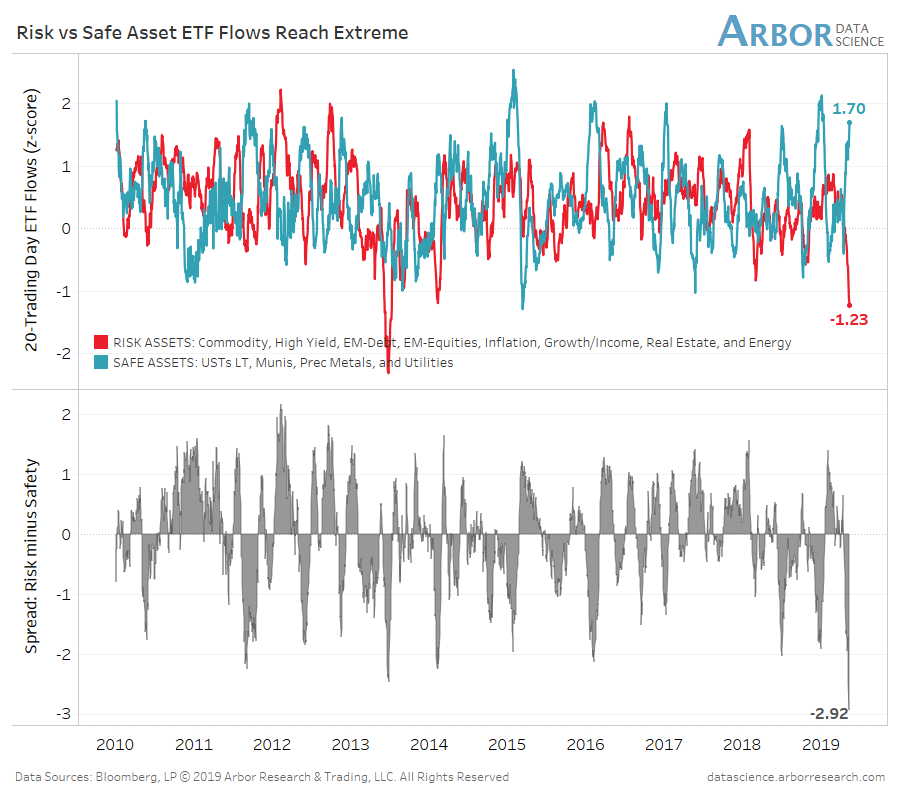
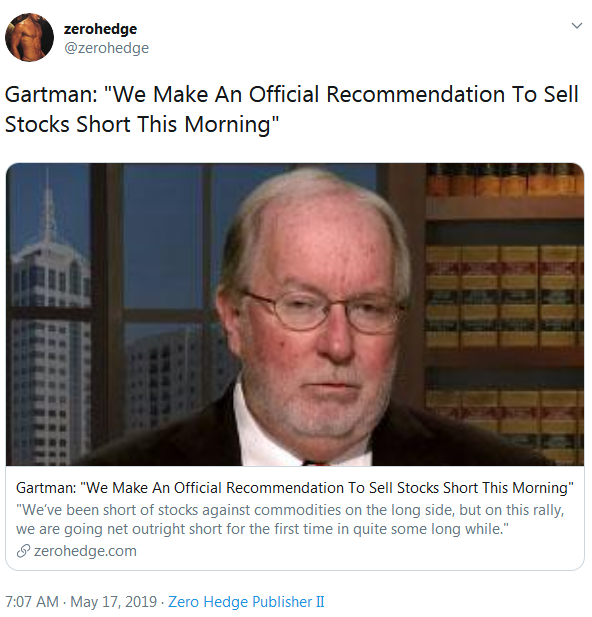
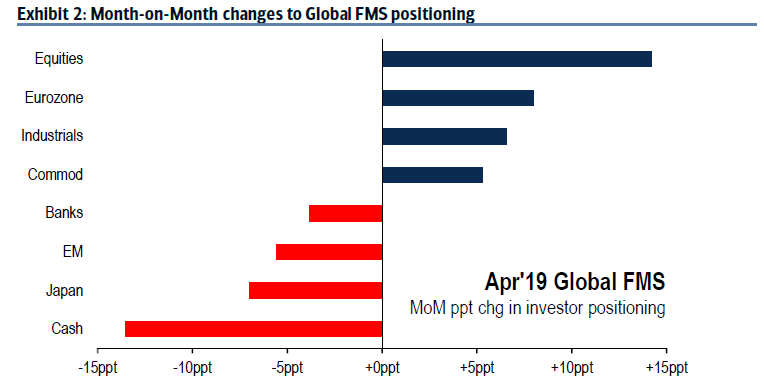
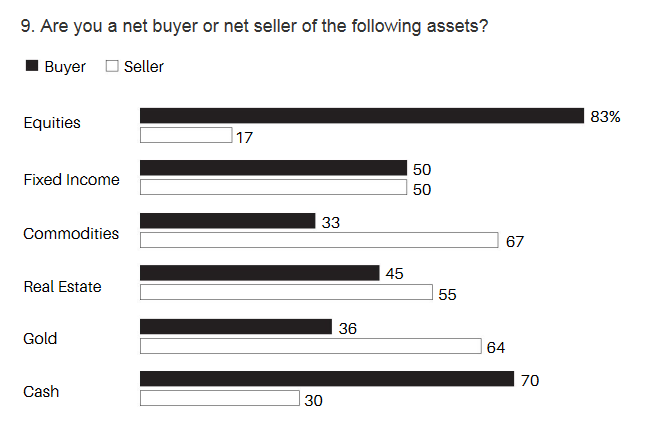
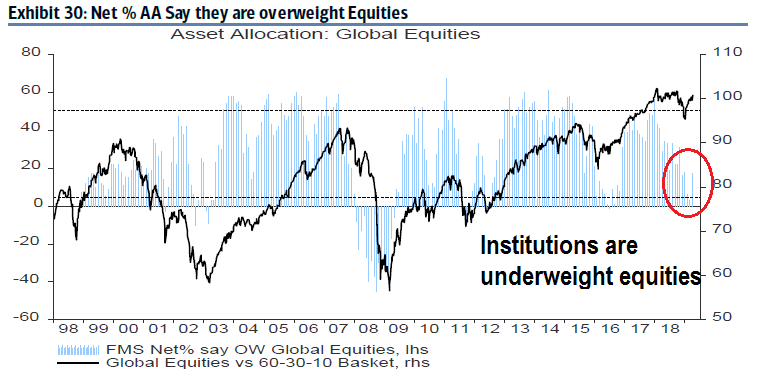
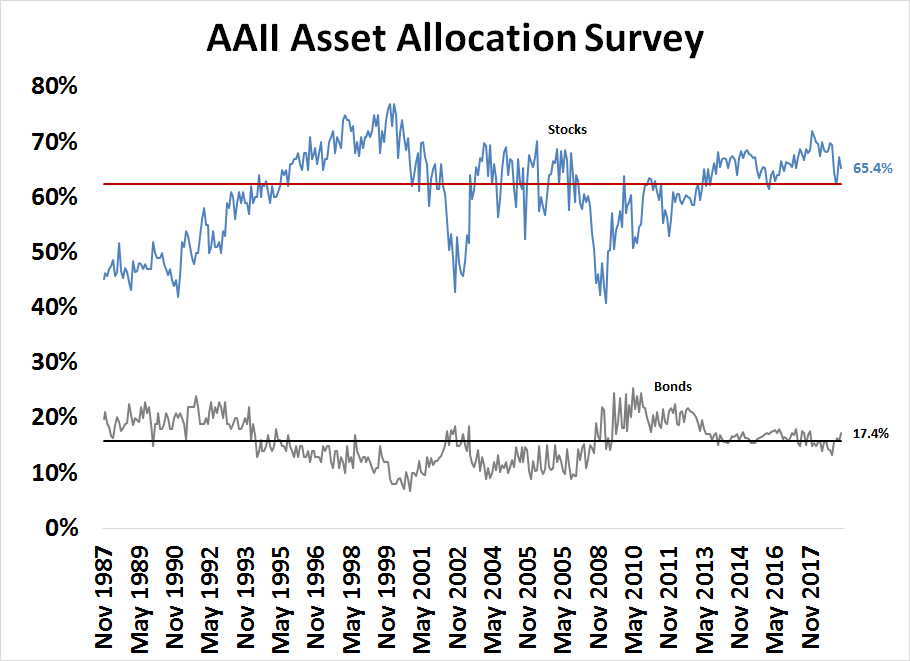
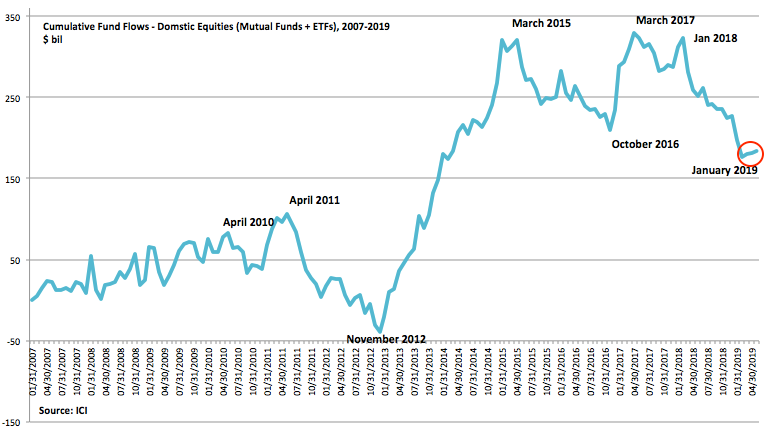
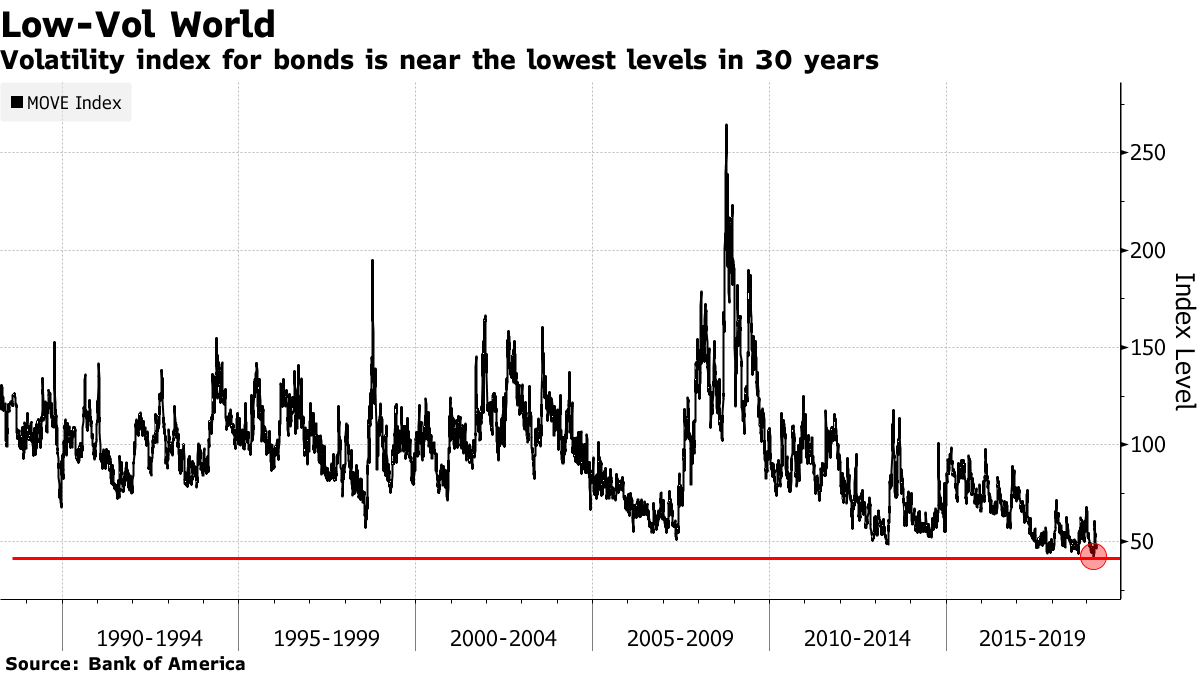
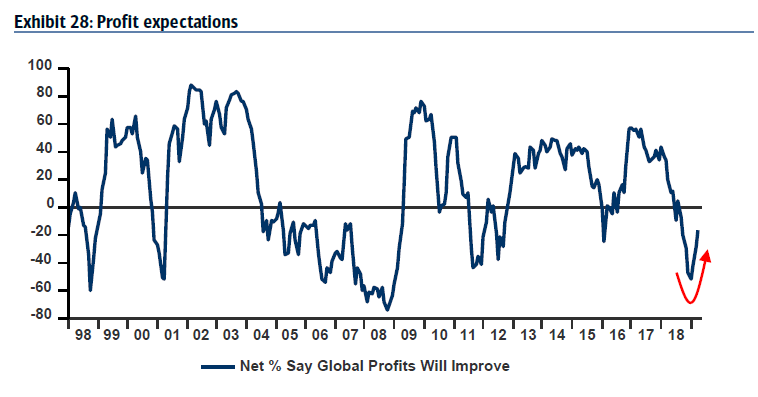
Kevin Muir at The Macro Tourist pointed out that bond sentiment is off the charts, indicating a stampede into defensive investments.
But the point to ask yourself is whether that is a good bet? I contend that with everyone leaning so heavily one way, the surprise will not be how much money they make, but instead if things don’t play out exactly as ominously as forecasted, how quickly the trade goes sour.
There is little room for error. Or put it another way, the global economy better collapse as quickly as these bears believe as even a lengthening of the process will make their trade unprofitable.

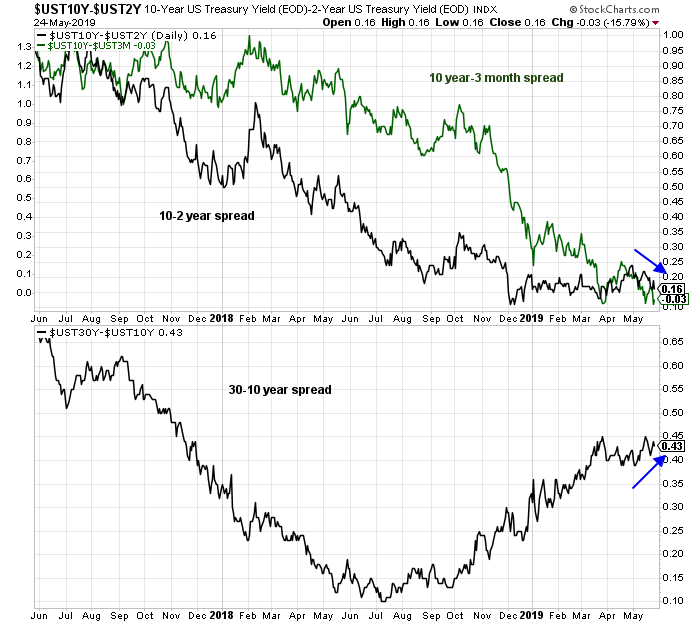
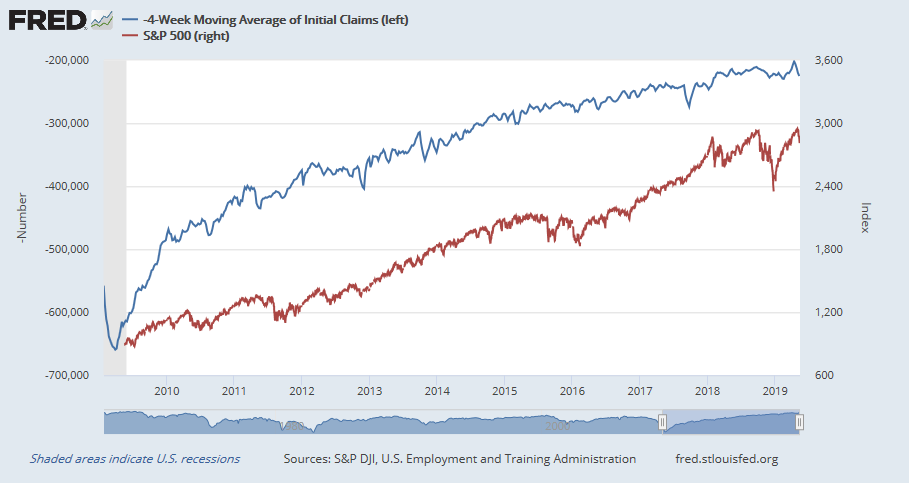
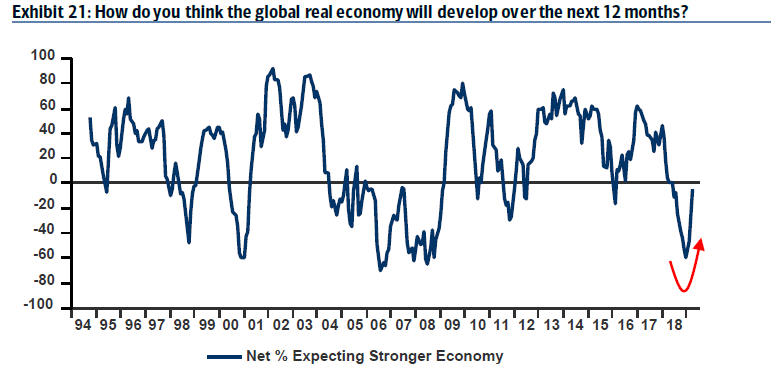
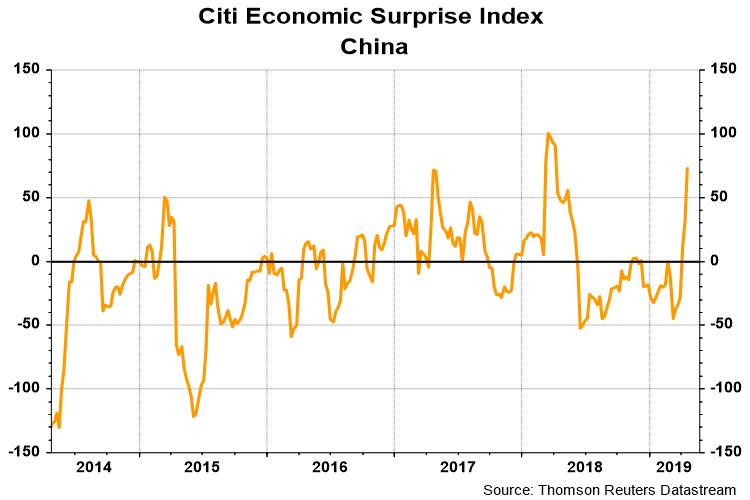
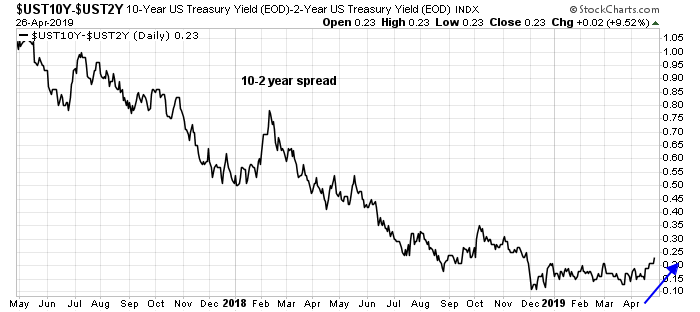
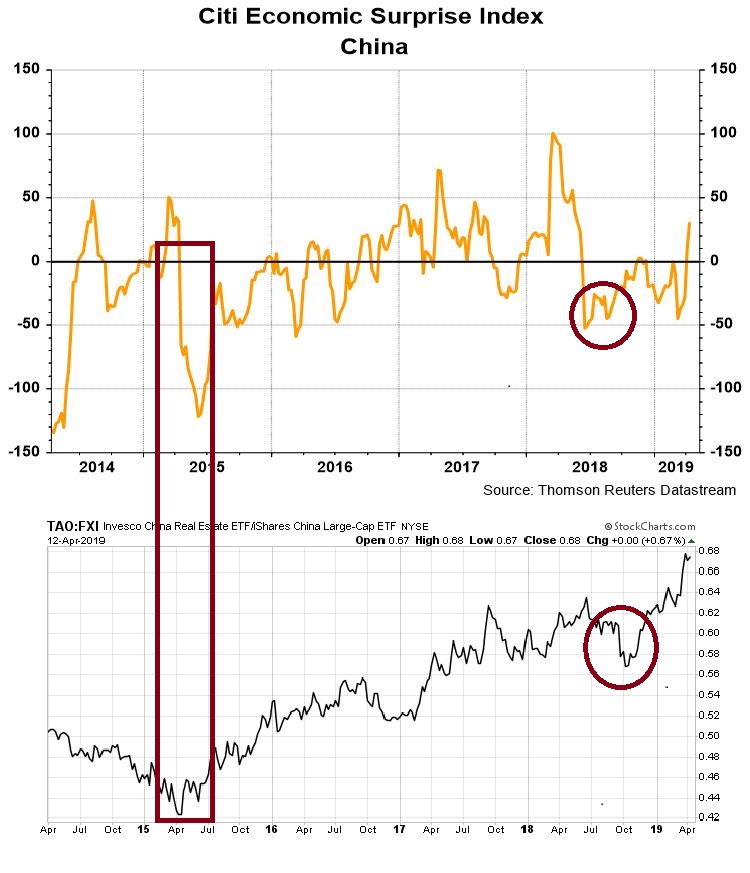
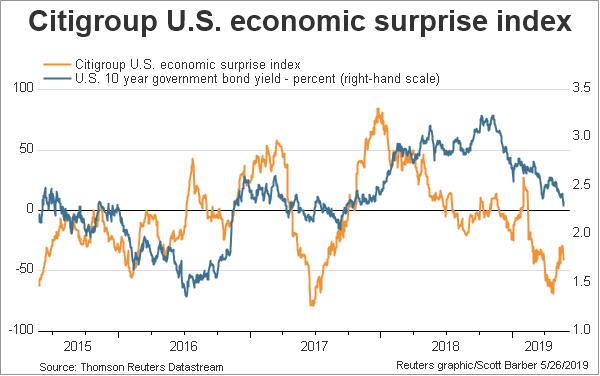
On the other hand, the Citigroup Economic Surprise Index, which measures whether top-down economic figures are beating or missing expectations, is rising, and that will put upward pressure on bond yields.
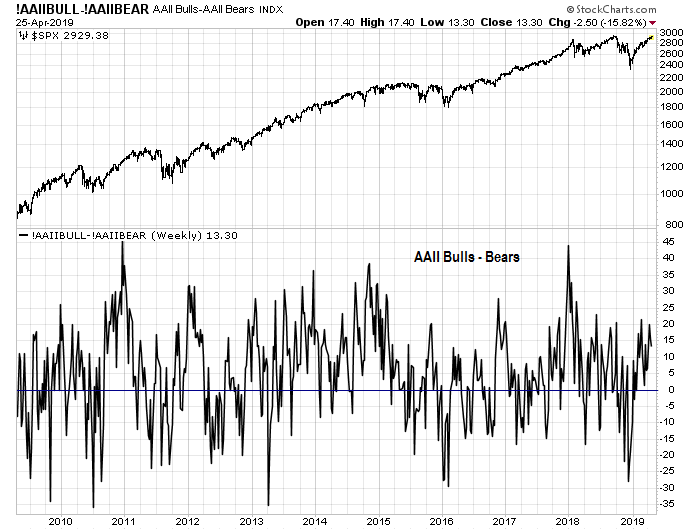
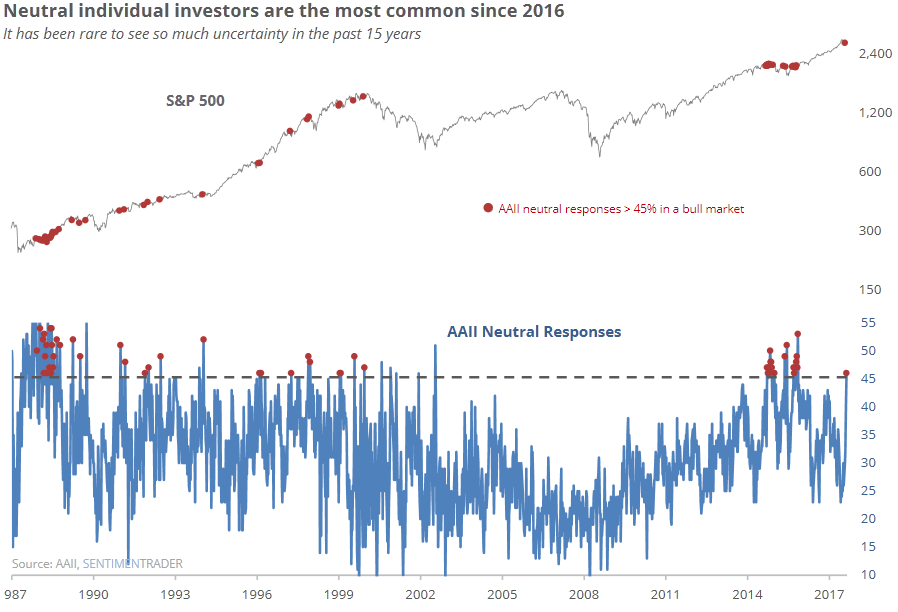
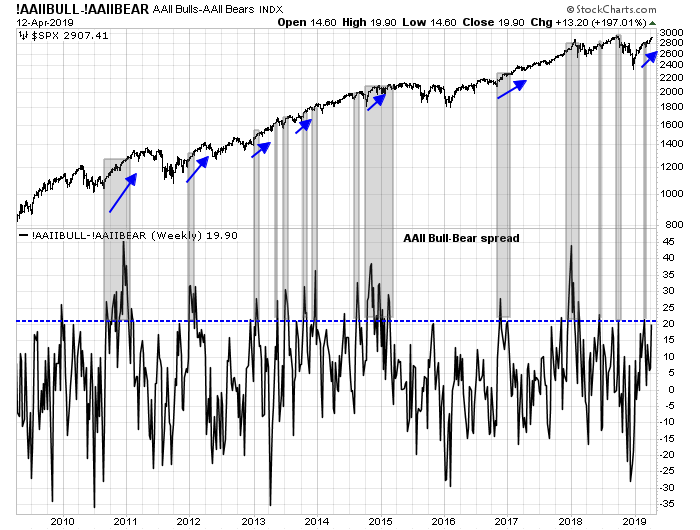
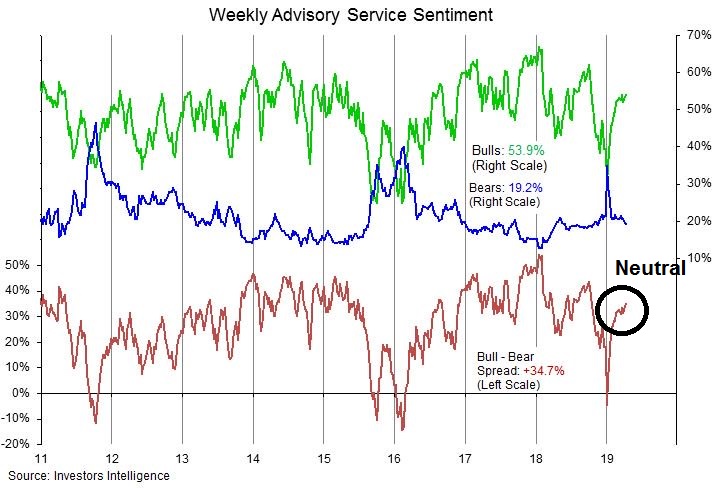
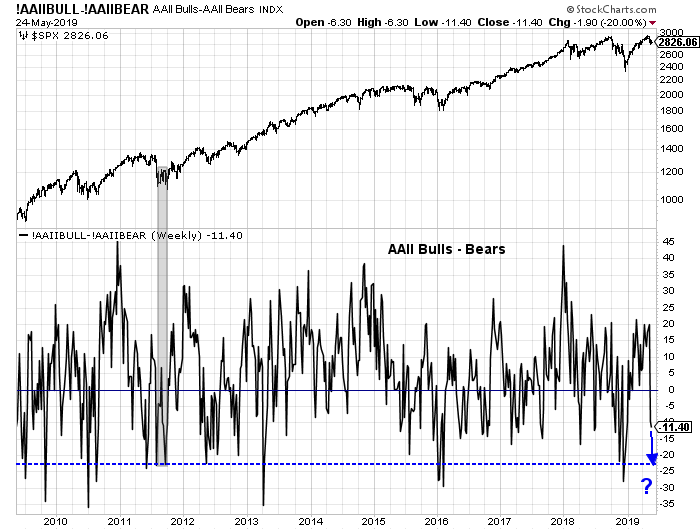
To be sure, this market may need a final flush before bottoming. Some sentiment indicators, such as the AAII Bull-Bear spread is -11, and it have not reached the “OMG sell everything” panic readings. However, we have seen past short-term bottoms with AAII sentiment at current levels.
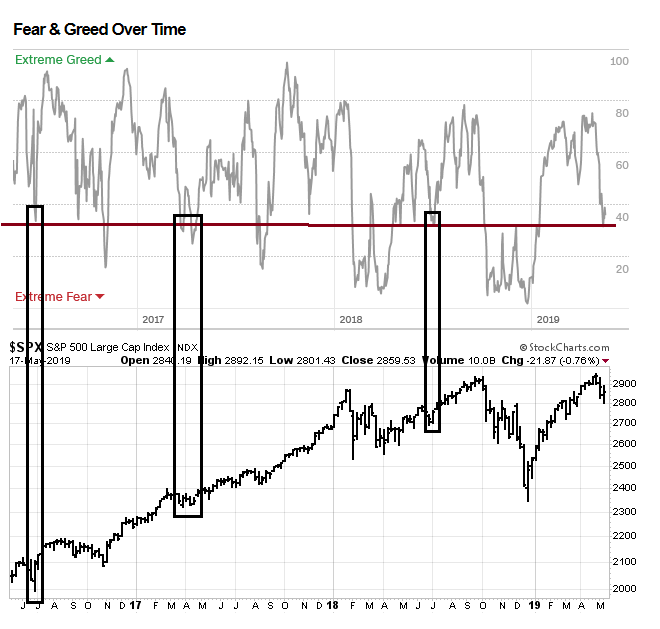
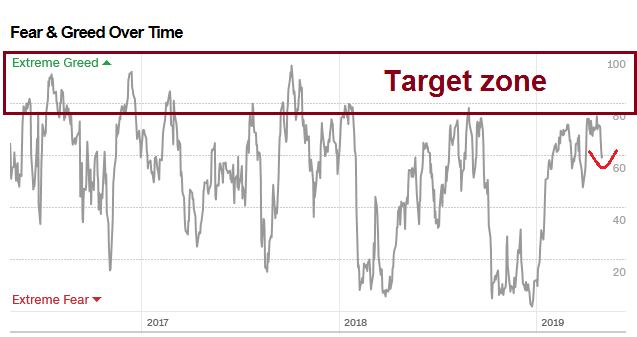
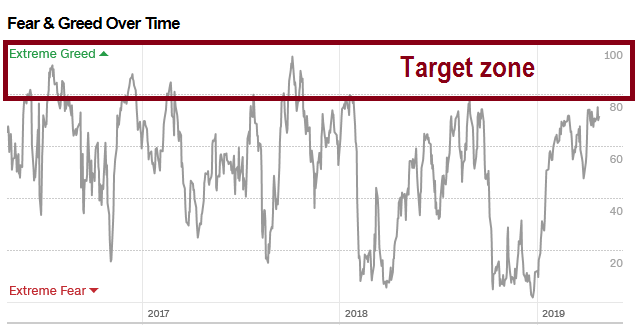
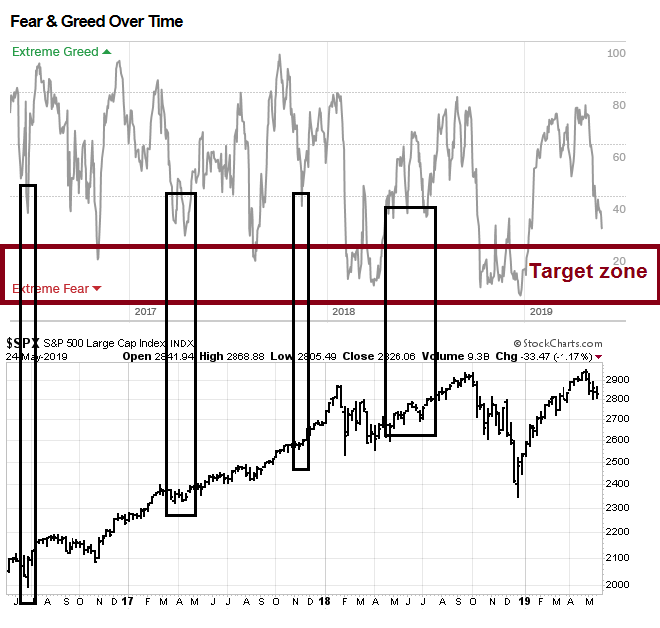
The CNN Business Fear and Greed Index is 27, which is low but not at the sub-20 target zone seen at bottoms. However, there have been other instances when the market has seen minimal downside risk with the index in the 20-40 range.
I conclude that the market is undergoing a bottoming process, though the jury is out whether the actual bottom is in. Stock prices are likely to be choppy and range bound for the next few weeks as it responds to trade negotiation headlines. While Trump the Tariff Man has adopted a belligerent tone, Trump the Dow Man has exhibited a pattern of making encouraging statements whenever stock prices near the bottom of its range.
This environment of uncertainty calls for investors to to maintain a neutral position on risk. If you don’t have an edge, why expose yourself? Adopt a wait and see position and stay at the portfolio’s investment policy asset allocation weights.
For traders, this argues for a buy-the-dip and sell-the-rip positioning until the impasse is resolved. Since the market is near the bottom of its range, the risk/reward relationship calls for a buy the dip position.
Disclosure: Long SPXL, TQQQ