Mid-week market update: I am publishing my mid-week market update early in light of the recent market volatility.
I use the Relative Rotation Graphs, or RRG charts, as the primary tool for the analysis of sector and style leadership. As an explanation, RRG charts are a way of depicting the changes in leadership in different groups, such as sectors, countries or regions, or market factors. The charts are organized into four quadrants. The typical group rotation pattern occurs in a clockwise fashion. Leading groups (top right) deteriorate to weakening groups (bottom right), which then rotates to lagging groups (bottom left), which changes to improving groups (top left), and finally completes the cycle by improving to leading groups (top right) again.
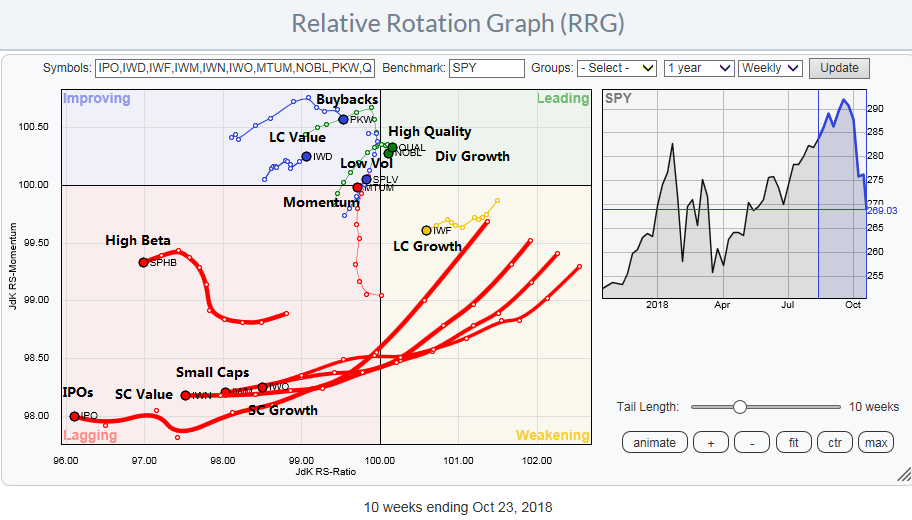
RRG analysis through a style, or factor, lens. Growth styles have been weak and they are located in the bottom half of the chart. By contrast, value styles such as dividend growth, high quality, large cap value are ascendant.
The RRG chart through a sector rotation lens tells a similar story. High beta sectors, such as technology, communication services, and consumer discretionary stocks are in the bottom half, indicating weakness. By contrast, defensive sectors such as healthcare, utilities and consumer staples are strong.
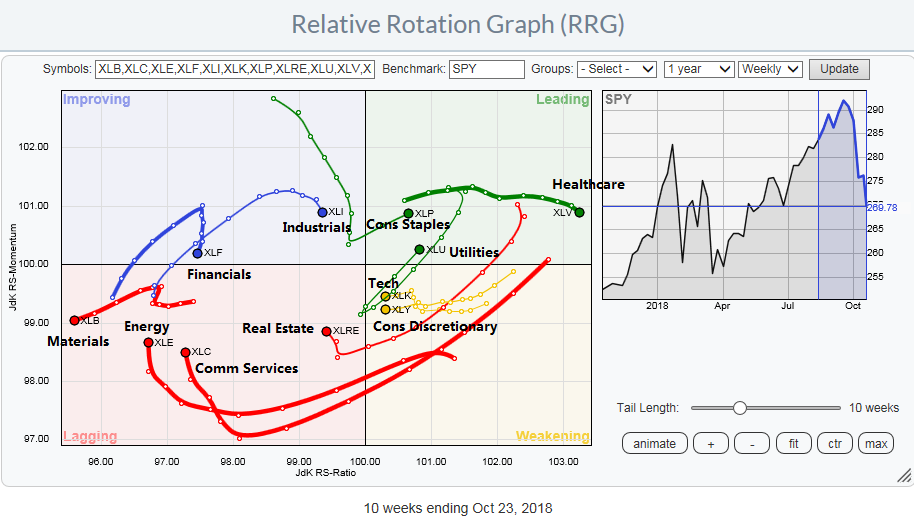
This kind of market action can be interpreted in two ways. On one hand, it is not unusual to see defensive sectors become the sector leaders during a market pullback. Once the bulls regain their footing, the high beta sectors can regain their footing and lead the market upwards again. On the other hand, the emergence of defensive and value leadership can be a signal of a regime shift where the bears are slowly taking control of the tape.
A value revival?
We can see signs of a reversal in the relative performance of growth and value stocks. The Russell 1000 Value to Russell 1000 Growth ratio bottomed recently while exhibiting a positive RSI divergence. Does this mean value is beginning to turn up?

Rising defensive leadership
The emergence of defensive sectors is actually global in nature. Callum Thomas of Topdown Charts documented how the cyclical to defensive performance ratio has been rolling over all around the world. The US is just a little late to that party.

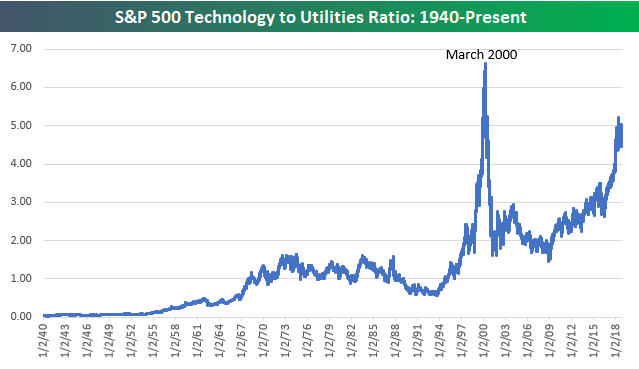
Bespoke also analyzed cyclical to defensive performance in two ways. The consumer discretionary to consumer staples ratio recently peaked at what may be a cycle high. The last peak occurred in March 2000, which coincided with the top of the NASDAQ bubble.

The technology to utility stock ratio looks even more ominous and speaks for itself.
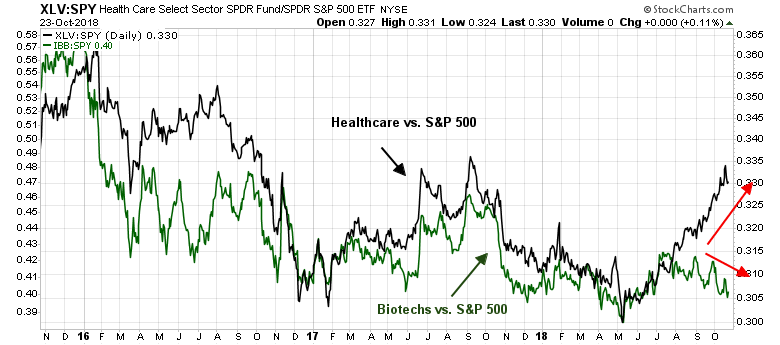
The bifurcation of the high beta vs. defensive stocks is evident within sectors as well. The chart below shows the relative performance of healthcare stocks and the relative performance of biotechs, which are part of the healthcare sector. The two have been tracking each other closely until early September, when the main healthcare sector began to outperform the market while the high beta biotech stocks lagged.
What the bulls have to do
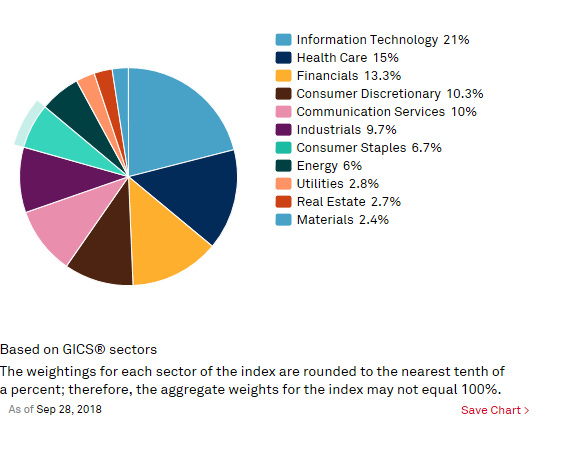
The sector weighting chart shows the challenges facing the bulls. While healthcare is the second large weight in the index, other heavyweight sectors such as technology, financials, consumer discretionary, and communication services have been weak. How can the index rise in the face of such weakness?
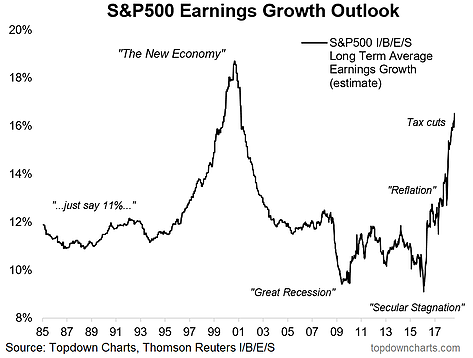
Callum Thomas also highlighted this rather ominous analysis showing the long-term earnings growth expectations from IBES. Are these growth estimates sustainable in the face of the poor relative performance of cyclical vs. defensive sectors?
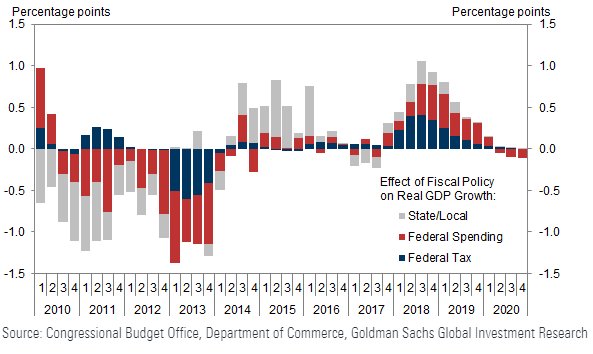
These growth projections are occurring during a backdrop when the fiscal stimulus boost from the tax cuts are starting to fade.
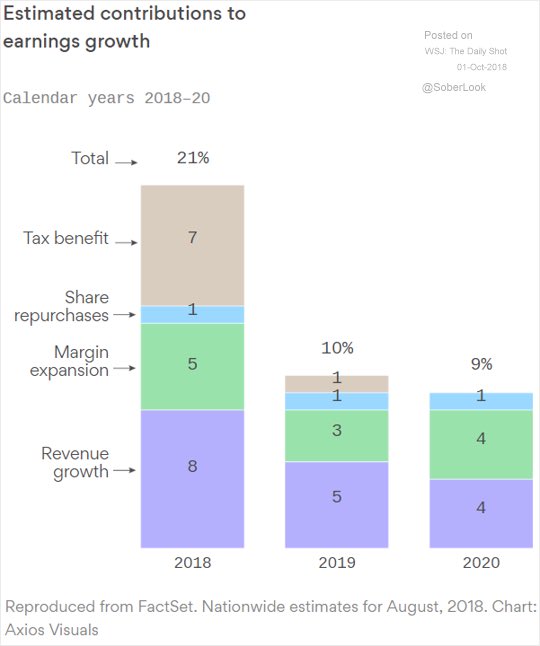
From a bottom-up viewpoint, the benefits of the tax cut to earnings growth is expected to shrink dramatically in 2019. As well, investors shouldn’t expect similar boosts from factors such as revenue growth and margin expansion.
Is the bull dying?
None of this means that investors should panic and sell everything right away. While there are some technical warnings, we don’t have a definitive sell signal just yet. CNBC reported that strategist Jim Paulsen of Leuthold Group indicate that the market may need a 15% gut check in order for the bull to continue:
“My guess is that we’re going to have a bigger correction than we’ve had yet,” said Paulsen on CNBC’s “Trading Nation” on Friday.
“I think a good gut check to sentiment, like a 15 percent correction, might be just the ticket to extend this bull market,” he added.
Paulsen told CNBC a correction is necessary to reflect a changing market environment where rates are on the rise, earnings are peaking, and economic growth might slow.
“What we need is a lower valuation, I think, to sustain a different environment if this recovery is going to continue,” he said.
“I don’t think we can handle that environment at 20-some-times trailing earnings, probably more like 15 to 16 times trailing earnings and we’re a ways from that,” the investor added.
In other words, the market needs a correction in order to have a valuation reset. Paulsen went to recommend that investors rotate into more defensive sectors, and I concur:
“It’s probably time to get more defensive and not have as much octane on from here as you have earlier in this bull market,” said Paulsen, highlighting safety sectors such as utilities, staples, and real estate investment trusts (REITs) as good bets in this environment.
From a technical perspective, here is the test for the bulls and bears. The McClellan Summation Index is at levels consistent with bounces if this is a pullback within a bull market, but it could fall further if a bear market has begun.

In short, the market is short-term oversold and poised for a bounce, if the primary trend is still bullish. If the trend is indeed changing, then the market is insufficiently oversold to bounce. Watch to see if the oversold rally materializes. If it does, watch the evolution of sector and style leadership. Can the high beta and high octane sector regain the upper hand?
Those will be the key tests for the bulls and bears in the days to come.
Disclosure: Long SPXU
Hello Cam, it looks like no TRIFECTA.
What does it mean for you?
Just a dead cat bounce?
Rally still possible for new highs?
….
Thanks and regards
It probably means that the market needs to re-test the lows and possibly break them, probably on some horrible news that you won’t want to buy.
That will be the trading bottom. We don’t have that kind of panic yet.
Trifecta hit…!!!
Cam Trifecta buy signal just registered, do you buy here the re-test?
As I pointed out in today’s and yesterday’s “trade alert” emails, you have to wait for TRIN to close above 2 for a Trifecta signal.
So if using ETF, the buy would be tomorrow morning if waiting for close of TRIN > 2 or will you pull the trigger right before close if 2+ TRIN is in the bag?
*If* we get the signal where TRIN spikes above 2 near the close, I would trade and buy at the close and not wait until the next day.
Caveat: These signals are not precise you may not lose much by waiting a day.
maybe scale 50/50 not a bad idea then. Thank you.
Make a series of purchases, down all the way to 2500, if we get there. Would love to see a spike in spot VIX to 30-40 range or higher. The recovery from here may not be a quick journey either.
Thanks
Value as defined generally will be a very bad place to be going forward. This sector is comprised of bargain stocks in relation to assets or PEs. Quite often they are bargains due to corporate problems. They are often in cyclical businesses. They often have borrowed too much which makes them interest rate sensitive.
In a recession, these company have their problems compounded and their profits decline. The shares do poorly as a result. In particular, small cap value will really suck. You can see that happening already in the graph above.
The Quality Sector will outperform in a recession/bear market. This is Buffett’s Coke investment type of choice. They go down in a bear but much less. Quality and Value sound the same but are very different.
Value and Quality are in the improving quadrant above but I would only look to own Quality.
Hi Cam , I noticed you said you did not see the 2008 crash coming, are you on your toes more looking out this time and did you learn from that ? I say that with no disrespect at all I just do not want through another 2008 myself, I am too old to wait to get back to even and will probably take a lot longer this time. Thank you
A review of my posts from 2008 shows that I was more focused on the investment process rather than the investment outlook. Nevertheless, I cautious all the way down:
http://humblestudentofthemarkets.blogspot.com/2008/02/smart-money-postured-for-recession.html
http://humblestudentofthemarkets.blogspot.com/2008/03/smart-funds-still-more-defensive-than.html
http://humblestudentofthemarkets.blogspot.com/2008/05/uh-oh.html
In October, I suggested that the market was likely to bottom out in the spring, which it did in March 2009:
http://humblestudentofthemarkets.blogspot.com/2008/10/does-market-bottom-in-1q2q-2009.html
About a week before the March bottom, I gave a qualified buy signal to buy beaten up low priced stocks between $1 and $5:
http://humblestudentofthemarkets.blogspot.com/2009/02/phoenix-rising.html
Thank you for the reply , will you have a different approach to the next bear I hope ?