Preface: Explaining our market timing models
We maintain several market timing models, each with differing time horizons. The “Ultimate Market Timing Model” is a long-term market timing model based on the research outlined in our post, Building the ultimate market timing model. This model tends to generate only a handful of signals each decade.
The Trend Model is an asset allocation model which applies trend following principles based on the inputs of global stock and commodity price. This model has a shorter time horizon and tends to turn over about 4-6 times a year. In essence, it seeks to answer the question, “Is the trend in the global economy expansion (bullish) or contraction (bearish)?”
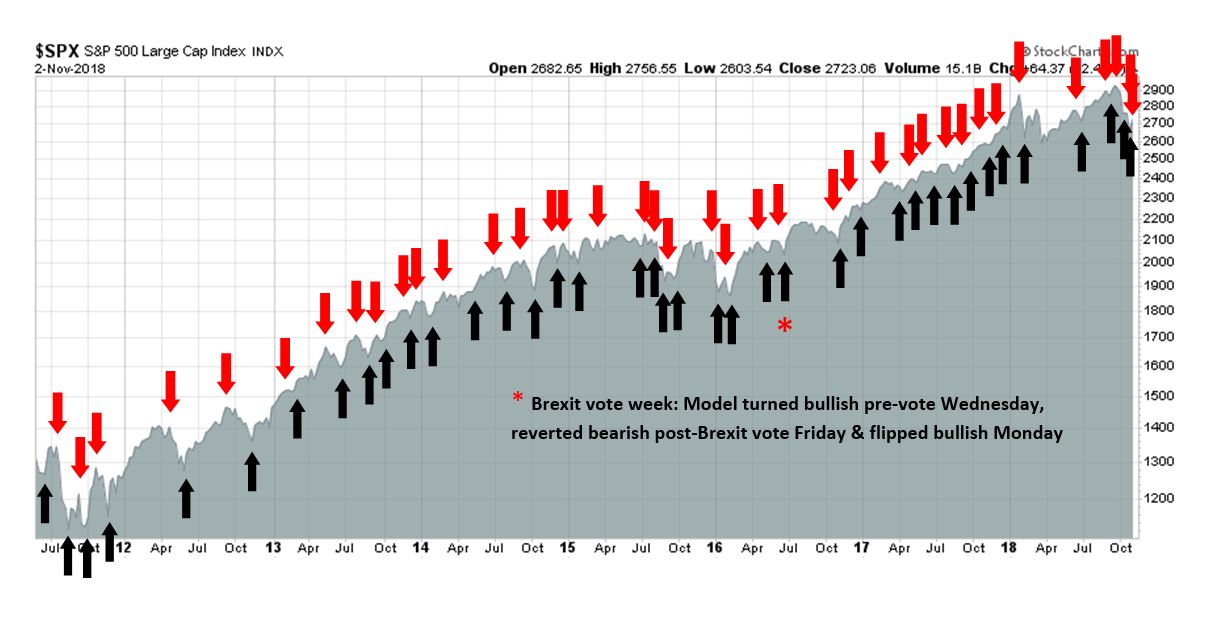
My inner trader uses the trading component of the Trend Model to look for changes in the direction of the main Trend Model signal. A bullish Trend Model signal that gets less bullish is a trading “sell” signal. Conversely, a bearish Trend Model signal that gets less bearish is a trading “buy” signal. The history of actual out-of-sample (not backtested) signals of the trading model are shown by the arrows in the chart below. The turnover rate of the trading model is high, and it has varied between 150% to 200% per month.
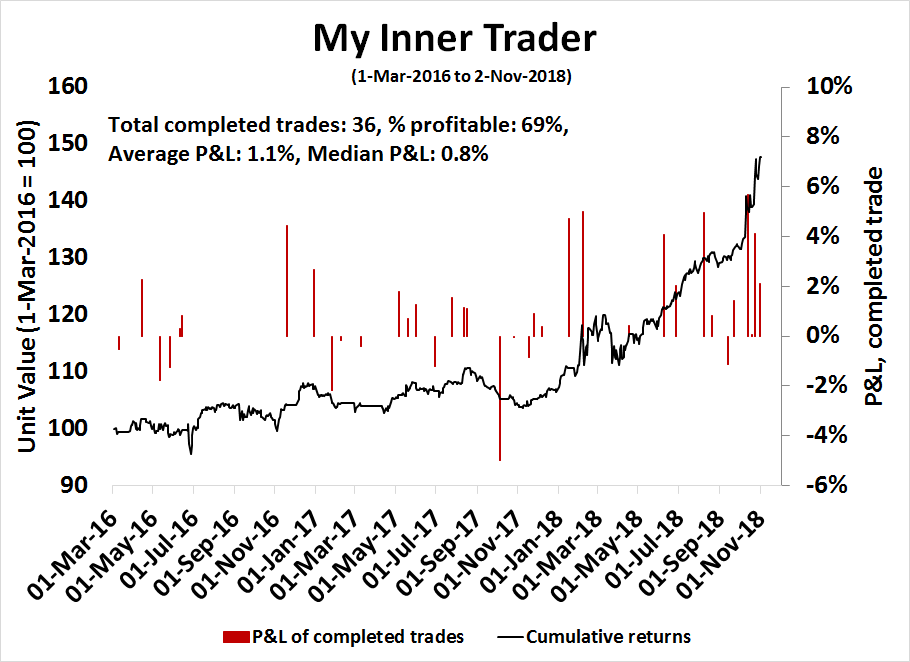
Subscribers receive real-time alerts of model changes, and a hypothetical trading record of the those email alerts are updated weekly here. The hypothetical trading record of the trading model of the real-time alerts that began in March 2016 is shown below.
The latest signals of each model are as follows:
- Ultimate market timing model: Buy equities
- Trend Model signal: Bearish
- Trading model: Bearish
Update schedule: I generally update model readings on my site on weekends and tweet mid-week observations at @humblestudent. Subscribers receive real-time alerts of trading model changes, and a hypothetical trading record of the those email alerts is shown here.
A made in China selloff?
There is a family joke in our household that Santa Claus doesn’t live at the North Pole, but in China. That’s because everything he bring says “Made in China”.
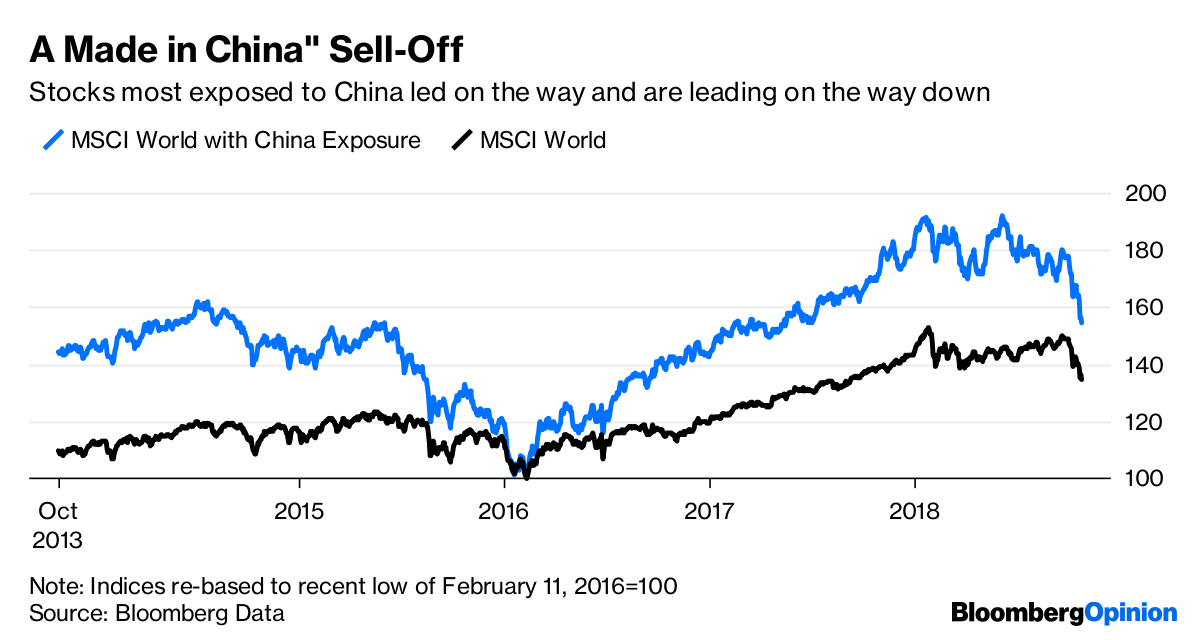
There have been many explanations for the recent market swoon, such as rising rates, earnings disappointment, or earnings growth deceleration from the fading effects of the tax cuts, and so on. John Authers, who is now at Bloomberg, pointed out that the recent sell-off may have been made in China.
Volatility returned to U.S. stocks again Monday afternoon. This is still, I think, largely about forced sellers as speculators such as hedge funds get used to the reality of having to operate with less leverage. But it would be wise to note that there is obviously a Chinese component to this. Since 2016, the more a company was exposed to China, the better it had done. But that has all changed in recent weeks, and those companies are doing worse.
It’s starting to look that way. After Trump tweeted about his “good conversation” with Xi Jinping, and Bloomberg reported that he asked his cabinet to draft a possible deal with China (what have they been doing all along?), global markets went full risk-on Thursday night. Stock prices reversed themselves Friday after White House officials denied that there were any cabinet preparations for a trade plan with China. The market partially recovered when Trump contradicted his staff and stated that he thinks the US will reach a trade deal with China.
If the Made in China thesis is correct, investors need to adjust the macro, fundamental, and technical analytical framework from a purely domestic focus to one more global in nature. This week, I explore the underpinnings of this hypothesis, and the steps to take should it be correct.
Risk levels rising
I have been writing about how risk levels are rising in China, and I don’t want to repeat myself (see The brewing storm in Asia and Is China ready for the next downturn?). Here are some additional data points of vulnerability that I haven’t covered in the past.
The WSJ reported on IMF analysis which concluded that Chinese bond trading is so acutely dependent on repos that changes in interbank rates have dramatic impact on volume and liquidity. In effect, liquidity could dry up just as market funding seizes:
According to the IMF’s October 2018 Global Financial Stability Report, trading volumes of Chinese government and corporate bonds have been far more volatile than in the U.S.
That is likely because most bond purchases in China were financed with borrowed money. In 2017, repo borrowing was 15 times the size of average daily trading volumes in the Chinese bond market, twice as high as the peak level recorded in the U.S.
Over the past few years, Chinese bond trading slumped whenever the cost of short-term borrowing rose. Activity surged when interest rates fell. Bond-trading volumes have fluctuated by as much as 200% in a year, according to the IMF report, following that pattern.
“This procyclical link between bond trading and financial conditions represents a significant vulnerability in China’s financial markets,” wrote IMF financial-sector expert Henry Hoyle. The concern is that bond-market liquidity could rapidly dry up if interest rates shift quickly, making it difficult for financial institutions to sell assets or roll over their repo loans to fund themselves.
A vicious circle could result if higher demand for short-term borrowing pushes rates higher and further reduces liquidity, according to Mr. Hoyle.
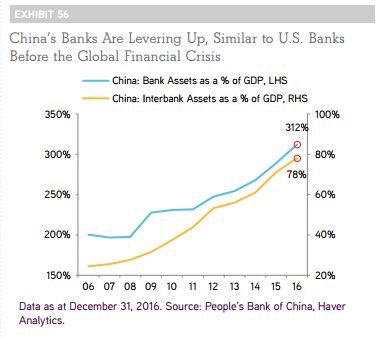
This heightened fragility is occurring against a backdrop of rising leverage among China’s banks.
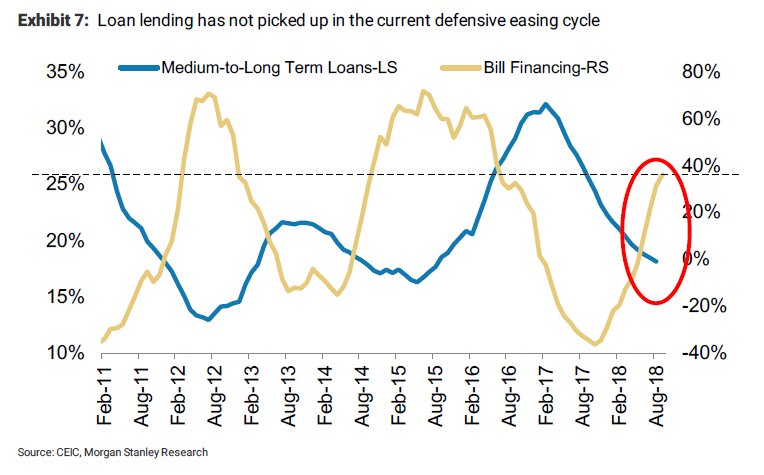
Analysis from Morgan Stanley also indicated that China’s credit creation may be slower than headline figure suggests – there’s more short-term bill financing, less medium and long-term lending. This represents the classic asset-liability mismatch that is the root of virtually all banking crises.
I outlined in the past how property developers have been discounting unsold units, which has led to protests by buyers who bought in at higher prices. Deutsche Welle reports that the phenomenon is so widespread it now has a name, “Fang Nao”:
The property protests have not been limited to Shanghai and, in some instances, have even turned violent. In Xiamen, in China’s southeastern Fuijian province, anger spilled out on the streets after the price of one luxury villa was cut by 2 million yuan, having sold for more than 5 million a year earlier.
Such was the bitterness at the price drop, the developer — China’s largest residential real estate company, Vanke — was pressured to pay out a million yuan in compensation to some 100 existing owners.
Similar protests in Shangrao, Xiamen, Guiyang, and Hangzhou saw property owners demand the return of their money from construction firms, amid fears their losses could be much larger than in a previous downturn in 2014.
Property protests are becoming so regular in China that a new term has emerged on social media. “Fang Nao” literally means property trouble-making.
Enter property developer and debt behemoth China Evergrande, whose profile was documented by FT Alphaville:
It boasts an enterprise value of $145bn. In the first half of the year it generated $44bn of revenues and $4.5bn of profits, paying out half in dividends. It has $98bn of debt, $44bn of it due within the next twelve months.
The answer is China Evergrande, a real estate kraken with tentacles stretching across China. It does all things property including development, investment, management and construction, along with a host of smaller ventures in technology, finance and healthcare.
That reach makes some of the numbers mind boggling, particularly when it comes to the company’s debt. For instance, it paid $4.2bn of interest over the first six months of 2018 — more than the revenues of 259 of the S&P 500’s constituents in the same period, according to S&P Capital IQ.
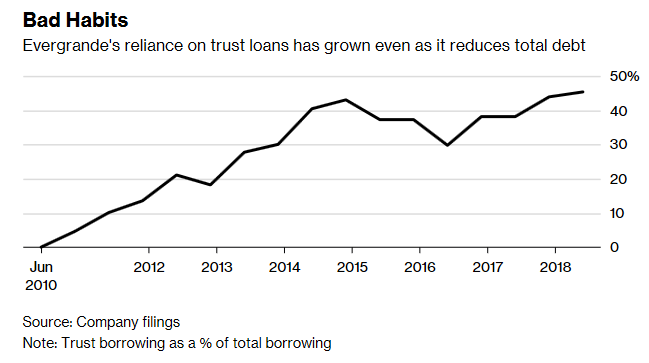
According to this Bloomberg article, its debt profile is…interesting. It has about US$100b in debt, but it is highly reliant on trust loans derived from the shadow banking system.
Trust financing accounted for about 45 percent of Evergrande’s total borrowing at the end of June, the largest chunk since at least 2010. That’s led to an “uneven capital structure,” according to S&P Global Ratings analyst Matthew Chow.
Most of Evergrande’s publicly traded peers are much less reliant on such funding. Longfor Group Holdings Ltd. and China Resources Land Ltd. say they don’t use trusts, while China Vanke Co. gets about 18 percent of its financing from sources other than banks and bonds.
In a separate article, Bloomberg reported that the company’s chairman bought $1b of a $1.8b bond issue to signify “support and confidence in the Group”:
China’s most indebted property developer made an unusual move to buy $1 billion of its new $1.8 billion notes priced on Tuesday, as he seeks to lend support to the group.
Hui Ka Yan, chairman and executive director of China Evergrande Group, purchased $250 million each of its 2022 and 2023 bonds, while his wholly-owned Xin Xin (BVI) Ltd. bought another $250 million each of those two notes, according to a statement to Hong Kong stock exchange on Wednesday.
Hui followed through with the purchase after expressing interest to buy the notes on Tuesday. “The purchase is being undertaken to signify Mr. Hui’s support to and confidence in the Group,” the company said in the filing on Wednesday. The terms of the purchase of the notes by Hui and Xin Xin are the same as other investors in the debenture that was issued Tuesday, according to the statement.
Evergrande’s latest bond offering comes amid government effort to rein in property prices in China, which has made funding more expensive for developers. The company has relied more on high-cost trust funding recently, which accounted for about 45 percent of its total borrowing at the end of June, the most since at least 2010.
A vote of confidence, or signs of a company under stress?
Widespread weakness
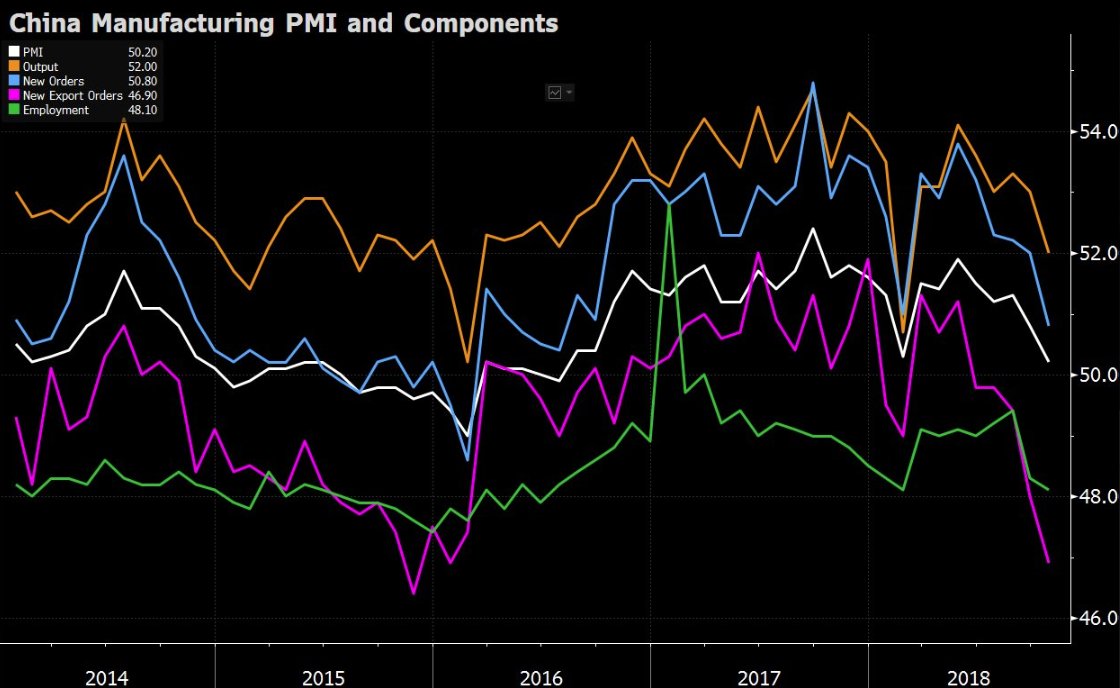
In the meantime, the signs of economic weakness are widespread. The release of the latest PMI and its components tell the story. More importantly, new export orders and employment are dropping and below 50, indicating contraction.
Even worse, satellite imagery indicates that manufacturing output may be faring even worse than the official PMI figures. While the official PMI reading of 50.20 was soft and below market expectations, satellite data suggests the manufacturing sector may be in outright decline.

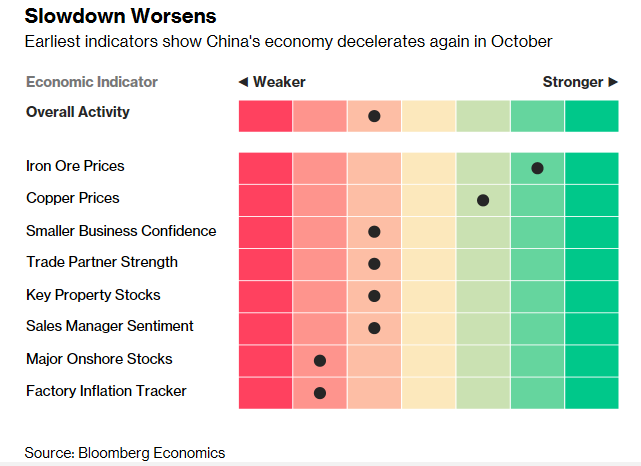
Estimates from Bloomberg Economics indicate that economic conditions are weakening across the board, and sentiment is very poor, especially among smaller firms.
The weakness was confirmed by the PMIs of Asian trading partners Taiwan, Malaysia and Thailand, which also fell below 50 in October, indicating contraction.
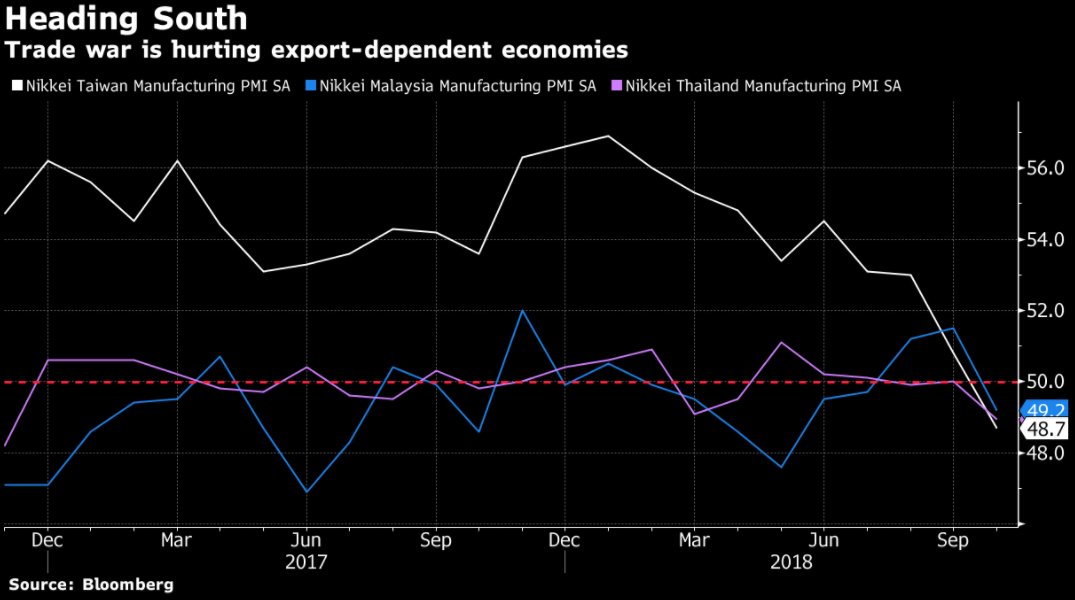
The stock indices of major Asian trading partners are all trending downwards, indicating a weakening regional economy.

Tariffs: They have not begun to really bite
What about the trade war? The effects of the tariffs have not fully hit the economy. The chart below shows the differences between the scope and size of the announced and implemented tariffs.
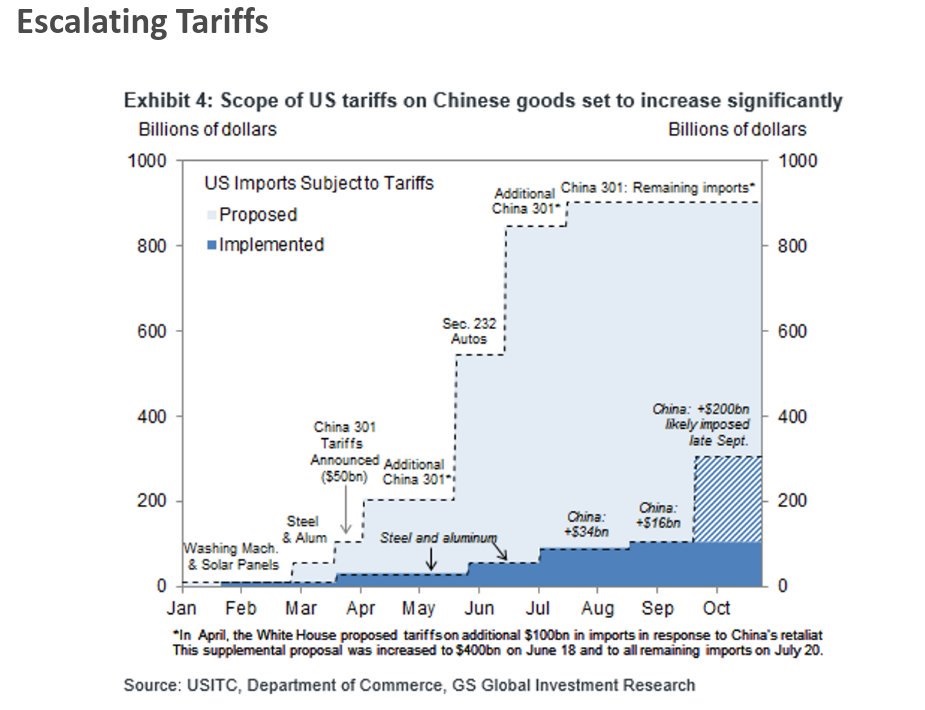
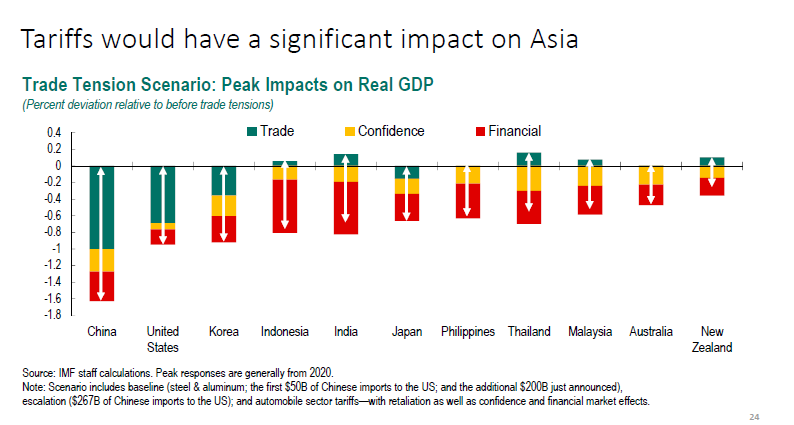
The 10% tariff rate on $200 billion is set to rise to 25% on January 1, 2019. In addition, news reports indicate that the US is prepared to slap tariffs on an additional $257 billion on Chinese exports should the Trump-Xi meeting fail at the G20 meeting in late November. The new tariffs are expected to be implemented in January. The IMF estimates that a full-blown trade war would reduce China’s GDP growth by 1.6%, the US by about 1%, and the effects would be felt throughout Asia.
China Beige Book’s Leland Miller stated on CNBC that the effects of the trade war haven’t fully hit China’s economy yet:
China’s economy could be facing a tough winter as economic growth slows and the effects of a trade war with the United States begin to take hold, data analyst Leland Miller told CNBC on Monday…
“The tariff situation has created a very bad potential problem for [the] China fourth quarter of this year, potentially in a big way first quarter” next year as well, Miller said on “Squawk Box.”
Even if the U.S.-China trade dispute were resolved Jan. 1, “the Chinese economy will be hurting very badly” despite some other “growth engines not doing as poorly,” Miller said.
What about the news that Trump asked his cabinet to prepare for a trade deal with China, which was later denied by White House officials?
Call me skeptical, but short of a major breakthrough in talks, which have been nonexistent, the underlying issues remain unresolved. The dispute is about the reversal of a trade deficit, and the reversal of China’s industrial strategy. The idea that a “trade peace” will suddenly break out is far-fetched, especially in light of the Commerce Department’s decision to restrict Chinese chipmaker Fujian Jinhua from buying American electronic components. In all likelihood, the talk is nothing more than a stunt to position the Trump administration in a favorable light ahead of the midterm elections.
Beijing to the rescue?
Bloomberg reported that a Politburo meeting signaled that China is planning more stimulus as a response to the widespread signs of economic weakness:
China’s leadership signaled that further stimulus measures are being planned, as disappointing economic data showed that the current piecemeal approach isn’t working.
The nation’s economic situation is changing, downward pressure is increasing, and the government needs to take timely steps to counter this, according to a statement from a Politburo meeting Wednesday chaired by President Xi Jinping.
The signal of increasing urgency came just hours after purchasing manager reports showed an across-the-board deterioration that risks spilling into a broader drag on global growth. The world’s second largest economy is being damaged by its trade war with the U.S. and a domestic debt cleanup.
With those pressing constraints, officials have added modest policy support so far, ranging from tax cuts to regulatory relief, rather than repeating the fiscal firepower seen after a previous slowdown. Investors seem unpersuaded by the drip-feed approach with the yuan hovering around a decade low and stocks sliding.
Caixin reported that “deleveraging” has been left off the agency of the Politburo meeting. This may be a sign of panic, as the authorities are throwing out their playbook on controlling debt.
It may not be enough. I had previously highlighted analysis by Michael Pettis that China may be hitting a debt wall. He concluded that China has four unenviable policy choices:
If the global trade environment forces a contraction in China’s current account surplus, I argue, by definition it also forces a contraction in the gap between Chinese savings and Chinese investment. This means that either the country’s investment share of GDP must rise or the savings share must decline (or some combination of the two). There are literally only four ways that either of these outcomes can happen. Consequently, there are also only four ways that Beijing can respond, each of which would drive the economy to one of the four possible outcomes (or some combination of them):
- Raise investment. Beijing can engineer an increase in public-sector investment. In theory, private-sector investment can also be expanded, but in practice Chinese private-sector actors have been reluctant to increase investment, and it is hard to imagine that they would do so now in response to a forced contraction in China’s current account surplus.
- Reduce savings by letting unemployment rise. Given that the contraction in China’s current account surplus is likely to be driven by a drop in exports, Beijing can allow unemployment to rise, which would automatically reduce the country’s savings rate.
- Reduce savings by allowing debt to rise. Beijing can increase consumption by engineering a surge in consumer debt. A rising consumption share, of course, would mean a declining savings share.
- Reduce savings by boosting Chinese household consumption. Beijing can boost the consumption share by increasing the share of GDP retained by ordinary Chinese households, those most likely to consume a large share of their increased income. Obviously, this would mean reducing the share of some low-consuming group—the rich, private businesses, state-owned enterprises (SOEs), or central or local governments.
Notice that all four paths either raise investment or reduce savings, thereby reducing the country’s excess of savings over investment. This is what is meant by a contraction in the current account surplus.
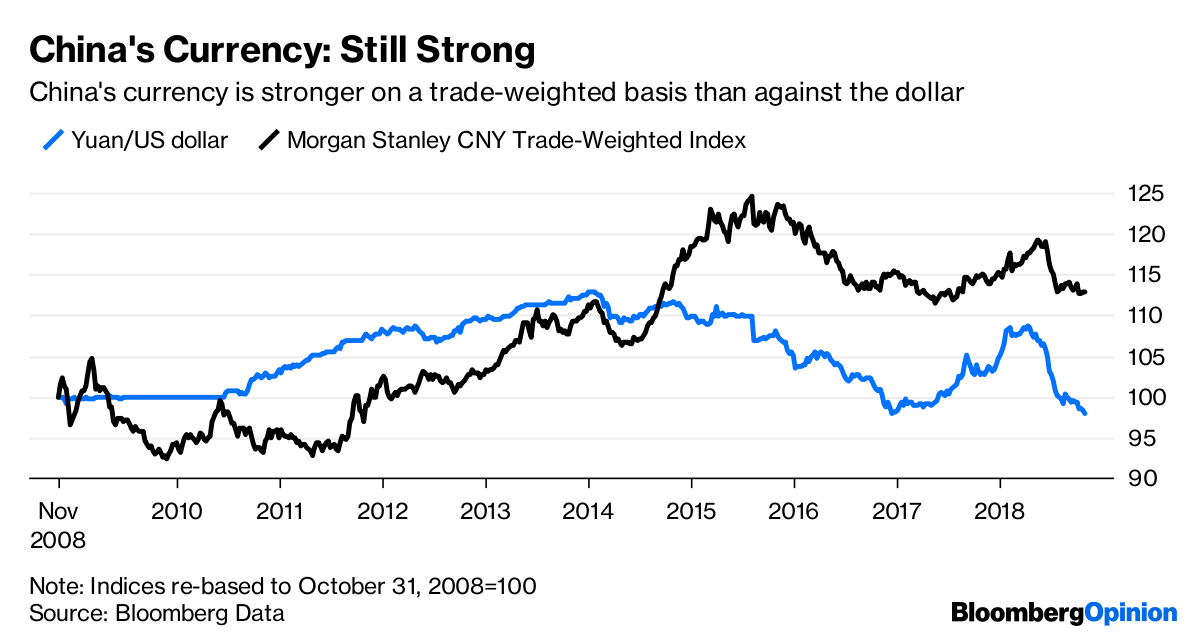
Left unsaid is the devaluation policy lever. John Authers recently pointed out that the Chinese yuan (CNY) is more closely tied to the USD, and it has become less competitive on a trade-weighted basis compared to other currencies. One of the policy levers that Beijing can employ is competitive devaluation, which has the potential to spark a global currency war, capital flight, and a disorderly unwind of China’s debt bubble.
Global contagion risk
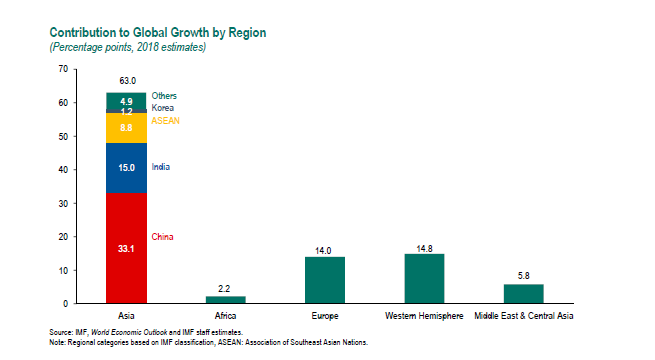
How does China’s policy dilemma affect the rest of the world? Here are the stakes. According to the IMF, Chinese growth comprises about one-third of global GDP growth.
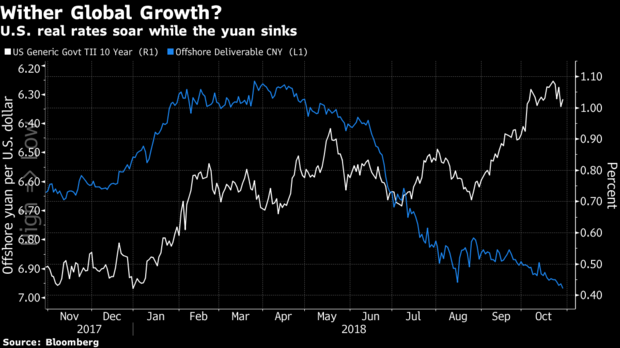
Its currency is weakening even as US real rates are rising. Something has to give.
What to watch
The risks to China and the possible spillover risks to the global economy appear to be formidable. While I don’t know whether Beijing can successfully navigate through these stormy seas, I can offer some real-time indicators that investors can watch in order to monitor the evolution of risk levels.
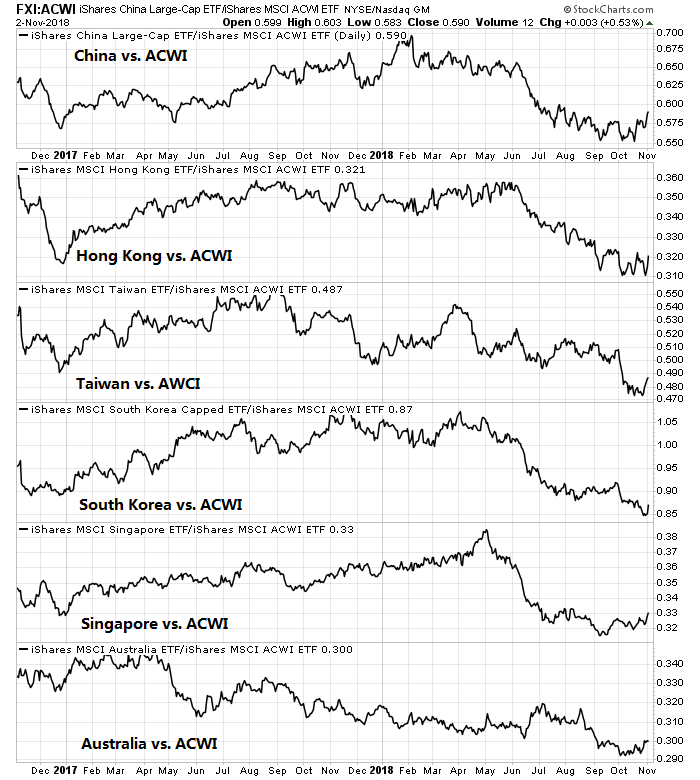
First is the behavior of the stock markets of China’s major Asian trading partners. Since almost all global markets are in retreat, monitoring absolute prices may not be an effective technique for spotting trouble. Instead, I would advocate watching the relative performance of the regional markets against the MSCI All-Country World Index (ACWI). The chart below shows the returns of US-listed country fund ETFs against ACWI. All returns are in USD, therefore currency effects are already reflected in the charts. While the performance of Chinese stocks have begun to stabilize against ACWI, the same could not be said of Taiwan and South Korea, which are disturbing developments. This is something to keep an eye on over the coming weeks leading up to the meeting between Trump and Xi at the G20 meeting.
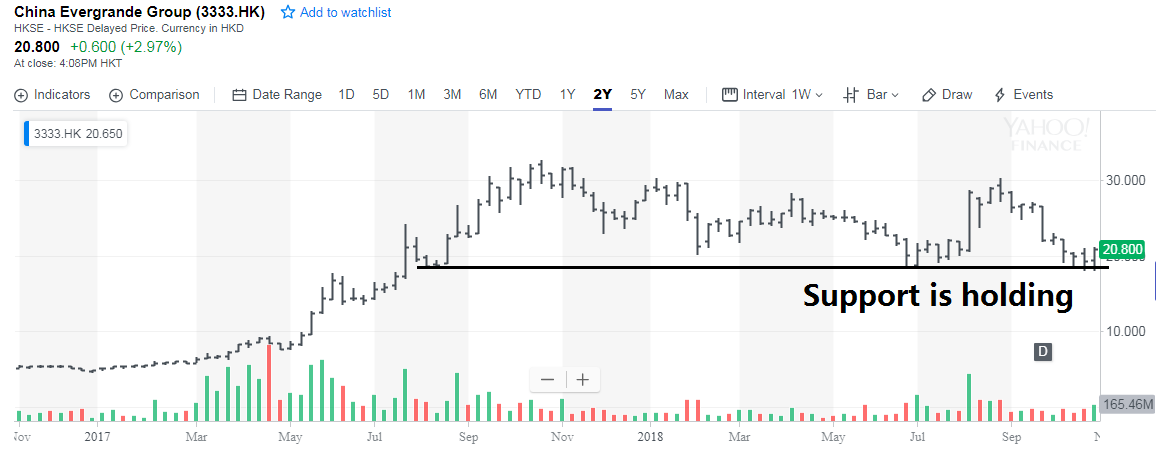
I have also suggested in the past to monitor the share prices of key Chinese property developers such as China Evergrande (3333.HK). So far, Evergrande has not breached its key support level.
However, the apparent strength may be artificial as the Chinese authorities recently took steps to stabilize the stock market:
After a faster-than-usual revision to existing law, companies can now repurchase shares with approval from at least two-thirds of the board if deemed necessary to protect shareholders’ interests, or to fund convertible bond exchanges, the National People’s Congress said last Friday.
Firms were previously only allowed to buy back shares for more limited purposes, and had to get shareholder approval.
China will encourage buybacks by listed companies, its securities regulator said yesterday. The new law allows companies to react much faster during market corrections, China Galaxy Securities wrote in a report on Monday, adding that long processing times made it less common for firms to conduct buybacks compared with those overseas.
Should the shares of Evergrande and other developers crater through key technical levels, I would regard such a development as the breach of the last redoubt of Beijing’s market support policies. It would be a signal that the dam has broken, and events are spiraling out of control.
The week ahead
Looking to the week ahead, the market will be focused on the midterm elections on Tuesday. While the expectation is for the Democrats to control the House, and the Republicans to control the Senate, anything is possible. One outlier forecast from Rachel Bitecofer of the Wason Center for Public Policy is predicting a Democrat pickup of 47 House seats, which would mean a Blue Wave that puts the Democrats’ control of the Senate within reach. On the other hand, Dilbert creator Scott Adams, who correctly called the Trump win, believes that the Republicans could see a surprise victory by keeping control of both the Senate and House.
In addition, the FOMC meeting on November 7-8 could be a source of volatility. It is difficult to believe that the Fed would stray from its steady course to raise rates in light of last week’s solid October Jobs Report. The Fed will also have the JOLTS report as a source of guidance.
From a technical perspective, the primary trend for stock prices is now down. I had highlighted the marginal monthly MACD sell signal on the Wilshire 5000 in my last post (see Tricks or treats for equities). As MACD is a momentum indicator, advancing the calendar by even an incomplete month starkly shows the effects of momentum deceleration. The MACD histogram reading is far more visibly negative, and it would take a powerful rally in the month of November to negate the October sell signal.
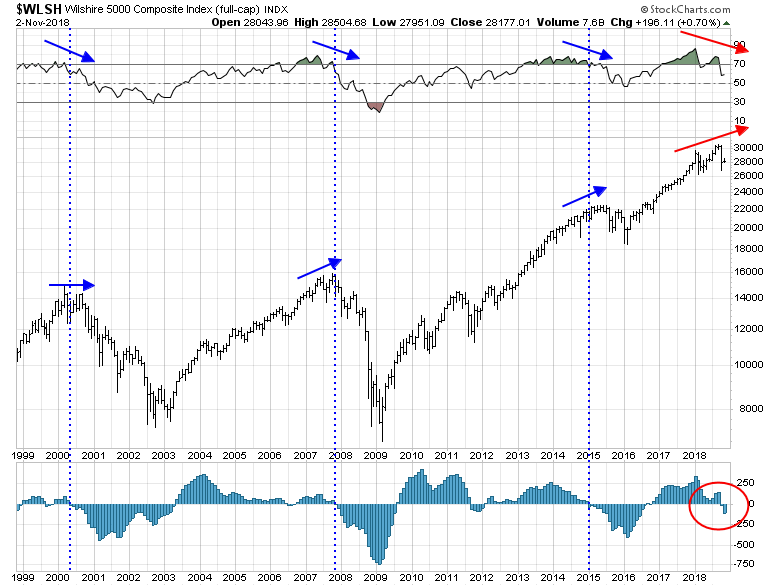
Urban Carmel also observed that, as of October 31, the SPX had fallen below its 10 month moving average, which triggers Meb Faber’s signal to de-risk and sell equities. Here is what happened next.
Using data from the last 38 years, there is an even chance that SPX reverses direction and moves higher from here over the months ahead. But the October low – or very close to it – appears likely to be retested in November…
Watch out for the short term – is this: the recent low at 2603 on October 29 is likely to get retested.
In our SPX charts above, note the green highlights in 1985 and 1986. These are the only two dates [out of 21 instances] when the “sell month’s” low was not revisited within 1%. In 1985, the next month’s low was 1% higher and in 1986 it was 1.4% higher. In 91% of these 21 instances, the next month either closed lower or the intra-month low was within 1% of the “sell month’s.” Ignoring contrary evidence (described most recently here), that implies a very high likelihood of SPX trading back down to at least 2640 in the weeks ahead (1.4% above 2603), perhaps even lower. That is 2.7% below today’s close.
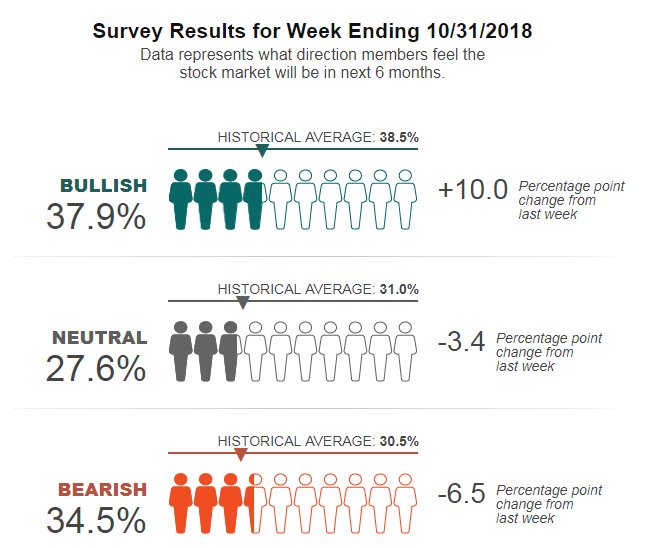
Subscribers received an email alert indicating that my trading account was shorting the market Friday morning. The AAII sentiment survey, which was published on Wednesday, saw a surge in bullish sentiment, which is too far, too fast.
Tactically, the index should decline to fill the gap at 2685-2705. If it were to fall further and test the previous lows, as per Urban Carmel’s analysis, then I would watch for an upside penetrate of the upper Bollinger Band by the VIX Index. As well, monitor the level of new 52-week lows (bottom panel) as a sign of breadth confirmation or divergence on a test of the October lows.
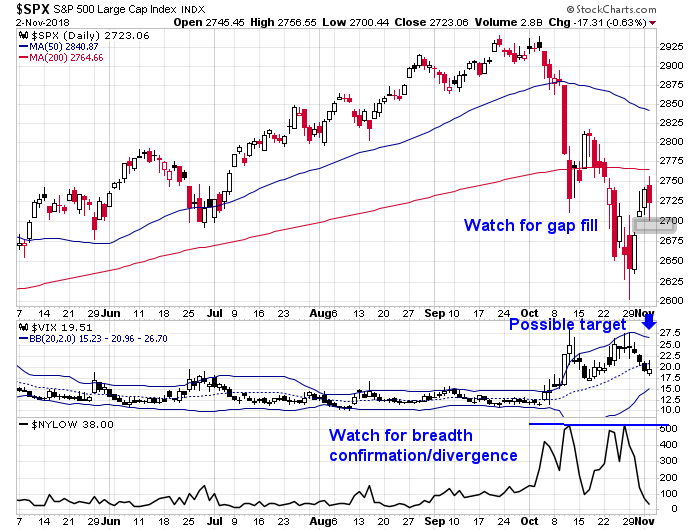
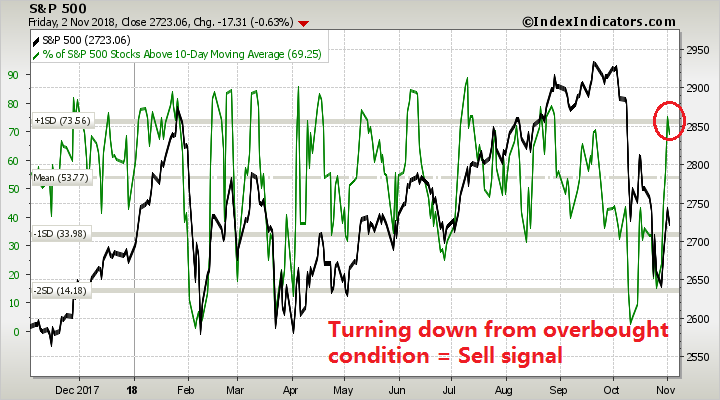
In the short run, breadth indicators are turning down from an overbought condition, which is a sell signal.
My inner investor has already de-risked his portfolio. My inner trader went short the market near the open on Friday, and he is anticipating further downside ahead.
Disclosure: Long SPXU
Just want to congratulate Cam on his world class intermediate sell in September. I remember also when he went full on intermediate bullish in early 2016 at the birth of this giant leg up in markets we’ve enjoyed and profited from. Hats off folks! It doesn’t get any better than that.
Yes, nice work Cam.
And Cam’s sell signal on Friday was also spot on. Congratulations.
Here is a Bloomberg article about Chinese property developers that collaborates with the points made by Cam.
https://www.bloomberg.com/news/articles/2018-11-04/default-risks-rise-in-355-billion-china-property-bond-market