Mid-week market update: Will investors get tricks or treats this Halloween?

Here is the good news. The sentiment backdrop was sufficiently washed-out for a reflex rally to occur. For some perspective, I refer readers to Helene Meisler’s recent Real Money article:
Long time readers know I am not known for my sunny disposition when it comes to markets. I am a contrarian; when we’re going up, I look for what can take us down and when we’re going down I look for what can reverse us back up.
But it struck me when I took the mute off the television on Monday how really bearish everyone was. All of a sudden no one is interested in buying the dip. No one is even interesting in “picking.” All of a sudden everyone is talking about at least a revisit of the February lows or more.
Remember when there were targets on the upside of 3,000 or 3,200? Now I see 2,300 or 2,200 coming out. We might get there but I find it fascinating that many of the new found bears all of a sudden want to buy the market lower.
SentimenTrader also observed that flows into inverse Rydex mutual funds have gone off the charts, and such readings have tilted heavily bullish historically.

Here is the bad news. Despite the two-day snapback rally, my models have flashed two long-term sell signals.
MACD sell signal
I warned about a negative monthly RSI divergence in August (see Market top ahead? My inner investor gets cautious). At the time, I did not notice that past negative divergences were accompanied by MACD sell signals. As we close the book on the month of October, the MACD sell signal has arrived.
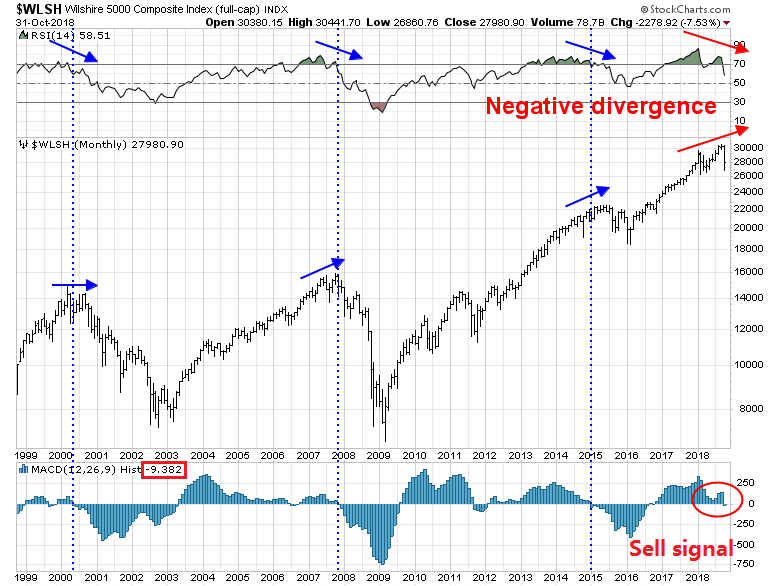
I prefer to use the Wilshire 5000 as it represents a broad index of the US equity market, but the monthly SPX also flashed a MACD sell signal.

Don’t forget that we already saw a MACD sell signal for global stocks in July.

This is the first indication that the cyclical top is in for this equity bull. If history is any guide, the market is unlikely to rally back to a new high after the combination of a negative monthly RSI divergence and a MACD sell signal.
Bank Index sell signal
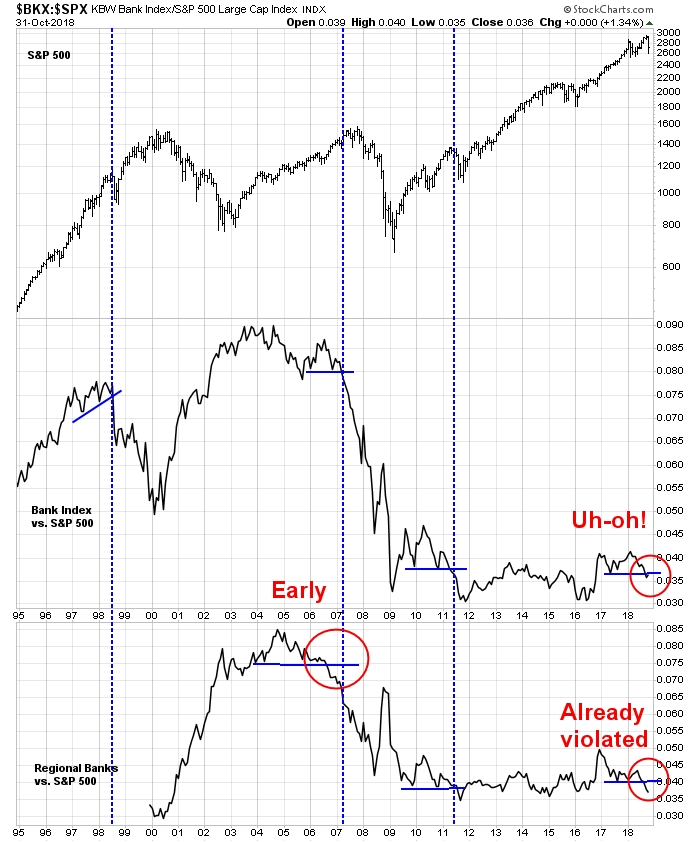
As well, I identified another bearish tripwire in the form of the relative performance of bank stocks (see A correction, or the start of a bear market?). The KBW Bank Index (BKX) broke a key relative support level at the end of September, but recently rallied back to test the breakdown level. The relative performance of the regional banks (KRX) has fared far worse.
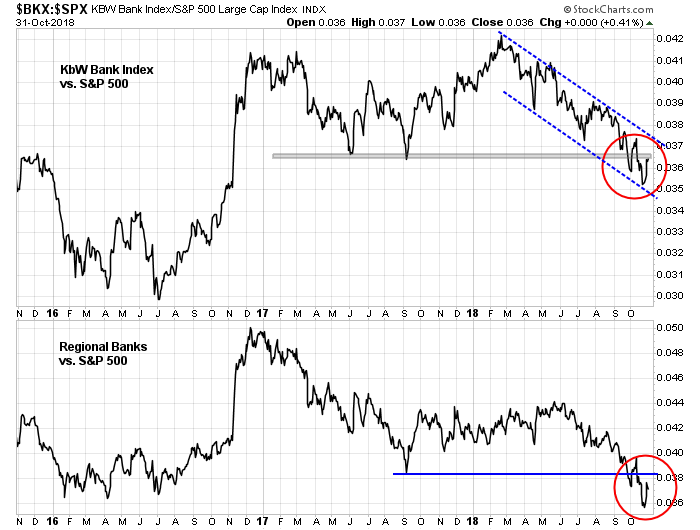
This chart shows the longer term historical context of this technical breakdown. In the past, KRX relative returns have either been coincident or led BKX returns, and such episodes have been ominous signals for stock prices in the past.
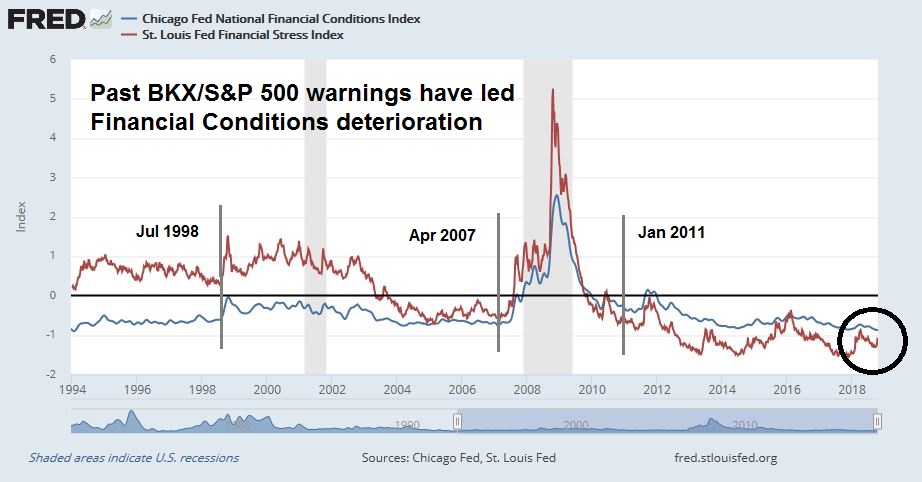
I initially viewed this signal with some skepticism. The poor performance of bank stocks is not showing up in measures of financial stress. Neither the Chicago Fed National Financial Conditions Index nor the St. Louis fed Financial Stress Index are very elevated and readings remain relatively benign. However, the analysis of past technical breaches of the BKX/SPX ratio shows that bank stock relative performance has led deterioration in the regional Fed’s financial condition indices.
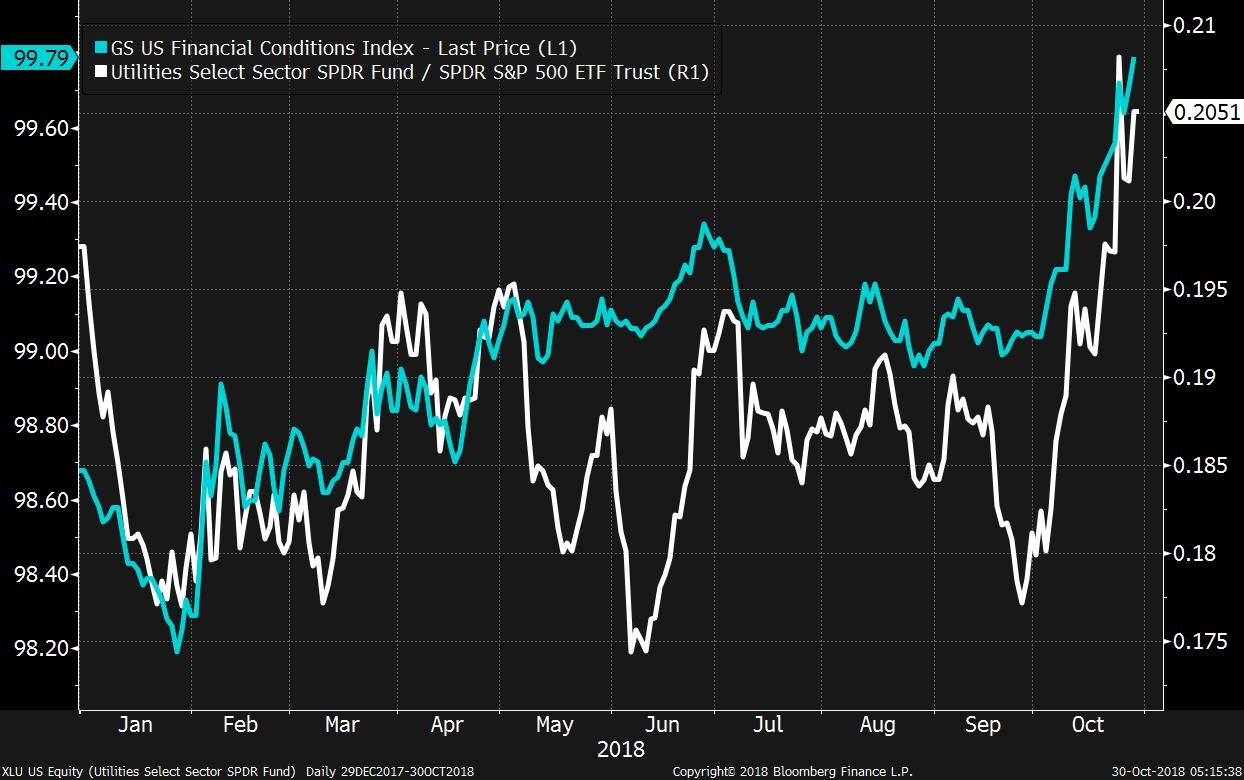
Joe Wiesenthal at Bloomberg also recently highlighted the high degree of correlation of the relative performance of Utilities compared to the Goldman Sachs Financial Conditions Index, whose stress levels are rising.
The combination of these signals indicate that we have likely seen the stock market top for this bull cycle, and a bear market is about to begin.
What’s next?
How individuals react to such a signal depends on their time horizon. Bear markets are volatile, and stock prices don’t go down in a straight line. The market remains oversold and it appears to be undergoing a relief rally.
Investors with long horizons should be lightening up their equity positions on rallies, and target a minimum equity weight in their portfolios. Traders, on the other hand, should be positioning themselves for the inevitable bounce.
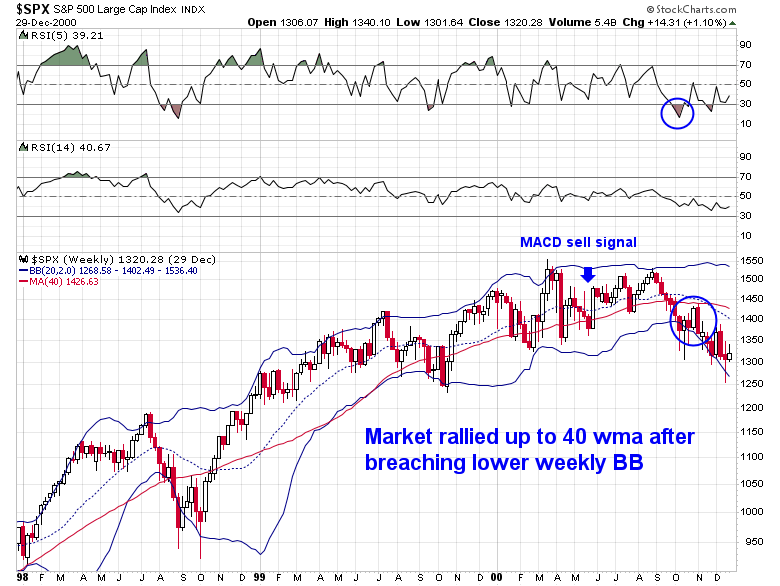
It may be instructive to see how the market behaved when stock prices began to roll over during the last two market tops. Consider the 2000 market top. The market rallied about 7% after flashing the MACD sell signal. It continued to rise in a choppy fashion and tested the old high before falling back to exhibit an oversold condition. The subsequent rally took the index back up to the 40 week moving average (wma), which is roughly equivalent to the 200 dma.
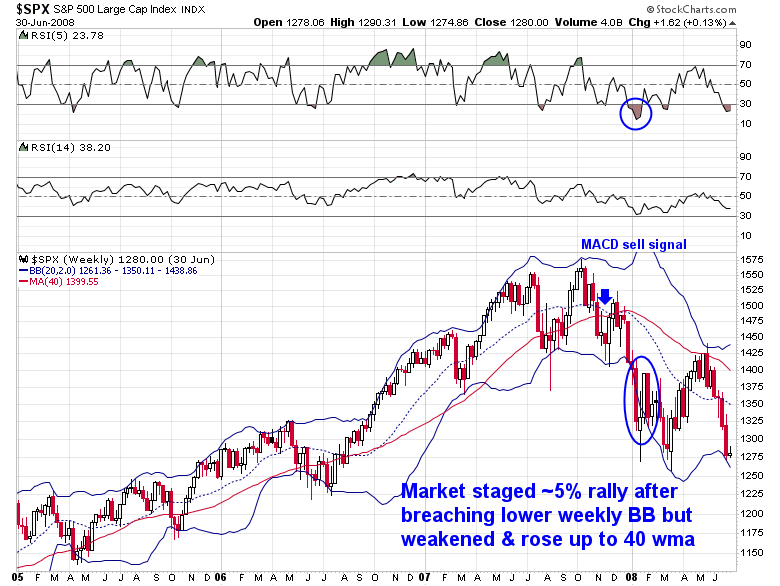
The 2007 top was slightly different. The market made a 5% rally after the monthly MACD sell signal. Unlike the 2000 experience, it did not rally up to test the old high, but cratered to flash an oversold signal, made a feeble rally, fell further, but eventually rose up to the 40 wma.
As they say, history doesn’t repeat itself, but rhymes. Current market conditions are somewhat unusual inasmuch as stock prices fell rapidly and in a short time after the market made an all-time high. The SPX is now exhibiting an extreme oversold condition, as defined by its 5-week RSI, and a breach of its weekly Bollinger Band. In the past, such oversold conditions did not coincide with MACD sell signals, but generally occurred afterwards.
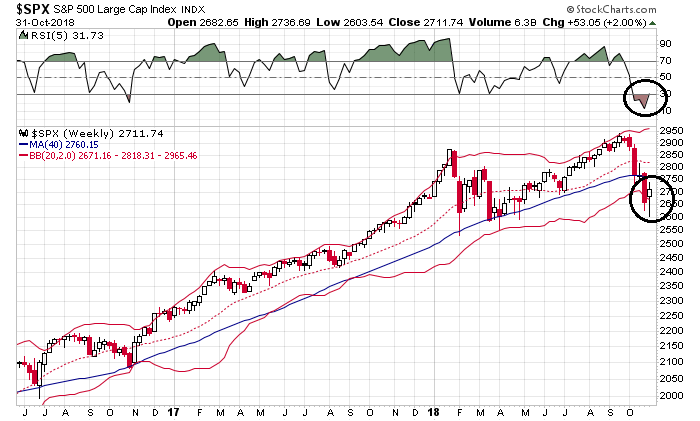
Assuming that a bear market has begun, a reasonable initial upside target for an oversold rally is the 200 dma, which stands at about 2765. If the index were to reach that level, I would then re-evaluate market conditions before taking further action.
Reflex rally = Bull trap?
There are a number of other warning signs that the reflex rally is unsustainable. Marketwatch reported that technical analyst Jeff deGraaf is unimpressed with the current rally:
Technical analyst Jeff deGraaf is unimpressed with the current attempt by stocks to punch higher after a sharp rally on Tuesday an apparent follow through in early Wednesday action.
The chairman of research firm Renaissance Macro Research suggests that a lack of real volume and breadth, or more sectors getting involved in the recent turn higher, has left him wanting more after a withering October…
“A sigh of relief fell over the street as the losing streak for equities abated near support at 2600 on the SPX. We’d classify the rebound as ‘uninspiring’ where TRIN was a useless .61 and breadth a mediocre 2.2:1,” he wrote in a Wednesday research note. TRIN refers to a short-term technical trading indicator, developed by the late Richard Arms in the 1970s, that tracks volume in advancing and declining stocks.
In other words, where`s the breadth thrust?
As well, OddStats ran historical analysis showing what happened when a negative month but the last two days are up least 1%.

Finally, Knowledge Leaders Capital suggested that the market may be insufficiently washed out for a durable bottom. Even if this is a minor pullback and not a major bear market like 2011 or 2015, breadth indicators need to become more oversold indicating liquidation before the market can mount a sustainable rally to new highs.

My inner investor has already de-risked his portfolio to his minimum equity portfolio weight. My inner trader took profits on his long positions and went to cash today. He expects to re-enter his long position after a pullback later this week.
Question – without an inverted yield curve or rising unemployment rate at this time ( both 2000 and 2007 had these) – would this be a smaller over all correction as in 2015-2016 rather then a major bear market? As you feel the top is in at this point?
To add – could this be more like 1998 correction? had both the macd and rsi signals but market kept going up?
thanks!
Anything is possible, but with the recession model lights flickering (but not giving a definitive recession signal), my best guess is this is the start of a major bear market. The recession model uses conventional macro inputs, and the trade war could pull the timing of a recession forward as we haven’t have a major global trade war in anyone’s living memory.
That said, it’s hard to know the downside risk without knowing the economic trigger. It could be a relatively benign slowdown, e.g. 1990, or it could be something more serious (2008). At this point I have no idea.
Ralph Acampora is all over the news, saying its a bear. Just an example:
https://www.marketwatch.com/story/godfather-of-chart-analysis-says-damage-done-to-the-stock-market-is-much-much-worse-than-anyone-is-talking-about-2018-10-30
Wondering if a correction like 2015 might also be a possibility. $SPX dropped about 16% from peak to trough. It had negative RSI divergence and MACD sell signal. Some say the relative health of the credit markets suggest we have a few more years before things could get ugly.
This post by Urban Carmel is a good summary of what might happen next, as the SPX violated its 10 month moving average:
https://fat-pitch.blogspot.com/2018/10/what-todays-trend-following-sell-signal.html
“Using data from the last 38 years, there is an even chance that SPX reverses direction and moves higher from here over the months ahead. But the October low – or very close to it – appears likely to be retested in November.”
Given the risks posed by 1) The Fed 2) the trade war, I would raise the odds of a bearish resolution to more than 50% (though don’t ask me how much as I don’t know).
I dunno what shenanigans might go on between now and the 6th. Will Trump innocently soften on China and manipulate the market? Are they thinking the Dems will get seats and block Trump? What if they are wrong? So there are several potential surprises in the next week. Personally I think we are in a correction but late in the cycle.1998, 2006, but the market could work it’s way up in a choppy manner like an ending diagonal or H&S.
A lot of noise
Monday, October 29 may have been the intermediate low for the next leg of the market cycle. Whenever markets make a sentiment/intermediate low, I make up charts that are rebased to start at that low. That way I can monitor new momentum leaders or laggards. Here are the charts. Copy them and email them to yourself to keep them. They update daily. Good luck. We are in this together.
U.S. Major Sub-Groups Post October 29
https://tmsnrt.rs/2RrukTh
Interesting U.S. Sub-Groups Post October 29
https://tmsnrt.rs/2RruJoL
Global Markets Post October 29
https://tmsnrt.rs/2RvhIL5
Style ETFs Post October 29
https://tmsnrt.rs/2RnGmNs
Canadian Sub-Groups post October 29
https://tmsnrt.rs/2yLEfMw
Hi Cam, what are your thoughts on Elliot wave, way too many interpretations for me but the basic jest is down to 2600 then meander back to the 2800 ish realm then down to 2200, I personally feel like just taking the remaining 50 % of my money and going to cash to 2200 but I have been an emotional bonehead far too many times …any thoughts and thank you !
There are some people who are good practitioners of EW, I am not one of them.
I find that EW to be overly interpretative and initial condition dependent. Much depends on where you begin your wave count, and I could never get the hang of it.
Cam, for trading purposes, you always seem to use SPXU or SPXL, and occasionally the QQQ versions of them. You never use the sector- or style-specific ETFs. Is that because of liquidity?