Preface: Explaining our market timing models
We maintain several market timing models, each with differing time horizons. The “Ultimate Market Timing Model” is a long-term market timing model based on the research outlined in our post, Building the ultimate market timing model. This model tends to generate only a handful of signals each decade.
The Trend Model is an asset allocation model which applies trend following principles based on the inputs of global stock and commodity price. This model has a shorter time horizon and tends to turn over about 4-6 times a year. In essence, it seeks to answer the question, “Is the trend in the global economy expansion (bullish) or contraction (bearish)?”
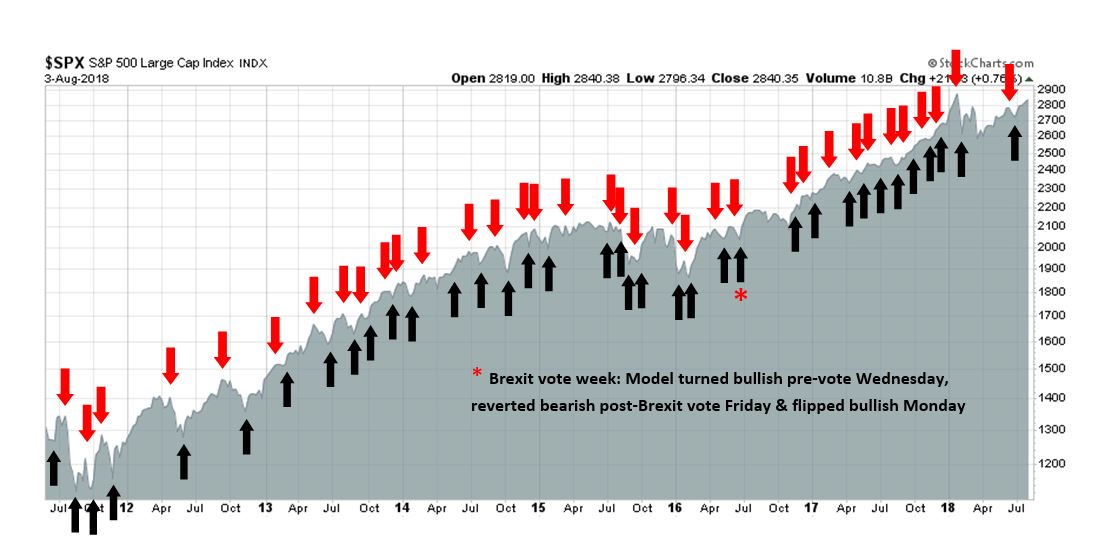
My inner trader uses the trading component of the Trend Model to look for changes in the direction of the main Trend Model signal. A bullish Trend Model signal that gets less bullish is a trading “sell” signal. Conversely, a bearish Trend Model signal that gets less bearish is a trading “buy” signal. The history of actual out-of-sample (not backtested) signals of the trading model are shown by the arrows in the chart below. The turnover rate of the trading model is high, and it has varied between 150% to 200% per month.
Subscribers receive real-time alerts of model changes, and a hypothetical trading record of the those email alerts are updated weekly here.
The latest signals of each model are as follows:
- Ultimate market timing model: Buy equities
- Trend Model signal: Neutral
- Trading model: Bullish
Update schedule: I generally update model readings on my site on weekends and tweet mid-week observations at @humblestudent. Subscribers receive real-time alerts of trading model changes, and a hypothetical trading record of the those email alerts is shown here.
Cautionary signs ahead
My formerly bullish inner investor is turning cautious. This major change of opinion is not without precedence. The chart below is a record of my investment calls, and it shows that I have been neither a permabull or permabear. I was correctly bullish when the stock market dipped in 2015, and I turned cautious in the first half of 2015, and in early 2018.

I am now seeing the early technical signs of a developing cyclical top for the bull market that began in 2009. While this is not a call to sell everything as a bear market can take some time to develop, my inner investor is taking steps to rein in his risk exposure in preparation for a market top in the next few months.
A developing long-term top
I came to this conclusion through the prisms of technical analysis and top-down macro-economic analysis. The most convincing technical sign of a developing stock market top is the negative divergence RSI exhibited by the monthly chart of the broad-based Wilshire 5000 (WLSH). WLSH made a marginal all-time high in July compared to January on a closing basis, but showed a negative RSI divergence. Past similar conditions have signaled either major market tops or, at a minimum, a corrective pullback.

Equally disturbing is the sector leadership picture from RRG charts. As an explanation, RRG charts are a way of depicting the changes in leadership in different groups, such as sectors, countries or regions, or market factors. The charts are organized into four quadrants. The typical group rotation pattern occurs in a clockwise fashion. Leading groups (top right) deteriorate to weakening groups (bottom right), which then rotates to lagging groups (bottom left), which changes to improving groups (top left), and finally completes the cycle by improving to leading groups (top right) again.
The latest update of sector leadership shows that defensive sectors are either the emerging or actual market leaders, indicating developing market weakness. Defensive sectors such as Consumer Staples, REITs, Utilities, and Healthcare are all either in the improving or leading quadrants, while high beta and cyclical sectors such as Technology and Industrial stocks are either in the weakening or lagging quadrants.

The RRG analysis for equal-weighted sectors, which minimizes the effects of megacap heavyweights in each of the sectors, is also supportive of the thesis of emerging defensive sector leadership.

As well, the failure of the price momentum factor has been a drag on risk appetite and raises another cautionary flag for the bull case. At the same time, the relative performance of high beta to low volatility stocks is testing the bottom of its recent trading range. A violation of relative support would be a signal that the bears are taking control of the tape.

In short, a series of long-term technical signals are leading to a cautious outlook for US equities.
Macro dark clouds on the horizon
At the same time, dark macro-economic clouds are gathering on the horizon. I agree with the analysis of New Deal democrat, who has done an excellent job of categorizing high frequency economic statistics into coincident, short leading, and long leading indicators. NDD’s latest weekly update of US economic conditions shows that long leading indicators, designed to forecast economic conditions a year in advance, have deteriorated from positive to neutral, and they are on the verge of turning negative, which is a recession warning. However, coincident and short leading indicators are all pointing upwards.
As has been the case for many months, both the nowcast and the short-term forecast remain positive, led by manufacturing, the stock market, and jobless claims.
The longer-term forecast recently turned from positive to neutral. This week the readings were stable, but real M1, the yield curve, and purchase mortgage applications are all close to tipping this negative.
While I am not in the habit of anticipating model readings before they occur, the current trajectory of long leading indicators suggest that the American economy is likely to enter recession in H2 2019. As stock prices tend to look ahead by about a year, that suggests that a cyclical market top may be developing about now.
Although standard economic analysis is pointing to a possible economic slowdown in late 2019, there are two factors that may act to further spook the markets. The first is a possible trade war that could crater global trade. How trade tensions develop is an unknown, but the markets seem to be mostly shrugging off the worst-case scenario of a full-blown trade war for now.
One risk that market analysts have largely ignored is the repercussions from the November mid-term elections. In all likelihood, the Democrats are likely to retake control of the House, though they face an uphill battle in the Senate. Should such a scenario unfold, there two negative market developments that I have seen few analysts discuss.
The first is the fiscal policy effect of the Democrat’s takeover of the House, and possibly the Senate. Expect a tighter fiscal policy in 2019. There will be no further tax cuts, and a possible partial rollback of the tax cuts passed in 2017. The combination of tight fiscal and monetary policy will act to slow economic growth further, which is a development that the market has largely ignored.
In addition, a Democrat controlled House will see more political fireworks between the White House and Congress. Committee chairs will be controlled by Democrats, and expect committees to come into greater conflict with the Trump administration. Congressional committees will have the power to subpoena anything and everything, such as Trump’s tax returns. Cabinet secretaries can be called to testify before committees on all sorts of issues that have been ignored by the Republican controlled committees.
Expect the Mueller probe, if it continues into 2019, will take on a greater prominence. A worst-case analysis of the Mueller inquiry could morph into a Watergate-like drama. Recall that the market reacted badly to the Watergate hearings, but they occurred against a backdrop of recessionary conditions in the wake of the Arab Oil Embargo. A similar scenario of the combination of tight fiscal and monetary policy cools the economy into a slowdown, and Watergate style hearings that paralyzes Washington in 2019 is well within the realm of possibility.
In short, 2019 will be legislative hell for the Trump administration. The markets may not like this development.
Don’t panic
Despite these cautionary signs, this is not an investment call to sell everything, but a warning of a possible market top. Topping processes can take some time to fully develop.
Firstly, please be reminded that the Wilshire 5000 chart is based on monthly prices, and negative RSI divergences can continue for several months before playing out. In addition, the relative performance of defensive sectors shows that they are bottoming against the market. With the exception of healthcare stocks, the other sectors are not in clear relative uptrends, indicating that the bears do not have the upper hand just yet.

My last hurrah scenario of a rally to new all-time highs remain in play for the next few weeks. The SPX has successfully tested the breakout turned support level of 2800 and the cup and handle breakout structure remains valid. :Last Thursday’s market reaction to the Trump administration’s announcement that it was considering additional tariffs on Chinese imports was a positive for the bulls. In addition, the NASDAQ 100 held support at the key 50 day moving average was also short-term positive for stock prices.

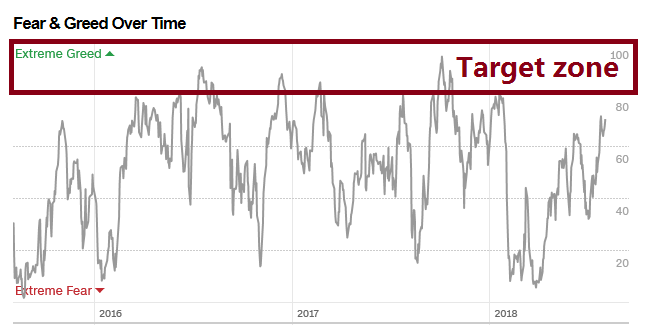
At a minimum, I would wait for signs of euphoria from sentiment indicators such as the Fear and Greed Index before calling a top.
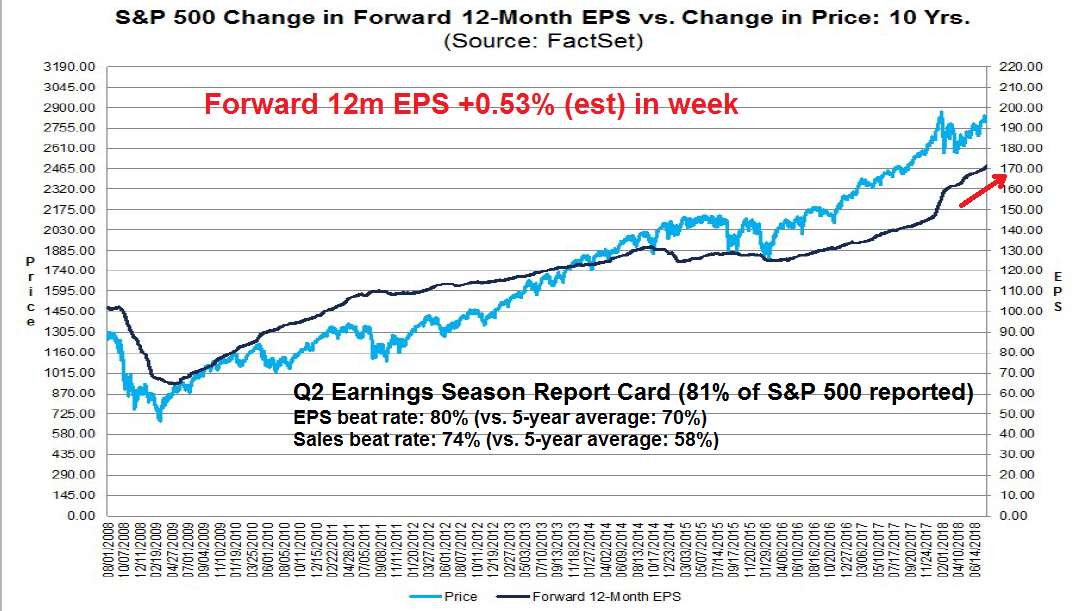
The latest update from FactSet shows that the results from Q2 earnings season has been outstanding, and forward 12-month EPS has been surging. As forward EPS is coincident with stock prices, it is difficult to see how a bear phase could start with such near-term strength in fundamental momentum.
Lastly, a turnaround in the relative performance of value/growth ratio would be an indication of a change in market direction. Despite the recent hiccup, the bulls still have control of the tape.

Differing time horizons
How investors and trader should react to my change of opinion depends on their investment objectives and time horizon.
My inner investor is not interested in day-to-day blips in stock prices, and current conditions suggest that the risk/reward ratio for equities is turning unfavorable. He is therefore inclined to start de-risking his portfolio, with the target equity weight specified in his Investment Policy Statement (IPS) as his ceiling. In addition, he is considering changing his equity exposure from long-only to buy-write positions as a way of cushioning his downside risk. Another way of engineering risk control might be to use either the 50 or 200 dma as partial or full stop losses as a way of letting winners run and limiting losses.

My inner trader, on the other hand, is more focused on the possible upside potential. He is staying in his long positions until either a break of 2800 support, or sentiment becomes euphoric, which is likely to occur when the index breaks up above 2900.
Disclosure: Long SPXL
excellent and timely commentary
Stay tuned. I’m out at a music festival right now but will post moving average charts of key indexes when I get home. As with all the charts I post they will be URL links that will update every day. So copy and paste the links and keep them handy forever.
By “Buy-Write” do you using options (sell covered call options or buy put options?)
Buy-write = Buy the stock or index and sell call options against the long position
ty
Here are the moving average charts of key ETFs. On each are two charts, with simple moving averages on the top one and weighted moving averages in the bottom one. Both have 50/100/200 day lines. The weighted gives more emphasis on the most recent data and hence is more sensitive. Use that one if you are hoping to trade sooner. If anyone wants another ETF, just post a request and I’ll post the chart link. Copy and paste these to monitor them whenever you want. They update daily. Amazing technology.
MAJOR INDEXES
S&P 500 (SPY) https://tmsnrt.rs/2KlO7V8
NADAQ 100 (QQQ) https://tmsnrt.rs/2tN5nHM
Russell 2000 (IWM) https://tmsnrt.rs/2lBwLoy
Emerging Mkts (EEM) https://tmsnrt.rs/2Muf0mB
11 GICS Basic Industry Groups
Healthcare (XLV) https://tmsnrt.rs/2yN2so5
Technology (XLK) https://tmsnrt.rs/2tHxJmz
Real Estate (IYR) https://tmsnrt.rs/2KsiUPr
Energy (XLE) https://tmsnrt.rs/2tHiquq
Consumer Discretionary (XLY) https://tmsnrt.rs/2KkKzSn
Consumer Staples (XLP) https://tmsnrt.rs/2K9J0ao
Materials (XLB) https://tmsnrt.rs/2tGrKOX
Financials (XLF) https://tmsnrt.rs/2yQTS7X
Industrials (XLI) https://tmsnrt.rs/2KaEsR3
Transportation (IYT) https://tmsnrt.rs/2z03oG7
Utilities (XLU) https://tmsnrt.rs/2tB5vdk
Interesting Sub-Groups
Internet (FDN) https://tmsnrt.rs/2tMLpwL
Biotech (IBB) https://tmsnrt.rs/2KfbC26
Momentum (MTUM) https://tmsnrt.rs/2yQfHEx
We are in this together!
Ken MacNeal
Cam,
What is the definition of “likely” as in “likely to enter recession in H2 2019”. Logically it would have to be at least 51%. That is an important call.
Greg
I hate to put a specific odds of a recession because I don’t have a quantitative model that calculates probability. However, if I had to guess, my guesstimate would be in the 60-80% range of a recession in late 2019.
Thank you Cam
Cam,
You are the first knowledgeable, important, and reliable investment blog of which I am aware to make that call. (I know there are a few prominent bears around like Rosenberg) Thank you for your courage and honesty!
Greg
Ditto! Thank you, Cam.