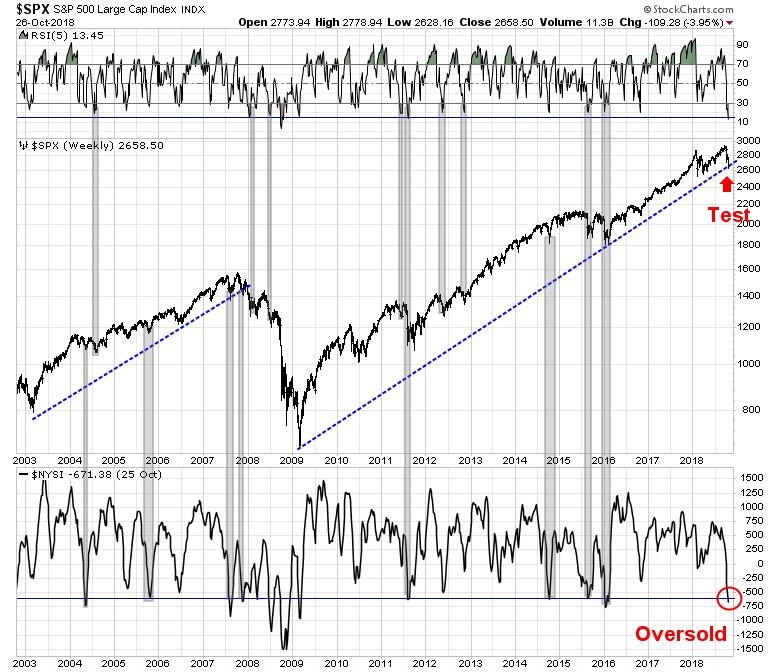
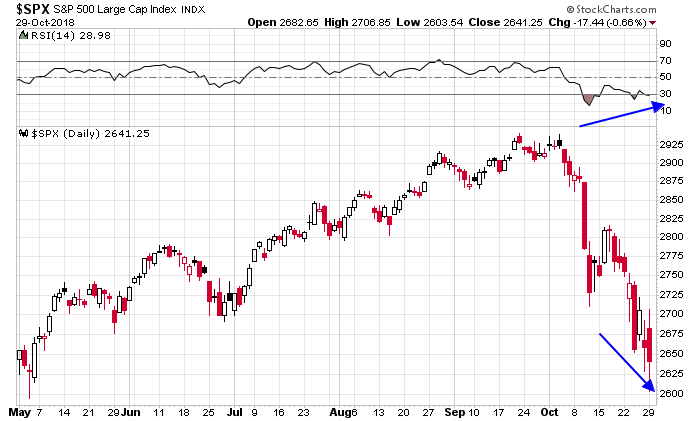
There are good reasons to believe the market is poised for an oversold rally. As I pointed out in my last post (see How this Bear could be wrong: Exploring the bull case), the SPX is testing a key uptrend line that began in the market bottom of 2009. Initial trend line tests rarely fail, which is supportive of the bounce scenario. In addition, the market is exhibiting oversold conditions on both the 5-week RSI (top panel), and the NYSE McClellan Summation Index (NYSI, bottom panel). Such conditions have resolved themselves with relief rallies, outside of major bear legs. Even the initial downlegs of the 2007-08 bear market saw oversold rallies after the market reached such oversold conditions.
Here are a few contrarian suggestions of beaten up investment themes for an oversold rally, should it occur on a sustainable basis.
The Trump trade
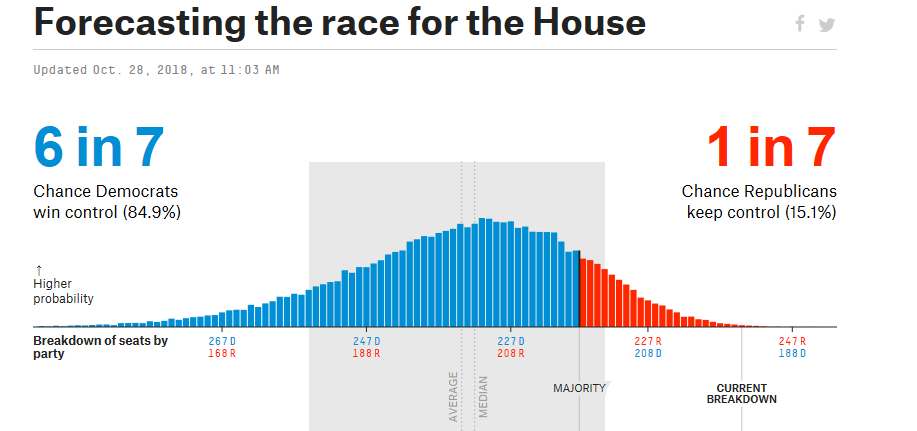
As the US approaches the midterm elections, the consensus is that the Democrats take control of the House while the Republicans retain control of the Senate. The latest FiveThirtyEight forecast shows that the Democrats have a 6 in 7 chance of controlling the House.
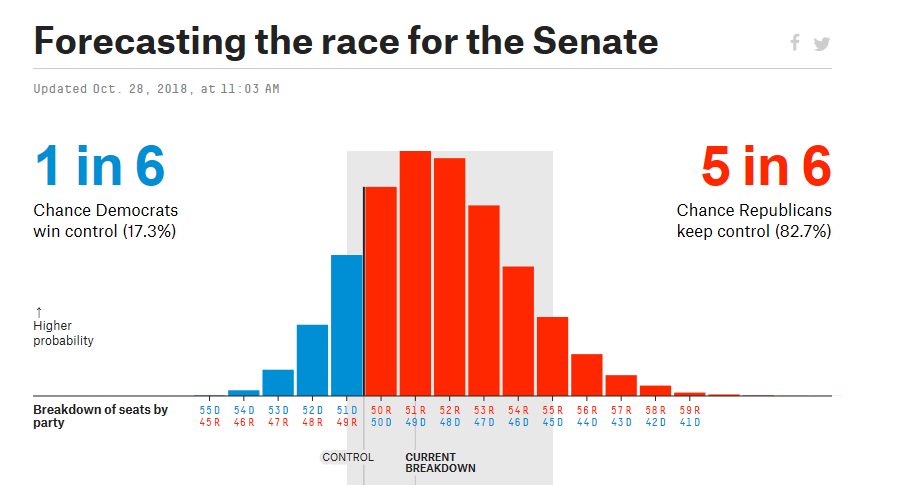
While the Senate forecast shows that the Republicans have a 5 in 6 chance of retaining control.
While a Democrat controlled House will make political life impossible for the Trump administration, as there will be endless hearings and subpoenas, starting with Trump’s tax returns, such political waves in Washington are unlikely to have significant market impact.
At the same time, as the Republicans’ political hopes of controlling Congress faded over time, the Trump trade has steadily underperformed the market, as measured by the MAGA ETF. While I am not a fan of highly specialized ETFs, the Point Bridge GOP Stock Tracker ETF (MAGA) serves to highlight some important points on the market views about political sentiment. The ETF holds equal-weighted positions in the top 150 stocks “within the S&P 500 that are highly supportive of Republican candidates for federal office including President, Vice President, Congress and other Republican Party-affiliated groups as determined by a rules-based methodology.”
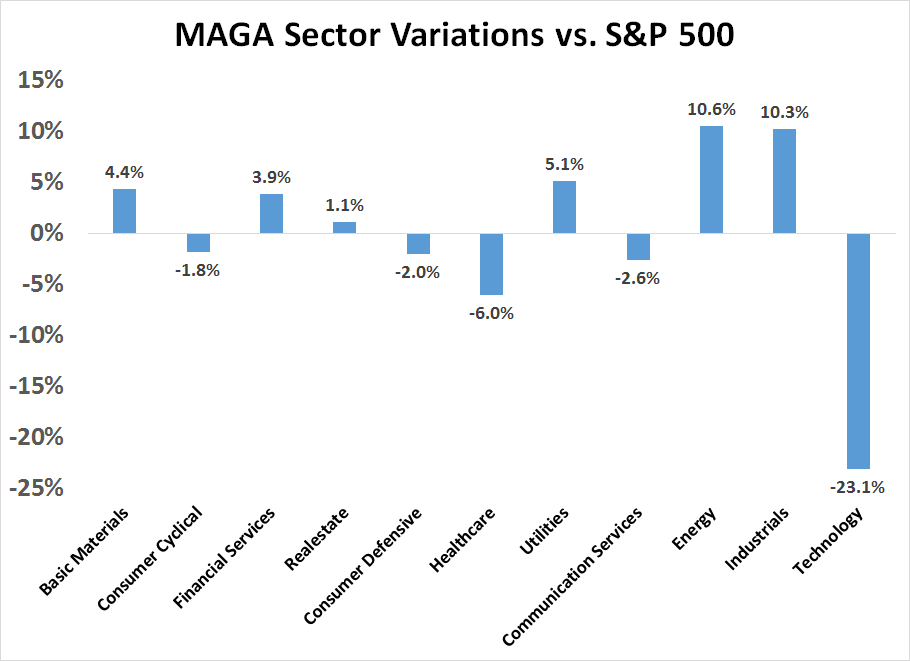
The chart shows the market relative performance of MAGA, which has been steadily underperforming since May. Further analysis of MAGA’s sector exposures reveal large overweight positions in industrial and energy stocks, and a severe underweight in technology.

The chart below shows the relative weight of the ETF by sector. Industrial and energy stocks are overweight by roughly 10%, while the ETF had a zero weight in technology, which led to an underweight position of slightly over 20%.
While this is highly speculative, could the MAGA trade see a relief rally after the midterm election? While I would not recommend buying the ETF because of its illiquid characteristics, as its market cap is only $40 million and it only trades about 2,000 shares a day, its overweight positions in industrial and energy stocks hold some promise.
The chart below depicts the market relative performance of US industrial and energy stocks (black lines), as well as the market relative performance of European industrial and energy stocks (green lines). Historically, US and European equity factor performance has been closely correlated, but divergences are appearing in both of these sectors. European industrial and energy stocks are performing much better against their market compared to the American counterparts.
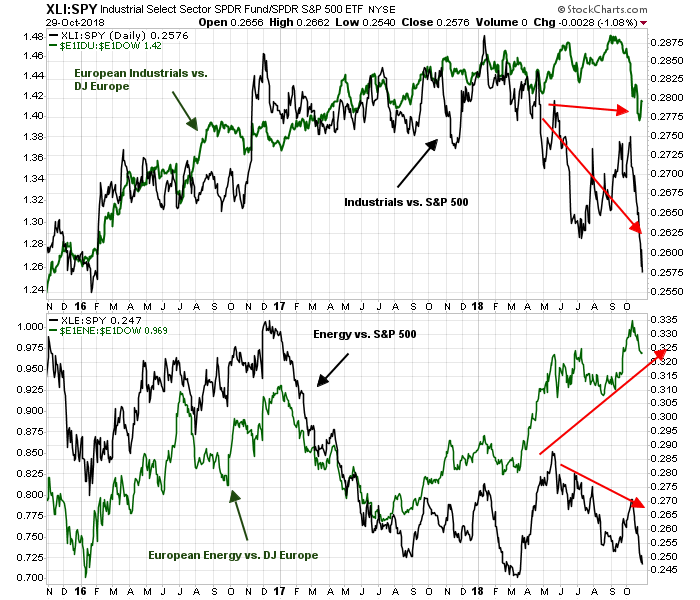
One explanation of the relative performance differential could be the Trump factor. In that case, could the midterm election be a trigger for a convergence?
A small cap revival?
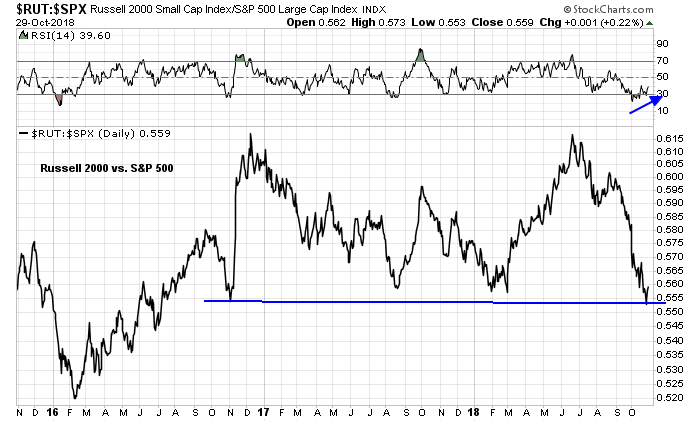
A less controversial idea is the revival of small cap stocks. The small cap Russell 2000 is testing a key relative support level, while exhibiting a positive RSI divergence. If the market were to rally, small cap stocks represent a high-beta group that has the potential to outperform.
In conclusion, the US equity market is poised for a rally. Should the strength be sustainable, industrial, energy, and small cap stocks may be sufficiently washed out to see above average rebounds.
The S&P 500 lost ground today but it continued to exhibit a positive RSI divergence. These conditions are constructive for a rebound and therefore these contrarian buy themes remain in play.
The setup is normally, overwhelmingly positive for a rally. Sentimentrader.com is citing historic similar situations that have 100% success in calling a rally. But they mentioned that there are multiple sell programs hitting the market during the day and at one point an amazing 40% of stocks traded on a down tick, simultaneously. I believe that is massive selling of ETFs that in turn puts selling pressure on stocks held within the ETFs.
This situation with ETFs is very new and could be a very negative and unpredictable factor. I’d strongly recommend standing back. It may be a tsunami, a bad storm or just a small shower. If it’s a tsunami, investors will caught up in something very bad. If it drops far further than expected, investors will want to have a rally to get out even. That traps them as markets continue for.
I smell something weird happening not an opportunity to profit.
Ken, what is causing massive selling of ETFs?
The selling does not seem uniform across the market or even sectors.
The general public has been using ETFs more and more as trading vehicles. They generally are trend followers and they have group-think, herding behavior.
If 40% of the entire stock market is hit on the bid side simultaneously, that is uniform. Also, remember a stock like Apple is in 200 indexes that are the basis for ETF construction. If we simply assume that a large amount of the 40% hit by simultaneous selling, were in ETFs, that makes sense. The other 60% of stocks were likely not in ETFs or were in very few.
My point is that this decline is something unique and possibly dangerous. I’d let this trading opportunity pass and wait for the next one. There is a new train coming after this one.
I use ETFs a lot. I was voted ‘ETF Champion of the Year’ in Canada for 2017 by Wealth Professional magazine.
An ETF of an industry, such as let’s say the internet ETF FDN is so easy to buy and sell on a whim. In previous times an investor might own five or ten individual stocks each with a narrative. Selling them was more difficult because an investor would have to part with a powerful story, the reason they had bought the stock. So they may delay selling or just sell a couple rather than them all.
An ETF, is so much more impersonal and objective. An investor looks at the trading pattern and thinks, “Looks like the internet stocks are falling.” and the ETF is sold in a heartbeat. If that is part of a behavioral herding, stampede, look out.
I agree. Thanks for your response.
Are we currently still short or long looking for a rally?
The trading account is long in anticipation of a rally. Incidentally, we now have a CNBC “Markets in Turmoil”, which is another contrarian bullish sign.
thanks, I’m not getting alerts for new posts. How do I configure the same?
Can you check your spam folder? Our records show that you were sent an email.
I’m getting emails now, thanks!
Are we still long after today’s rally?
Notices of changes in the trading account are emailed to subscribers as they occur. There are no changes since the last “buy” notice last week.
Cam, a technician recommended IBB (Bio-tech) for a counter-trend rally over the coming days and weeks. Do you have a view on this ETF? Thanks much!
IBB could be worthwhile as a bounce candidate, assuming that there is a bounce.
Thank you.