Preface: Explaining our market timing models
We maintain several market timing models, each with differing time horizons. The “Ultimate Market Timing Model” is a long-term market timing model based on the research outlined in our post, Building the ultimate market timing model. This model tends to generate only a handful of signals each decade.
The Trend Model is an asset allocation model which applies trend following principles based on the inputs of global stock and commodity price. This model has a shorter time horizon and tends to turn over about 4-6 times a year. In essence, it seeks to answer the question, “Is the trend in the global economy expansion (bullish) or contraction (bearish)?”
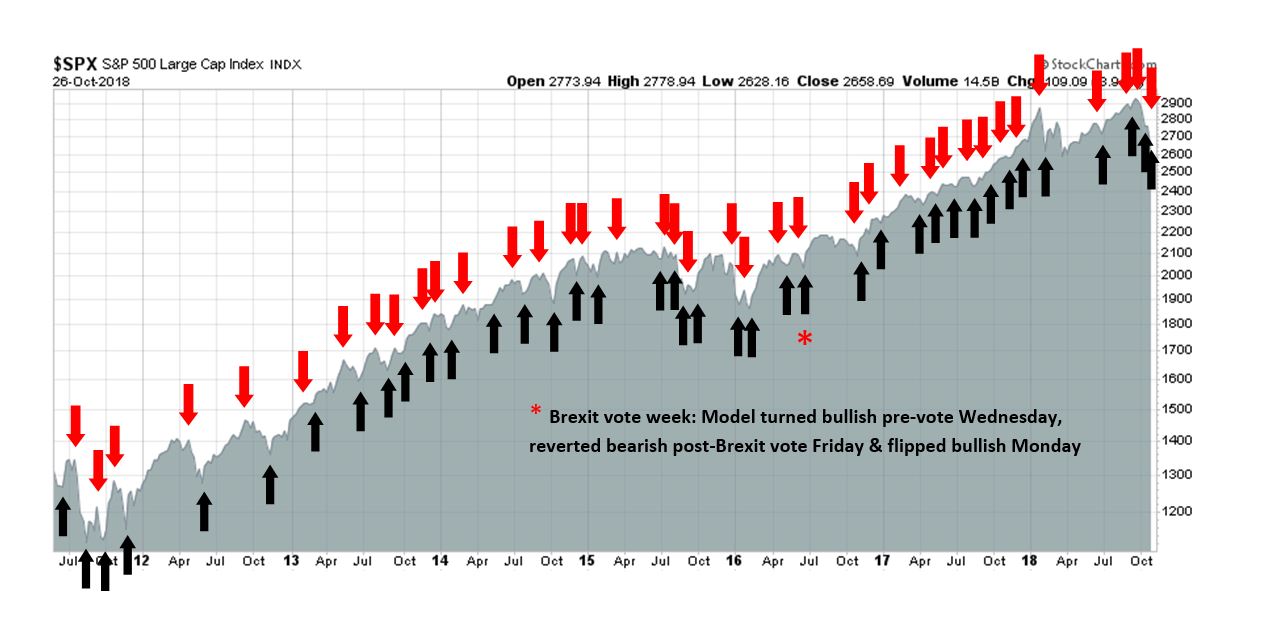
My inner trader uses the trading component of the Trend Model to look for changes in the direction of the main Trend Model signal. A bullish Trend Model signal that gets less bullish is a trading “sell” signal. Conversely, a bearish Trend Model signal that gets less bearish is a trading “buy” signal. The history of actual out-of-sample (not backtested) signals of the trading model are shown by the arrows in the chart below. The turnover rate of the trading model is high, and it has varied between 150% to 200% per month.
Subscribers receive real-time alerts of model changes, and a hypothetical trading record of the those email alerts are updated weekly here. The hypothetical trading record of the trading model of the real-time alerts that began in March 2016 is shown below.

The latest signals of each model are as follows:
- Ultimate market timing model: Buy equities
- Trend Model signal: Bearish
- Trading model: Bullish
Update schedule: I generally update model readings on my site on weekends and tweet mid-week observations at @humblestudent. Subscribers receive real-time alerts of trading model changes, and a hypothetical trading record of the those email alerts is shown here.
How I could become bullish
Three weeks ago, I explored the likelihood of a recession in 2020 and concluded that while my panel of recession indicators were not bright red, they were flickering (see A recession in 2020?).
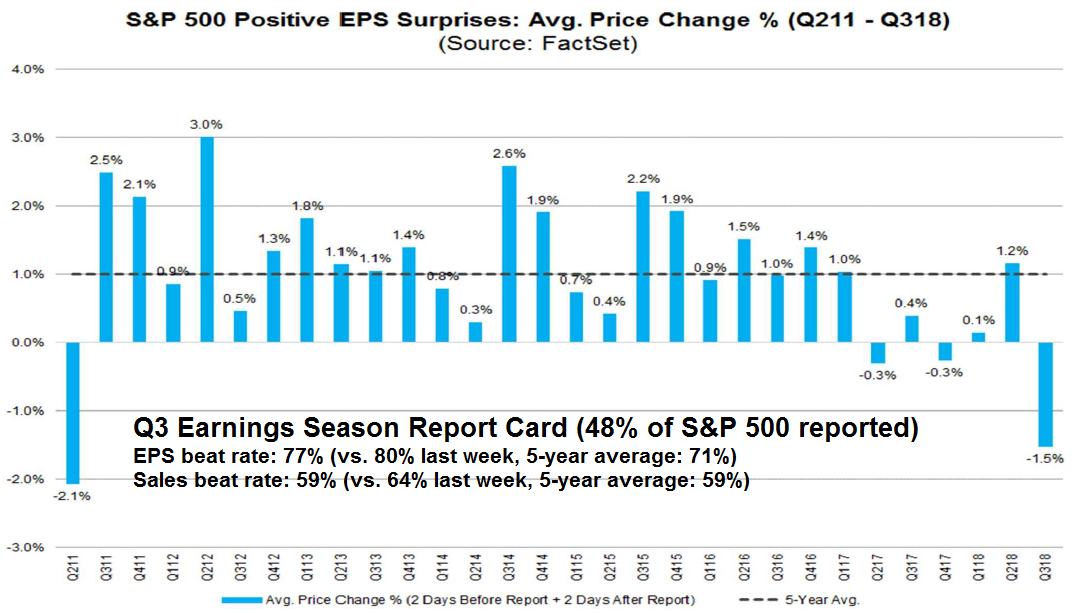
I have been increasingly cautious about the equity outlook since August (see 10 or more technical reasons to be cautious on stocks and The macro risks that keep me awake at night). My call for caution has been correct so far. The latest update from John Butters of FactSet shows that the market is not responding to good news during Q3 earnings season. Stocks that beat expectations saw their prices fall at a level that was last seen in 2011. This is all occurring when the EPS and sales beat rates are either average or slightly average compared to their 5-year averages.
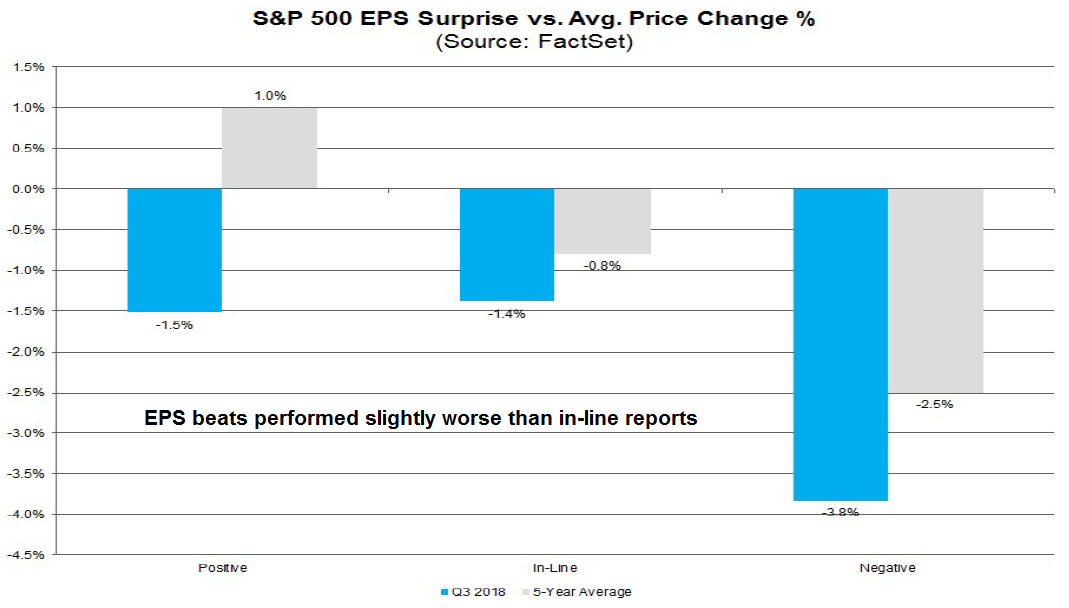
The negative stock price response to EPS beats cannot be attributable to a negative overall tone to the market. As the chart below shows, companies that have beaten expectations performed slightly worse than ones that reported in-line, while companies that disappointed were punished.
Here is what’s bothering me. A recent Bloomberg article indicated that two-thirds of business economists expect a recession by the end of 2020. .A 2020 recession is becoming the consensus call, and being in the consensus makes me highly uncomfortable. While I recognize that recessions have historically been bull market killers, what if the consensus is wrong?
Here are some possibilities that could turn me bullish. While I remain cautious on stocks and these do not represent my base case scenarios, any of these outcomes could make me more constructive on equities.
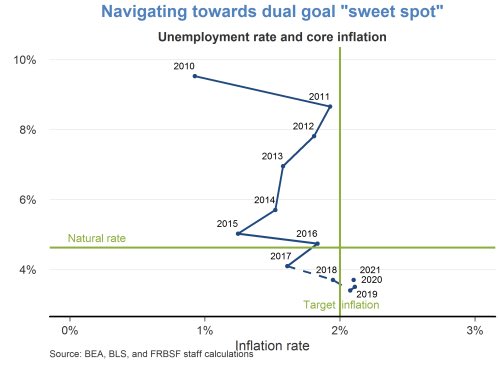
The Fed achieves a soft landing
Here is one way that stocks could avoid a bear market. What if the Fed were to achieve its fabled soft landing? Indeed, the Fed is nearing its dual goal “sweet spot” of low inflation and unemployment.
New Deal democrat, who monitors high frequency economic release and categorizes them into coincident, short leading, and long leading indicators has been calling for a slowdown next summer, though he is not forecasting a recession (see Is a summer 2019 slowdown beginning to show up in the short leading forecast?). He confirmed that outlook in his latest weekly monitor of high frequency economic indicators and found weakness in all coincident, short leading, and long leading indicator time frames [emphasis added]:
We now have weakness showing up in all timeframes. The long leading forecast has been fluctuating recently, and for the second week is neutral…The weakness has now spread to the short-term forecast, which as of this week I’m downgrading from positive to neutral…Finally, I’m also downgrading the nowcast to a weak positive, due mainly to the impact of tariffs, which has shown up in a swift decline in rail loads. An economic slowdown looks baked in the cake, with the issue of whether it leads to outright recession in a year or so still outstanding.
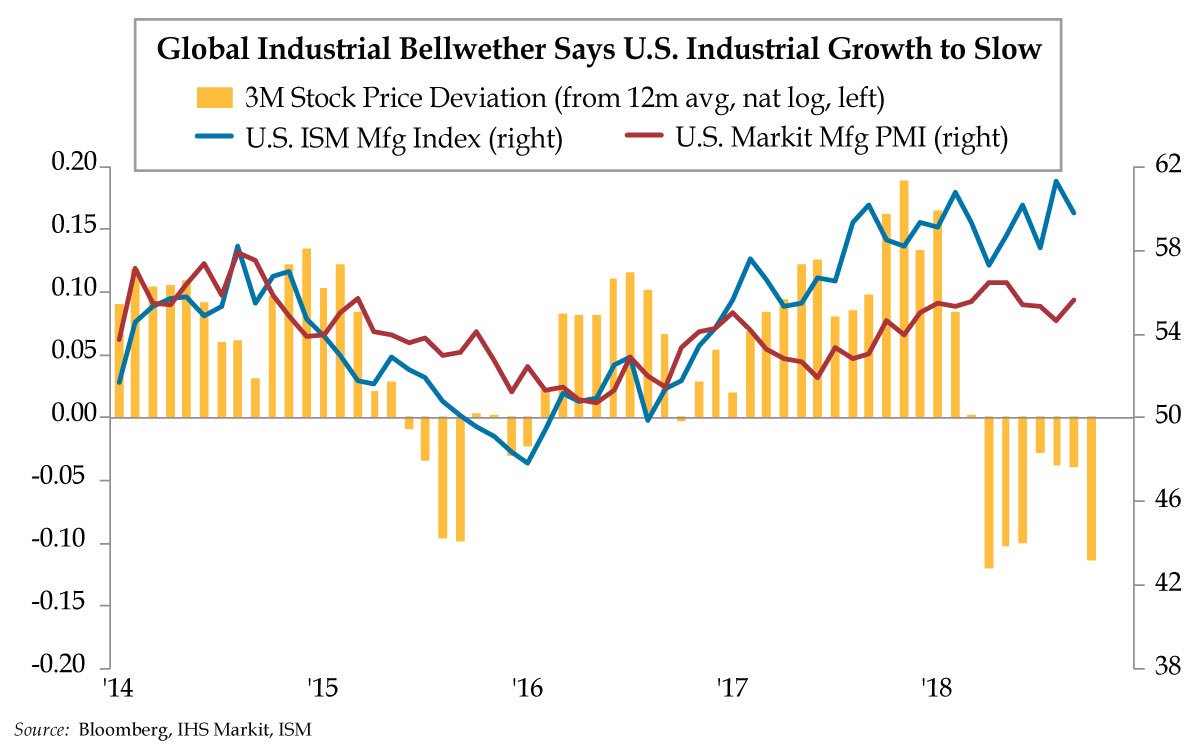
As well, the price trend of 3M, which is a global conglomerate bellwether, has acted as a good leading indicator for both ISM and Markit M-PMI, and it is suggesting a slowdown in growth.
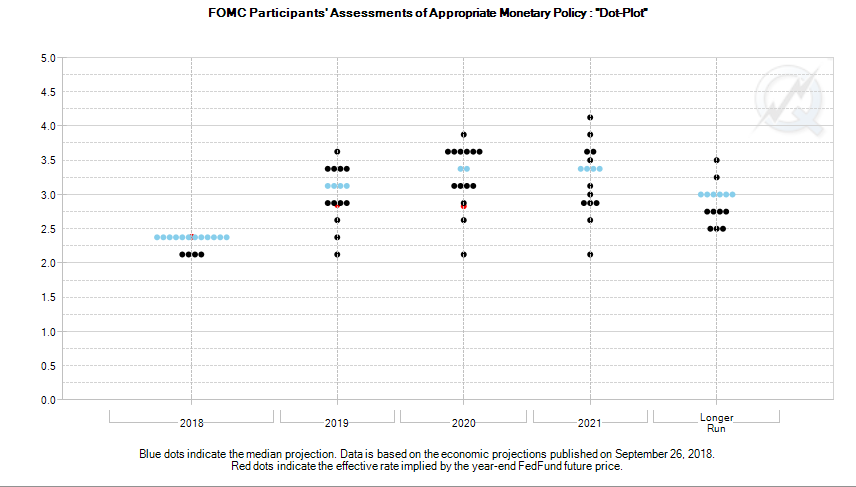
While the current median dot plot is penciling in three more rate hikes in 2019, the market is expecting between two and three hikes.
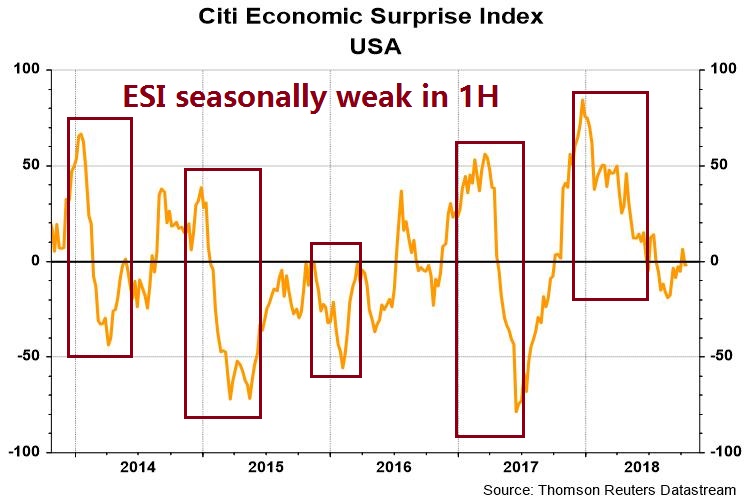
What if the Fed were to recognize the incipient weakness and pause its rate hikes? What if we were to see only one or two hikes in 2019? Historically, the Citigroup Economic Surprise Index, which measures whether economic releases are beating or missing expectations, has a seasonal tendency to be weak in the first half, and usually in Q1. If this pattern were to repeat itself in 2019, the Fed could see the growth outlook decelerate sharply early next year, and begin to react by Q2 or Q3.
So far, inflation expectations are very stable and well-anchored, which would give the Fed comfort that an easier monetary policy would not see inflation and inflation expectations spiral out of control.

While this is not my base case scenario, such an outcome is possible – if the Fed were to react in time to a slowing economy.
More fiscal stimulus: Tax Cut 2.0?
I am indebted to Kevin Muir, otherwise known as The Macro Tourist, for the following idea. What if we were to see another round of fiscal stimulus around the world? Wouldn’t that reduce the likelihood of a recession in 2020?
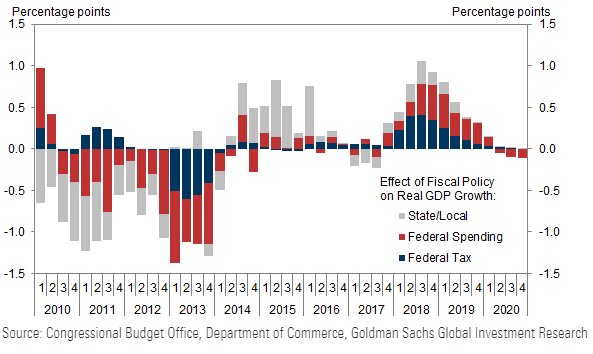
In the US, the stimulus effect from the last round of fiscal stimulus is fading.
That doesn’t preclude another round of fiscal stimulus. President Trump has trumpeted the possibility of another tax cut during the midterm election campaign. Steve Collender (@thebudgetguy) has laid out how the Republicans could pass another tax cut:
When House Republicans passed their tax 2.0 last week and then recessed until the lame duck session that begins this November, the presumption was that this latest GOP descent into bigger budget deficits was nothing more than a pre-election ploy that would never go any further.
And with Majority Leader Mitch McConnell (R-KY) saying that the Senate had no plans to take up whatever the House passed before the election, that seemed like a safe bet.
But contrary to what’s currently being assumed, 2.0 could definitely become law this year.
The legislative road to another tax cut is difficult, but not impossible during the lame duck session of Congress:
First, the House and Senate would quickly have to adopt a fiscal 2019 budget resolution with reconciliation instructions that require the 2.0 tax changes.
Second, the House-passed 2.0 would have to be designated as the legislation required by the just-adopted budget resolution’s reconciliation instructions or the House would need to re-pass 2.0.
Third, with a simple majority, the Senate could either pass its own 2.0 or…and much more likely…pass the House-adopted bill.
Fourth, the 2.0 bill now adopted by the House and Senate would then go to the president for his signature and enactment.
I am not holding my breath for tax cut 2.0 to be enacted, but I would not dismiss the possibility either.
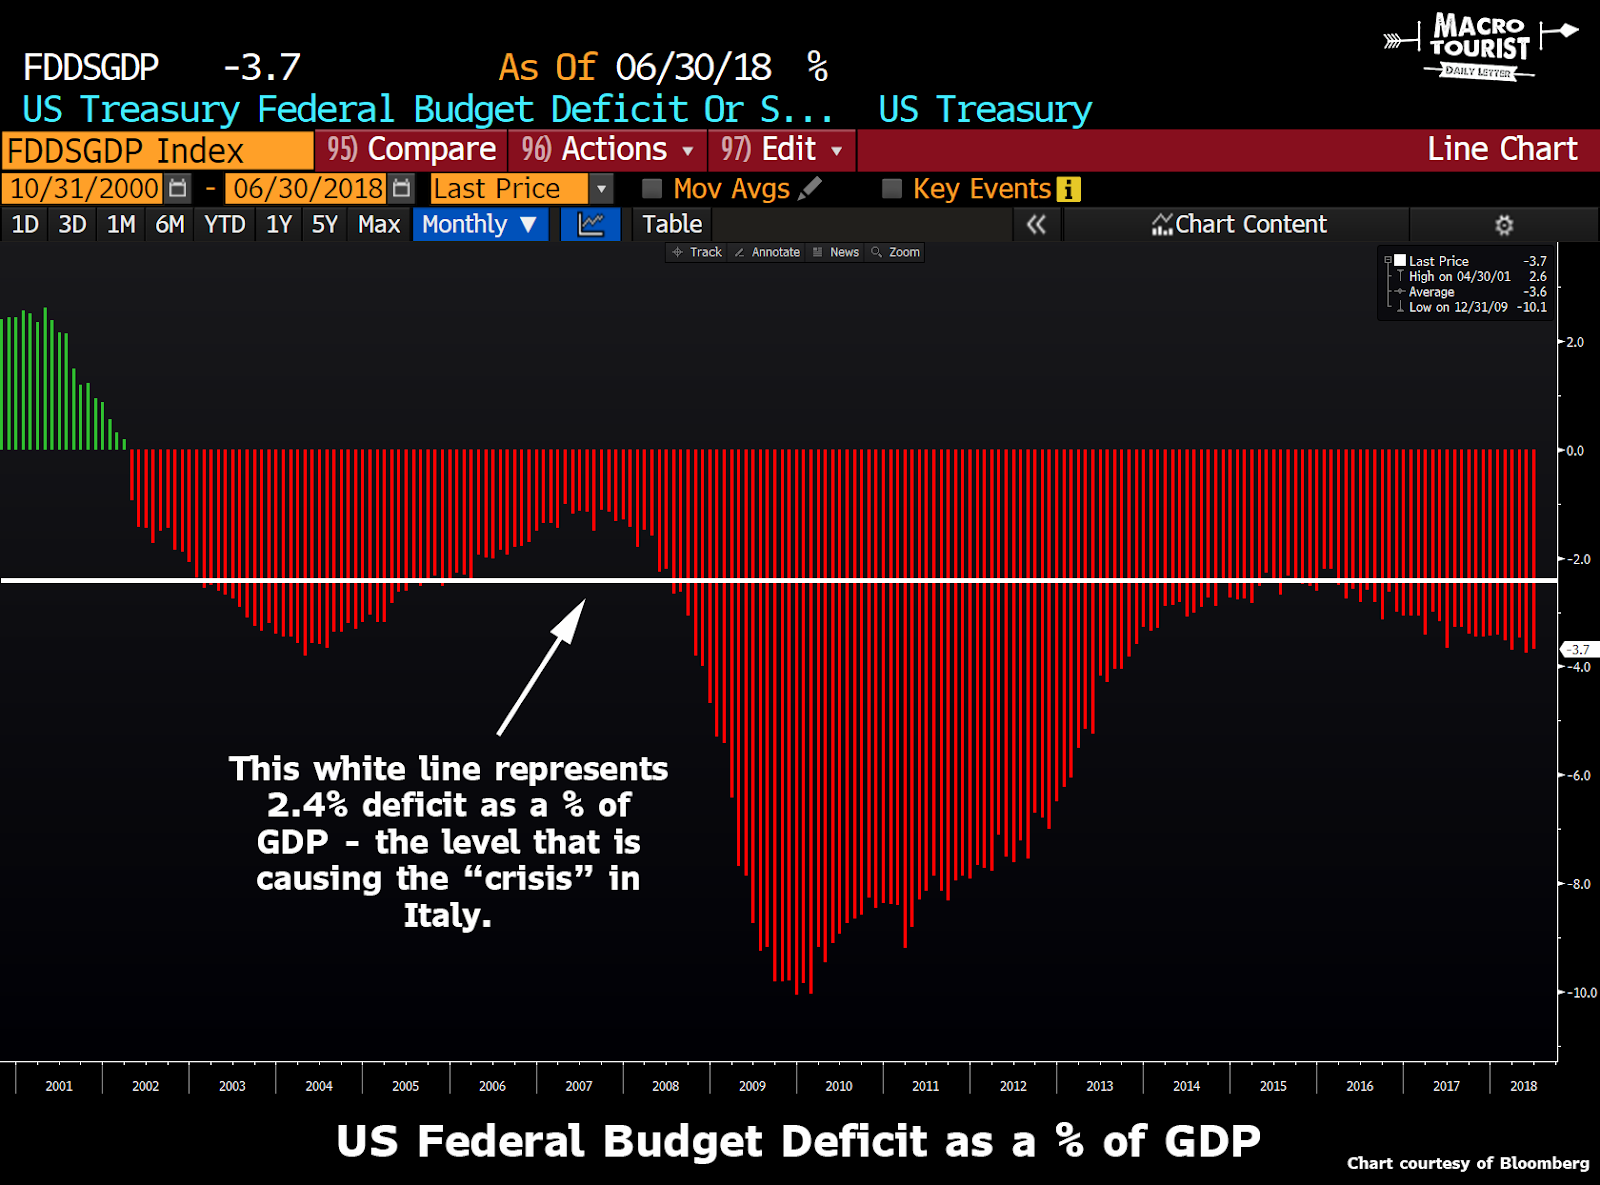
European fiscal stimulus: Italy leads the charge?
In Europe, Kevin Muir suggested that the battle over the Italian budget opens the door to dragging the EU into a round of fiscal stimulus. The Italians had proposed a budget that amounts to 2.4% of GDP, which is a level that Americans would envy.
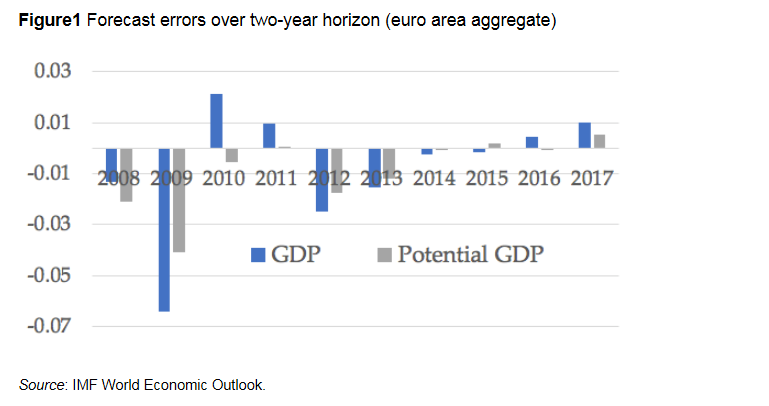
Antonio Fatás, professor of economics at INSEAD, recently indirectly supported the Italian view by stating that European fiscal policy is too procyclical and inflicting damage on the economy:
The question of how procyclical fiscal policy affected economic performance in the euro area has been controversial, with seemingly never-ending debates on the size of fiscal policy multipliers. The work of Blanchard and Leigh (2013) was an inflection point in this debate. They provided convincing evidence of large short-term multipliers in response to the fiscal consolidation during 2010 and 2011. Their work also suggested that policymakers had underestimated the size of the multipliers, making fiscal policy even more procyclical.
Building on this work, in a recent paper Larry Summers and I showed evidence that these damaging effects have persisted (Fatás and Summers 2018). Looking at forecasts to 2022, GDP is still affected by the consolidation of those early years. This is consistent with a view that hysteresis has turned procyclical policy into permanent scars on GDP.
Procyclical fiscal policy was leading to an “economic doom-loop”:
We are describing a situation in which policymakers start with unfounded pessimistic views about potential GDP. They take fiscal policy actions based on these views. Policymakers ignore both the actual size of the short-run fiscal policy multiplier, and the possibility that both the initial cyclical shock and the effects of their policies create hysteresis.
Because they underestimate multipliers, the short-term effects of their policies are a surprise. They downgrade, once again, estimates of potential GDP and engage in a second wave of fiscal consolidation. The tragedy is that as policymakers act on their pessimism about potential, the cyclical effects of their policies become permanent through hysteresis. As a result, their forecasts become true partly because of the effects of the policies they designed in response. This is self-fulfilling pessimism.
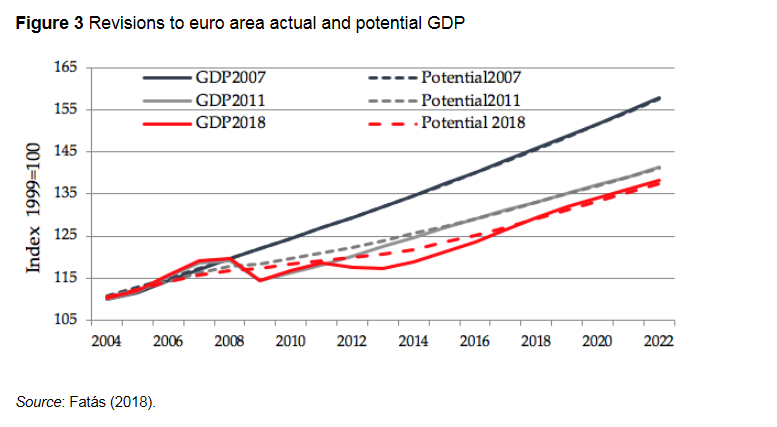
The final outcome is an economy whose potential output is significantly lower because of successive downward revisions (Figure 3). The effects of the earlier decisions are amplified through successive rounds of procyclical policy. This reduces GDP forecasts until 2022.
CNBC reported that the mob is gathering against Brussels. Budget discipline wasn’t just slipping in Italy, but France, among others:
France, the second-largest economy in Europe, received a letter from Brussels last week, warning that its planned debt reduction in 2019 does not respect the proposals that Paris had agreed previously with the EU. Spain, Belgium, Portugal and Slovenia were also effectively told off by the EU.
In the case of France, the 2019 budget plan sees its structural deficit (the difference between spending and revenues, excluding one-off items) falling 0.1 percent this year and 0.3 percent in 2019. Paris had agreed in April to an annual reduction of 0.6 percent of GDP (gross domestic product) for its structural deficit.
How much longer can the Growth and Stupidity Stability Pact survive?
Tax cuts in China
In China, the authorities are trying something different from their usual stimulus script of infrastructure-driven growth. The WSJ reported that Beijing is proposing 2019 personal tax cuts that could amount to 1% of GDP:
Beijing could enact tax cuts and other measures for 2019 equivalent to over 1% of GDP, according to Ma Jun, a former chief economist at China’s central bank. If true, that could surpass last year’s U.S. tax relief as a proportion of economic output.
Beijing’s old stimulus methods of monetary-policy easing and higher local-government spending are looking tricky to implement this time. Banks are weighed down by bad loans, while local-government-owned fundraising companies are groaning under debt of up to $6 trillion, according to Rhodium Group estimates.
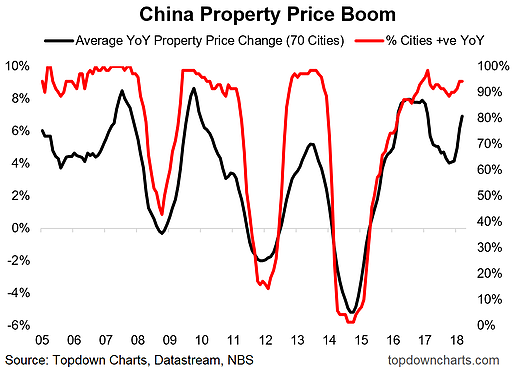
There may be some cause for optimism. Callum Thomas of Topdown Charts reported that Chinese property prices, which is a sensitive barometer of the health of the Chinese economy, is on the mend. In particular, non-tier 1 cities real estate prices are beginning to recover again, which could take the tail-risk of a property collapse off the table.
In conclusion, will any of this fiscal stimulus work, either in China or the rest of the world? Deficits hawks will recoil at the rising level of spending, but investors will recognize that stimulus will have the effect of kicking the can down the road. Whether the can kicking exercise will improve the long-term growth outlook is intermediate-term irrelevant. It will have have the effect of avoiding a 2020 recession, and therefore limit equity downside risk in the next year.
Uncomfortable questions
In spite of the forgoing analysis, I believe the scenarios of a Fed-driven soft landing, or the re-emergence of a round of fiscal stimulus, are relatively low probability events. Even if we were to accept such possibilities, the bulls have to answer some uncomfortable questions about the headwinds facing stock prices.
In the US, the markets are expressing considerable skepticism about the growth outlook. I warned in August about a negative monthly RSI divergence in the Wilshire 5000, which is the broadest index of US equities. In the past, similar negative divergences have been accompanied by MACD crossover sell signals (vertical line). The recent weakness in the stock market has driven the MACD histogram negative. An October month-end close at this level would flash a sell signal, which has been an infallible forecaster of further equity market weakness.

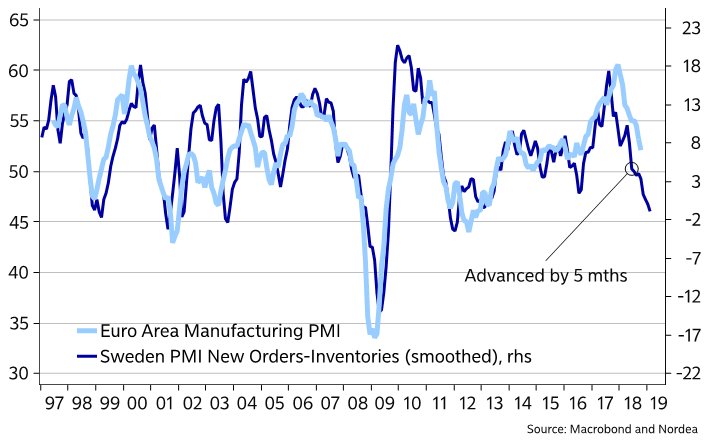
In Europe, Nordea Markets pointed out that Sweden is a small open economy and therefore a leading indicator for eurozone growth. The latest reading of Swedish PMI shows further weakness. Could fiscal action, even if it were to be enacted, arrive in time to arrest the likely weakness?
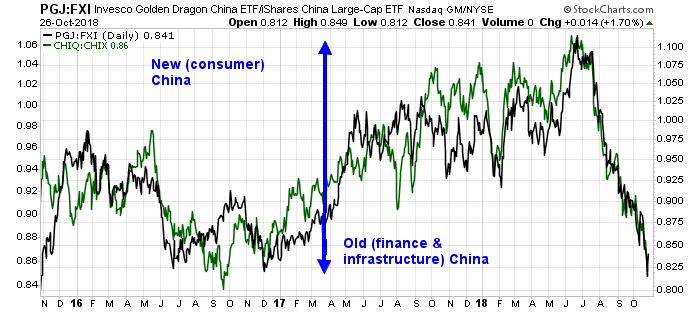
In China, the tax cut proposal is not showing up in real-time signals from my China rebalancing theme, as measured by the long New (consumer) China ETF and short Old (finance and infrastructure) China ETF pairs for quite some time. The two pairs consist of long Invesco Golden Dragon China (PBJ) and short iShares China (FXI), and long Global X China Consumer ETF (CHIQ) and short Global X China Financial ETF (CHIQ). As the chart below shows, New (consumer) China continue to dramatically underperforming Old (finance and infrastructure) China.
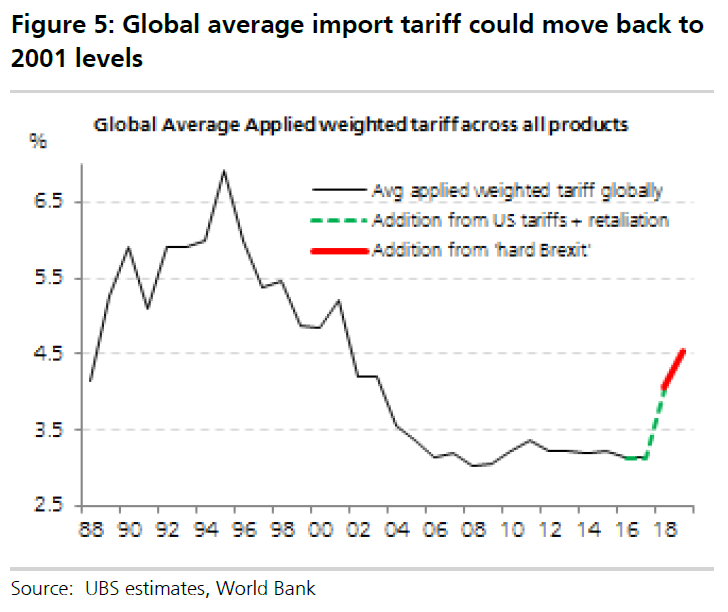
Lastly, what about the global effects of the Brexit and the trade war? Marketwatch reported that UBS estimates the combination of a hard Brexit and the Sino-American trade war could raise tariffs to levels not seen in 15 years. What would that do to global growth?
In conclusion, the bullish path that I have laid out is part of any good scenario analysis performed by analysts to measure the risks to their forecasts. While these bullish resolutions are possible, and I am maintaining an open mind as to possibilities, I continue to believe a bearish resolution is the most likely resolution outcome.
No, the market isn’t going to crash
Subscribers received a series of email alerts last week that resolved with a Trifecta buy signal near the close on Wednesday. When the market turned around and rallied strongly on Thursday, I received a series of congratulatory messages and virtual high-fives. While I was appreciative of the compliments, I thought that the sentiment backdrop had turned bullish a little too quickly, and the bottom may not be in.
When stock prices cratered at the open on Friday, the messages had turned to “maybe your model should have sold on Thursday.” There were a number of questions asking for comparisons of current market conditions to past market crashes.
Let me assure everyone. The market is not crashing. This is not 1987. To be sure, the market top in 1987 was preceded by technical deterioration, just as it was evident prior to the current downturn. However, there was one key difference. In 1987, the Fed made several staccato-style rate rapid hikes in order to defend the US Dollar. Fed policy is far less aggressive today.

This is also not 2008. The Crash was 2008 was a financial crisis. There are few signs of financial stress in the US banking system today.
That said, stress levels are elevated in China. I recently identified a number of bearish tripwires (see The storm brewing in Asia). In particular, the share prices of property developers are particularly sensitive canaries in the Chinese coalmine.
For some perspective, I refer readers to an FT Alphaville profile of China Evergrande:
It boasts an enterprise value of $145bn. In the first half of the year it generated $44bn of revenues and $4.5bn of profits, paying out half in dividends. It has $98bn of debt, $44bn of it due within the next twelve months.
The answer is China Evergrande, a real estate kraken with tentacles stretching across China. It does all things property including development, investment, management and construction, along with a host of smaller ventures in technology, finance and healthcare.
That reach makes some of the numbers mind boggling, particularly when it comes to the company’s debt. For instance, it paid $4.2bn of interest over the first six months of 2018 — more than the revenues of 259 of the S&P 500’s constituents in the same period, according to S&P Capital IQ.
fell.
Here is the latest chart of China Evergrande (3333.HK), which we find constructive for two reasons. First, the stock has not broken major support, which is a positive sign. In addition, the stock rose on Friday (October 26, 2018) even as the Hang Seng Index.
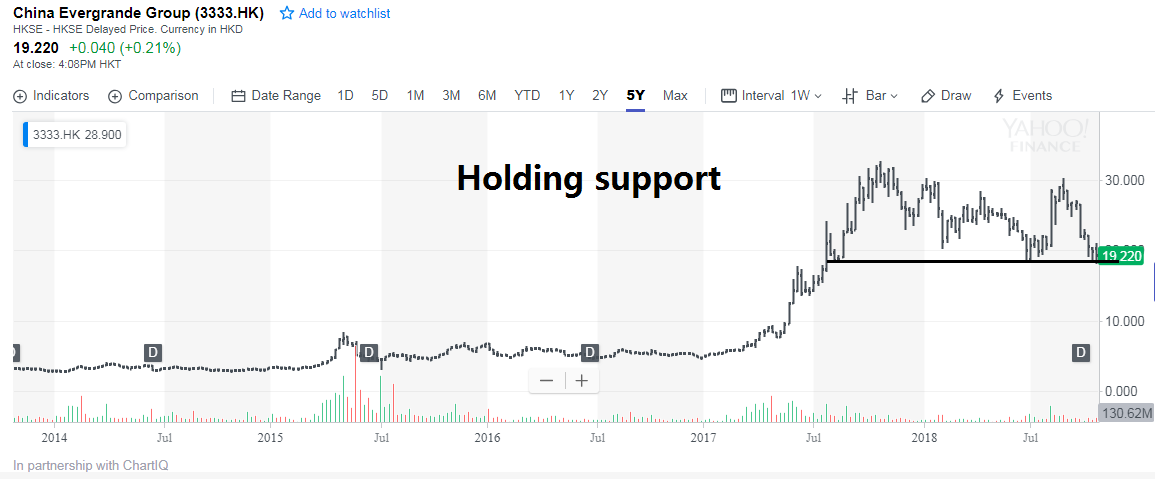
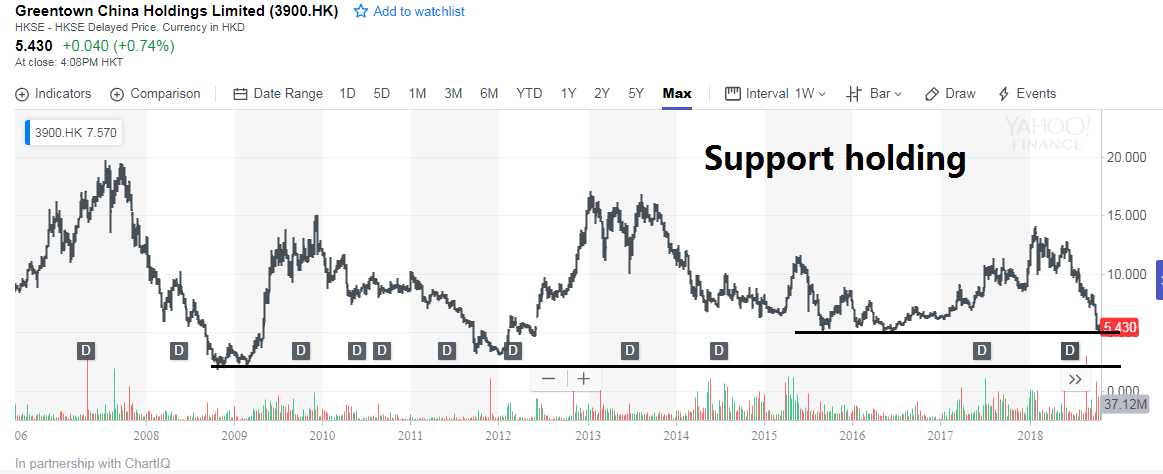
In addition, the shares of other Chinese developers with problematical chart patterns, such as Greentown China (3900.HK), are also holding key support levels.
Do you feel better now?
The week ahead: Navigating volatility
Looking to the week ahead, volatility is obviously elevated and navigating the volatility will be a challenge for both investors and traders. I will begin my analysis that begin with a longer term perspective, followed by shorter and shorter time frames.
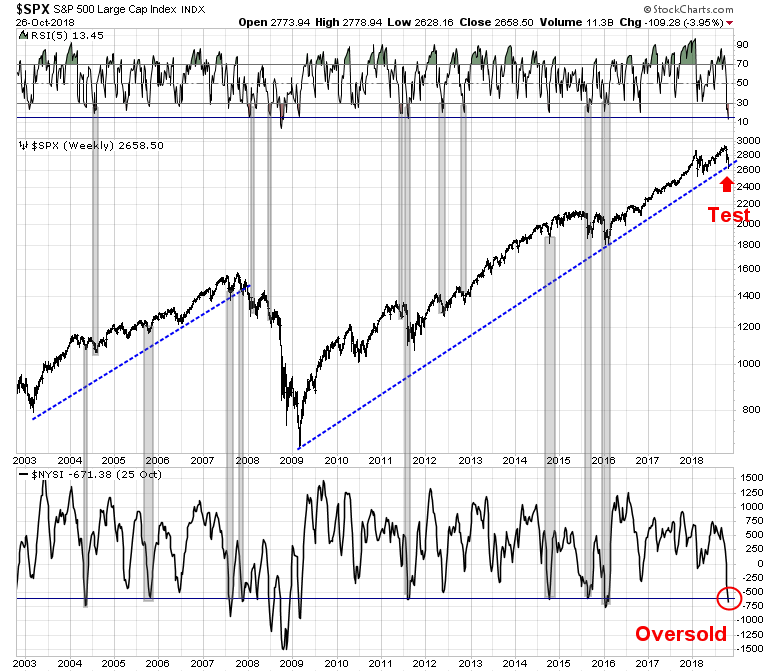
The market is seeing a rare oversold condition that has historically been resolved with oversold bounces. I highlight the following conditions from the chart below. First, the S&P 500 is testing a key uptrend line that began in the market bottom of 2009. Initial trend line tests rarely fail, which is supportive of the bounce scenario. In addition, the market is exhibiting oversold conditions on both the 5-week RSI (top panel), and the NYSE McClellan Summation Index (NYSI, bottom panel).
Bottom line: This kind of market action is evident either at the end of corrections, or at the beginning of bear markets. Even if this is the start of a bear market, stock prices have rallied first before falling again. Even the initial downlegs of the 2007-08 bear market saw oversold rallies after the market reached such oversold conditions.
In addition, the latest update from Open Insider show that insiders have been engaged in sustained buying of the shares of their own companies. While the action of these “smart investors” are not tactically useful as a short-term timing signal, this is nevertheless constructive for equity prices.

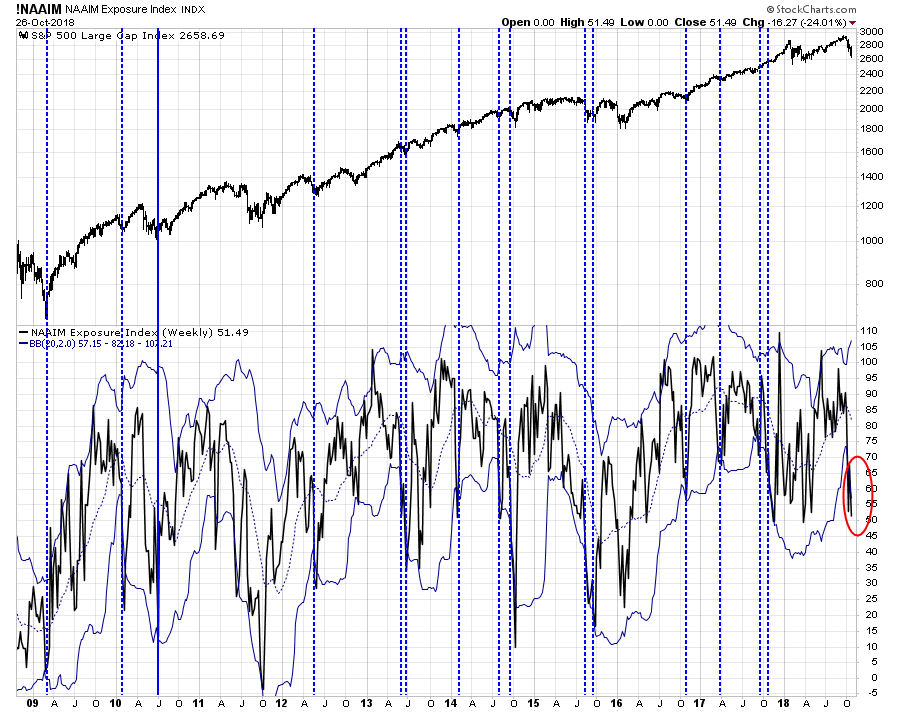
The NAAIM Exposure Index, which measures the sentiment of RIAs, is showing signs of panic. As the chart below shows, past breaches of the lower weekly Bollinger Band by NAAIM sentiment have been low risk long entry points.
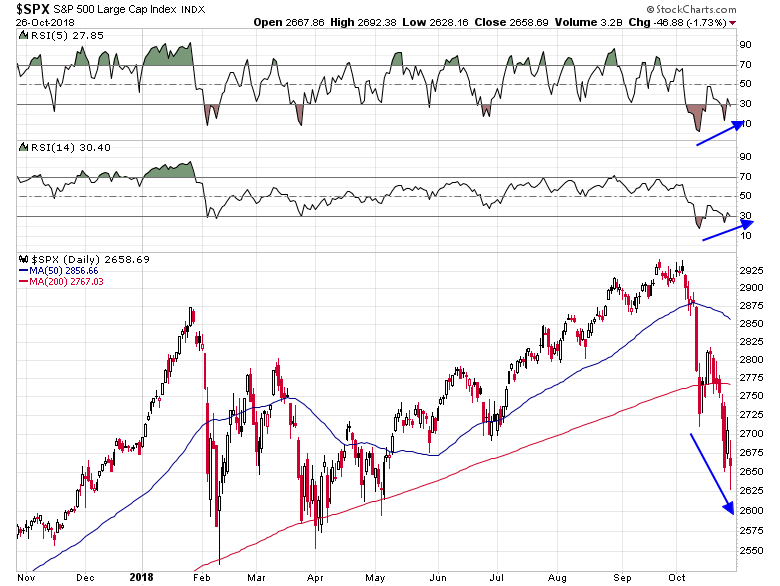
In the short-term, the market is poised for a relief rally. The S&P 500 is exhibiting a series of positive RSI divergences while testing long-term trend lines. The longer term question is price behavior once the rebound occurs. The first test of resistance is the 200 dma, which stands at roughly 2767. That will be the first test for the bulls.
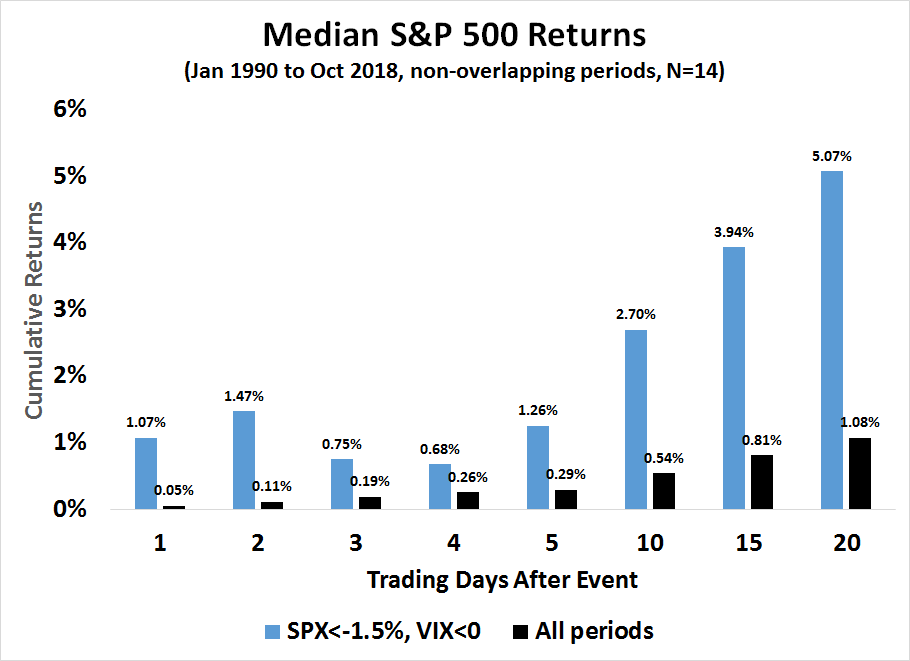
Friday’s trading saw the unusual combination of a large drop in the S&P 500 of -1.7% while the VIX Index also fell. I went back to 1990 and found that this was quite rare (N=14). As the chart below of cumulative returns shows, such events have typically seen a 1-2 day rebound, pullbacks in days 3-4, followed by rallies out to a four week time horizon.
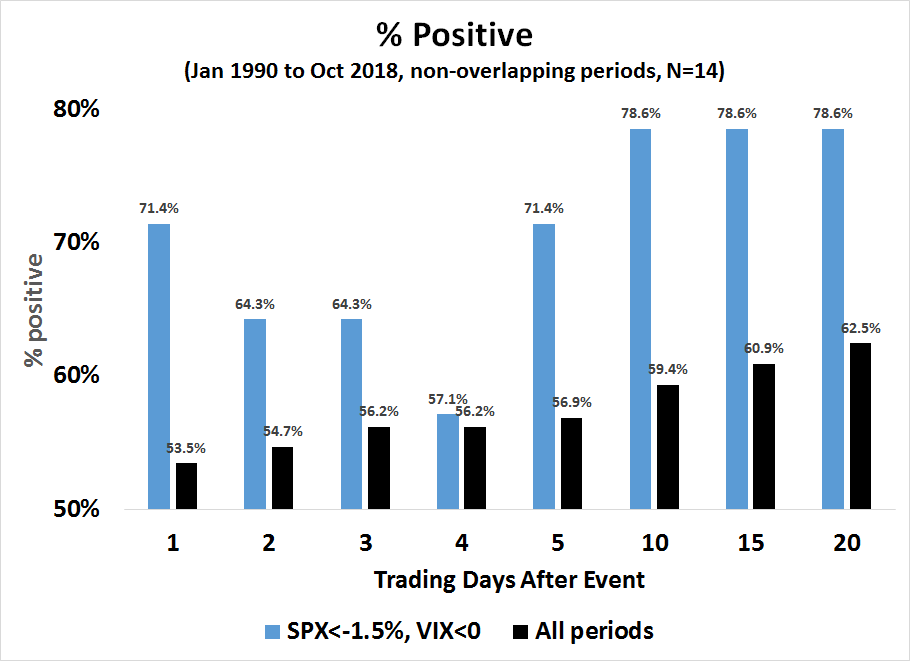
The % positive metric comes to a similar conclusion, though the success rate on day 2 is less certain.
My inner investor had been de-risking since August and he is trying to suppress a “I told you so” smirk. My inner trader bought into the market last Wednesday in anticipation of a relief rally.
Disclosure: Long SPXL
What happened on Thursday made me think of “Grab the money and run” When you enter a trade and you get an awesome move right away, if you hold then so often it gets chipped away. When dealing with an index , how often is a 2% rise followed by more upside vs a retracement of that move, especially in such a late cycle market? The only way to really pick a market top or bottom is by being lucky, but luck averages out to zero for most of us. So if you get lucky and pick a bottom and the next day it goes roaring up, maybe the best thing is to grab the money and run because odds are you can get back in.
I agree,we are ready for a bounce …the market will surprise to the upside..i bought SPY calls all day Friday.
Not sure if the VIX study applies since in this case VIX rose sharply after the 4:00 SPX closing print due to the earnings misses and VIX settles at 4:15 unlike SPX.
Look for the vix to close below the 5 day moving average for a signal.
The 1987 Crash had economic stressers in the background that would normally have created a correction but not a bear market. What caused the huge plunge was the new link between the futures market and the stock market that allowed for what was called portfolio insurance for institutions but was used by speculators. The new technology overloaded the system and a crash resulted. The remedy was to break the link between the futures and stock markets when volatility went too high.
There is today the real possibility of another accident with a large new factor, ETFs supported by stock exchange technology. A wave of ETFs might be sold on a whim or a worry by the general public on a given day that might overwhelm market stabilization systems like 1987.
China Evergrade down 4.8% again, retesting recent lows.
Elliott waves can be fit in hindsight, but I don’t think they work for predicting. But, I was thinking the rise from around April to October could be a B wave of an expanded flat. Of course while I tried positions in anticipation of the C wave it kept going higher until it was pushing the limits of a B wave. But if we are in the C wave of an expanded flat, it should exceed the A wave. There must be a lot of stops there to flush out. So if we take out that low and get a trifecta would be interesting. Just something to watch for.
We seem to be heading below the October low on the S&P 500. That said, spot VIX is only 26.xy. It is still not cracked above October high of 28.nq. Still not enough fear. Let us see if we get Black Tuesday tomorrow.
1548 EST.
Top or Bottom? I don’t see euphoria, I keep getting emails of basically stockmageddon so I wonder about euphoria. With the Fed raising rates there is noise of it sinking the market. So I wonder, will we get a good scary shakeout and then a rally in spite of rising rates and then the final rush up with a chorus of “nothing can stop this bull”? Of course we have Nov 6 coming up…Trump Bump 2.0 or Trump Dump? Maybe a Trump Dump is not too high a price for reining in a bull in a china shop….that brings in the bull and China 🙂