Preface: Explaining our market timing models
We maintain several market timing models, each with differing time horizons. The “Ultimate Market Timing Model” is a long-term market timing model based on the research outlined in our post, Building the ultimate market timing model. This model tends to generate only a handful of signals each decade.
The Trend Model is an asset allocation model which applies trend following principles based on the inputs of global stock and commodity price. This model has a shorter time horizon and tends to turn over about 4-6 times a year. In essence, it seeks to answer the question, “Is the trend in the global economy expansion (bullish) or contraction (bearish)?”
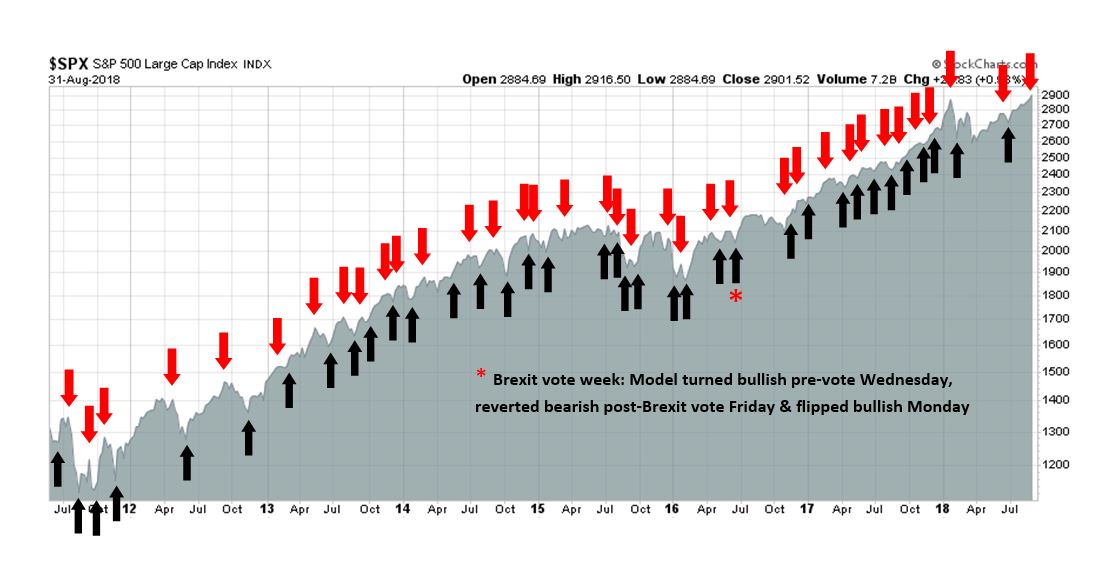
My inner trader uses the trading component of the Trend Model to look for changes in the direction of the main Trend Model signal. A bullish Trend Model signal that gets less bullish is a trading “sell” signal. Conversely, a bearish Trend Model signal that gets less bearish is a trading “buy” signal. The history of actual out-of-sample (not backtested) signals of the trading model are shown by the arrows in the chart below. The turnover rate of the trading model is high, and it has varied between 150% to 200% per month.
Subscribers receive real-time alerts of model changes, and a hypothetical trading record of the those email alerts are updated weekly here. The hypothetical trading record of the trading model of the real-time alerts that began in March 2016 is shown below.

The latest signals of each model are as follows:
- Ultimate market timing model: Buy equities
- Trend Model signal: Neutral
- Trading model: Bearish
Update schedule: I generally update model readings on my site on weekends and tweet mid-week observations at @humblestudent. Subscribers receive real-time alerts of trading model changes, and a hypothetical trading record of the those email alerts is shown here.
What keeps me up at night
Last week, I outlined the technical reasons for my cautious investment outlook (see 10 or more technical reasons to be cautious on stocks), and I promised that I would write about the macro and fundamental headwinds facing the economy and the stock market. These concerns fall into three main categories:
- The Fed’s monetary policy;
- Trade policy; and
- Policy fallout from the midterm elections.
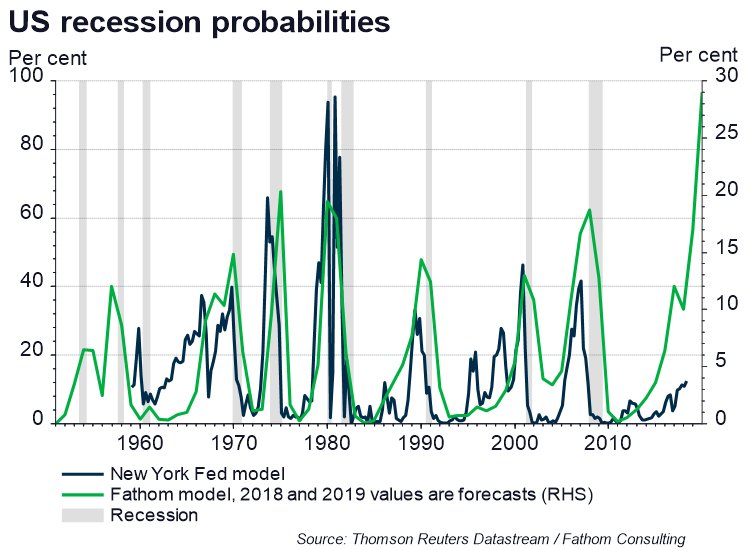
The combination of these factors have the potential to really tank economic growth. The latest Fathom Consulting forecast shows recession risk is rising dramatically.
Equally important is the analysis of New Deal democrat, who monitors economic statistics by splitting them into coincident, short leading, and long leading indicators. NDD reported that his set of long leading indicators have turned negative for the second time in three weeks. While he allowed that the data can be noisy, he is not sounding the recession alarm just yet.
[I]n the last month three of the long leading indicators have deteriorated enough to change from positive to neutral or neutral to negative, and a fourth is less than 0.1% away. The sole remaining positives are the Chicago Fed Adjusted Financial Conditions Index and Leverage subindex, and real estate loans. Corporate bonds remain neutral. Several weeks ago they were joined by the yield curve. Treasuries, refinance applications, mortgage rates, and real M2 all remain negative, plus purchase mortgage applications for the third week in a row, and joined for the first time this week by real M1…
I will require two events before this translates into a “recession watch” for over 12 months later: (1) The weekly reports must remain negative consistently for at least one full month, and (2) they must be reflected in a reliable monthly measure where available.
Rising recession risk from Fed policy
Forget all the noise about how Powell’s speech believes the uncertainty of the stars (u*, r*, pi*, also see Why the Powell Jackson Hole speech is less dovish than the market thinks), the Fed is on a preset course to raise rates.
One of the Fed’s dual mandate is price stability, or fighting inflation. It has also made it clear that its preferred inflation metric is core PCE. The dark line in the chart below shows the number of instances when the annualized monthly core PCE has exceeded 2%, which is the Fed’s inflation target. Whenever this metric reaches six or more, the Fed has embarked on a hawkish course of raising the Fed Funds rate.
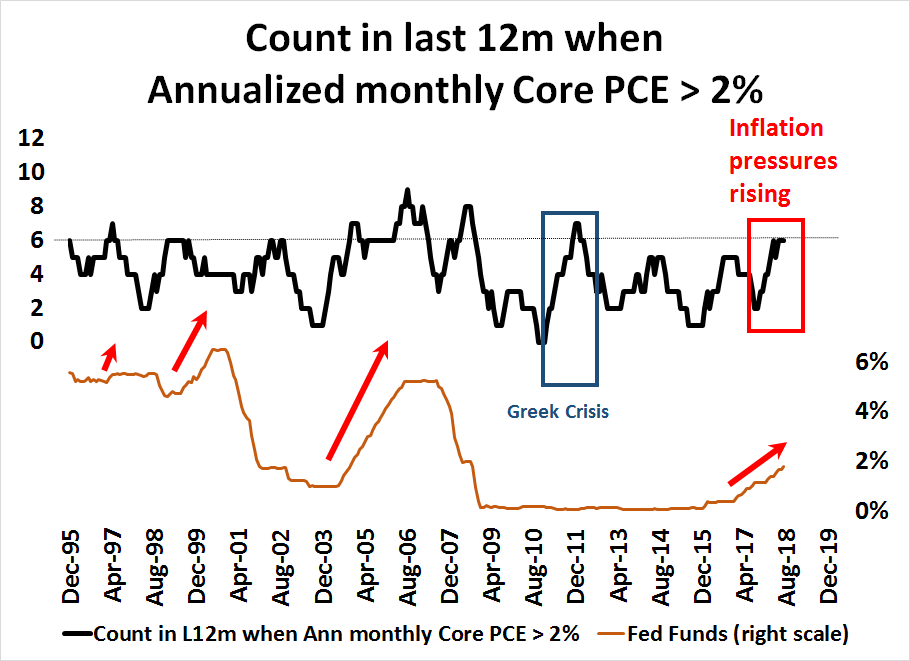
The upward pressures on inflation is confirmed by the New York Fed’s Underlying Inflation Gauge (UIG), which stands at 3.3% and rising. As long as inflation is rising, expect the Fed to maintain its steady pace of rate hikes until something breaks.

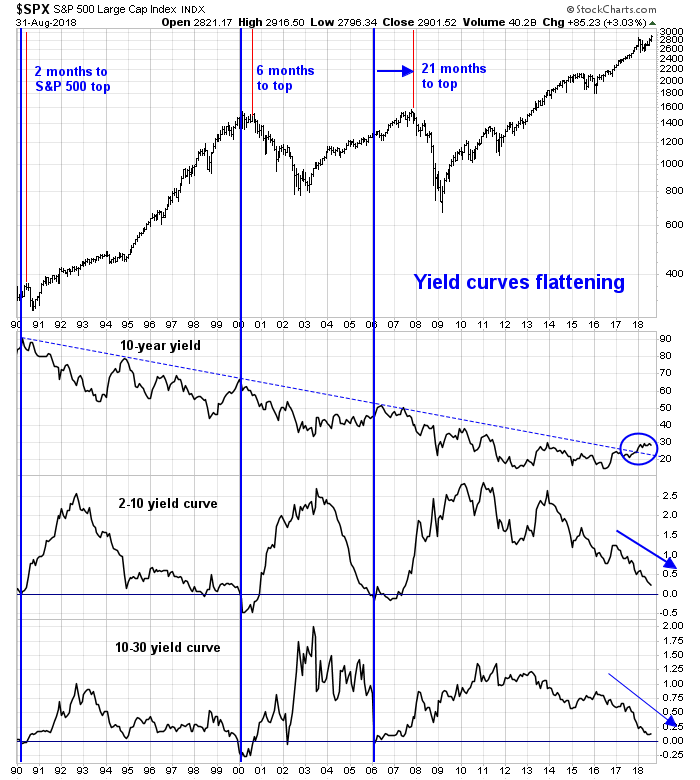
We can already see the monetary consequences of the Fed’s tight money policy. One widely observed indicator is the flattening yield curve, which flirted with the cycle low of 0.20% last week but stands at 0.21%. The St. Louis Fed reported that the 2-10 yield curve as most popular series on FRED. As so many people are focused on the 2-10 yield curve, I would tend to discount its message, especially in the QE era where the Fed`s unconventional monetary policy may have affected the yield curve. One alternative is to move out to the far end of the yield curve and focus on the 10-30 year spread, which has worked just as well in the past as the 2-10 spread.
Much ink has been spilled about the message from the flattening yield curve. A good summary comes from Edward Harrison of Credit Writedowns:
What a flattening curve says is that the Fed’s policy is tightening. It says that the Fed has less scope for more rate hikes in the near future because it has already tightened so much. It doesn’t mean recession. And it’s not a harbinger of recession.
However, when the curve inverts, then it says that the tightening has gone so far that the Fed must eventually reverse course. Lower long rates are a signal that bond markets expect the Fed to be forced to cut rates in the medium term. And that only happens when the macro outlook deteriorates. We are 15 basis points from that happening. And unless long rates increase from here, two rate hikes in September and December or September and March get us to inversion.
New Deal democrat found that while a flattening yield curve doesn’t signal a recession, it does foreshadow a slowdown in employment:
In other words, even if the Fed stops raising rates now, and the yield curve does not get tighter or fully invert, my expectation is that monthly employment gains will decline to about half of what they have recently been — i.e., to about 100,000 a month — during the next year or so.
Regardless of how the market or policy makers interpret the message from the yield curve, both the 2-10 and the 10-30 spreads are likely to invert with one or two more rate hikes. As long as inflation pressures like UIG keep rising, it will be difficult for the FOMC to pause its pace of policy normalization.
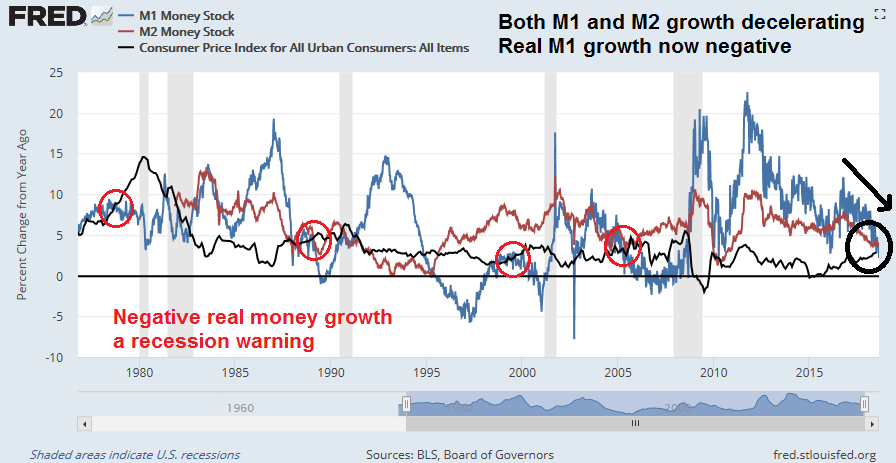
A more worrisome monetary indicator is the deceleration in money supply growth. In the past, real year/year money supply growth, measured as either M1 or M2, has turned negative ahead of recessions. While the weekly data series is noisy, real M1 growth fell negative last week, and while real M2 growth remains positive, it is decelerating and on track to turn negative in the near future.
The risks of the Fed’s tightening policy is not just restricted to the US. FT Alphaville highlighted analysis from Neels Heneke and Mehul Daya of Nedbank that global USD liquidity is drying up.
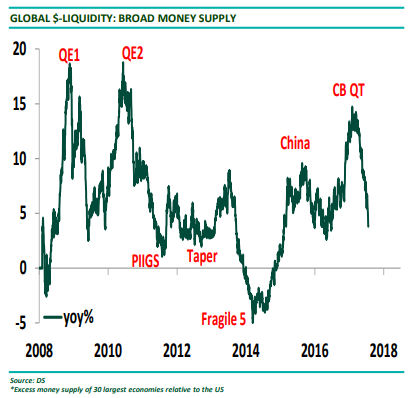
The Nedbank team pointed out the risks of a reversal in USD liquidity, particular in light of some *ahem* less than prudent risk taking among investors. We have already seen the fallout in Turkey and Argentina. What happens when the Fed really squeezes?
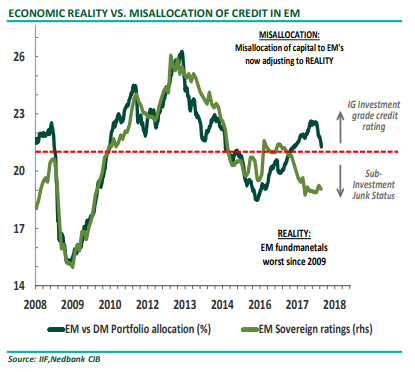
The reversal in dollar liquidity is particularly worrisome for some emerging markets, because during the post-crisis years of cheap money, investors piled into these markets to make up for the lower returns available in developed economies. Heneke and Daya chart this shift in capital allocation despite the less than stellar fundamentals
In short, the combination of a Fed tightening policy with no obvious pause in sight, and deteriorating monetary indicators are red flags that suggest a recession is likely to begin in late 2019 or early 2020. Moreover, Fed policy is likely to increase the risk in the offshore USD market, and could precipitate another EM crisis.
Rising trade war risk
While conventional macro analysis indicates heightened recession risk beginning in Q4 2019, there are a number of developments that could either pull forward the timing of a recession, or exacerbate the downside effects. The most glaring risk is that of a trade war.
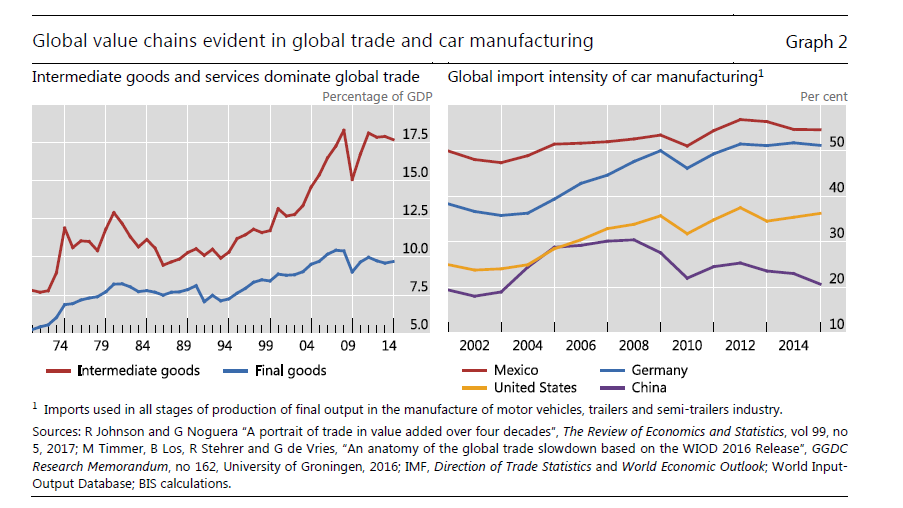
Agustín Carstens of the Bank of International Settlements (BIS) presented a paper at Jackson Hole outlining the likely consequences of a trade war. The globalized nature of supply chains presents a vulnerability for the global economy. Carstens pointed out that “global trade in intermediate goods and services is now almost twice as large as trade in final goods and services”. Many of Trump’s tariffs are now hitting intermediate goods, which raise the cost of production, which “could inflate prices, hurting both US consumers and US exports”.
Carstens also observed that rising tariffs could force the Fed`s hand to react with even more monetary tightening, and raise the risks of a currency war. This would be especially true if inflation expectations start to rise in sympathy to the price of goods.
Tariffs could therefore push up US prices, possibly requiring monetary policy to react through more rapid increases in interest rates. Such a response would widen the interest rate premium to the rest of the world and could drive the dollar higher. This would hit US exporters with a double whammy, and emerging market economies with a triple whammy. For emerging markets, a stronger dollar tightens financial conditions, triggers capital outflows and slows growth. As you can see in Graph 4, the dollar is already much stronger against emerging market currencies, other than the renminbi, than it is against those of other advanced economies. An additional twist is that US dollar strength could tempt authorities to impose even higher tariffs or even additional protectionist policies. Can the first salvoes in a currency war be long in coming?
The disruption from a trade war isn’t just limited to the trade channel, but through the banking channel because of the financial complexity of global value chains (GVCs):
Another source of vulnerability lies in the financial links that have increased with new trading relationships and production chains. Trade in commodities and finished goods requires only simple financial services, such as cross-border payments and foreign exchange. But complex trading relationships like GVCs need complex financial services to glue production processes together. The far-flung operations of multinational firms, which account for an increasing share of trade, require lots of working capital and entail lots of exposure to foreign currency risk. More complexity is added by the financial transactions needed to manage these positions, including derivatives and hedging strategies to offset currency risk.
All these links rely on the dollar, which remains dominant in trade transactions or bank loans for working capital, and in international banking or securities markets more generally. Indeed, in currency markets, the dollar prevails even more in the swap and forward markets than in the spot market.
There’s that offshore USD shortage rearing its ugly head again. Carstens went on to lay out a dire “perfect storm” scenario of a financial crisis set off by global trade war through the offshore USD banking system, which is heightened by an enormous US$11.5 trillion in offshore USD debt:
Today, we must recognise the potential for real and financial risks to interact, to intensify and to amplify each other. Protectionism could set off a succession of negative consequences. If all the elements were to combine, we could face a perfect storm.
Consider that non-US banks provide the bulk of dollar-denominated letters of credit, which in turn account for more than 80% of this source of trade finance. The Great Financial Crisis highlighted the fragility of this setup, since non-US banks depend on wholesale markets to obtain dollars. Ten years on, we should not forget how the dramatic fall in trade finance in late 2008 played a key part in globalising the crisis. Any dollar shortage among non-US banks could cripple international trade.
On top of that, trade skirmishes can easily escalate into currency wars, although I hope that they will not. As we saw earlier with Mexico, imposing tariffs on imports tends to weaken the target country’s currency. The depreciation could then be construed as a currency “manipulation” that seemingly justifies further protectionist measures. If currency wars break out, countries may put financial markets off-limits to foreign investors or, on the other side, deliberately cut back foreign investment, politicising capital flows.
In addition, we must be mindful of long-observed knock-on effects from tighter US monetary conditions, given the large stock of dollar borrowing by non-banks outside the United States, which has now reached $11.5 trillion. Policymakers in advanced economies should not shrug off the growing evidence that abrupt exchange rate depreciations reduce investment and economic growth in emerging market economies. This has implications for everybody, in that weaker economic activity reduces demand for exports from advanced economies. That would close the circle of trade tensions affecting the real economy via the financial channel of exchange rates.
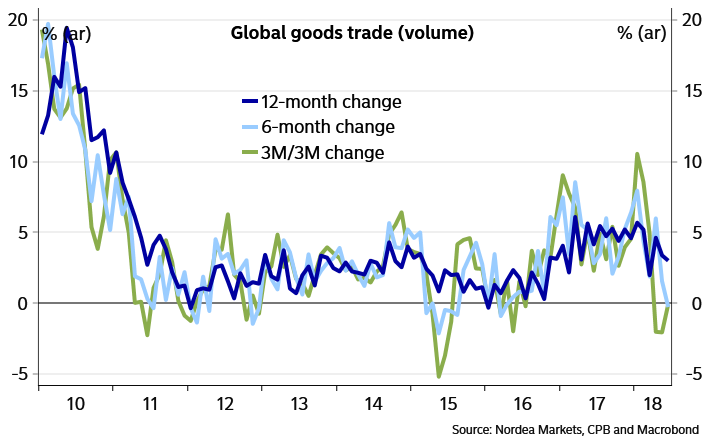
Already, there are signs of a deceleration in global trade growth. It is difficult to judge at this point whether the cause is cyclical, or the result of US tariffs.
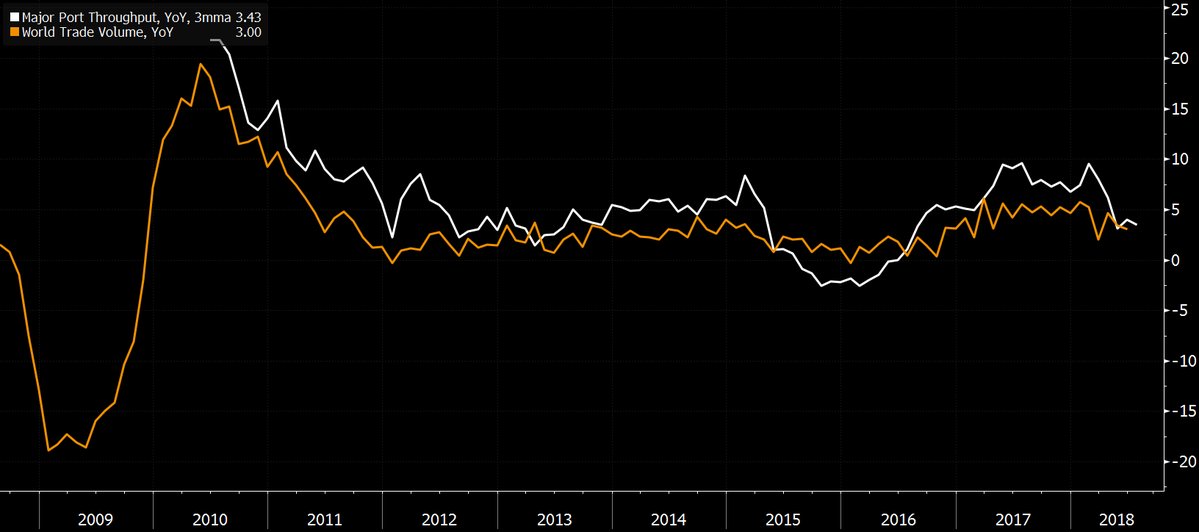
Tom Orlik at Bloomberg also found that global port volumes are decelerating.
What’s worse, Politico reported that American political considerations suggest that a Sino-American trade war is more or less baked-in:
Trump’s hard-line tactics and hardheaded determination to exhaust Chinese President Xi Jinping’s resolve has led some analysts and trade experts to doubt whether a negotiated outcome is Trump’s true aim — or whether he simply wants to forge a new economic status quo marked by higher tariffs on trade between the world’s two largest economies.
“By not having an agreement, Donald Trump really looks good and tough,” said Robert Lawrence, a Harvard University trade and investment professor. “He can say, ‘Look, we’re imposing all these tariffs.'”
“Once you get an agreement, people are going to look at it and say, ‘Did you really solve our problem?'” Lawrence added. “So, I actually believe the Chinese will make offers and it most likely will never be enough — and we’re going to sit with these tariffs in place for a very long time.”
In the short time he has before the midterm elections, Trump can either blame China or Mexico for the trade deficit, and lost manufacturing jobs. Those circumstances make China the more convenient political culprit:
Since Trump has blamed both Mexico and China for lost manufacturing jobs, it would be politically difficult for him to reach a deal with both countries at the same time and still convince his political base that he is looking out for their interests, said Derek Scissors, a resident scholar at the American Enterprise Institute.
“My argument is not that the president absolutely wants higher tariffs on China. But he’s not going to defend a trade deal with Mexico and go through the NAFTA wringer and then say, ‘OK, I also got a trade deal with China,'” Scissors said. “One of the ways you defend a trade deal with Mexico is you say the real problem here is with China.”
Even a US-Mexico trade deal is no panacea. Jeffrey Schott at the Peterson Institute believes the auto deal could backfire on Trump:
If implemented, these changes would raise the cost of cars and trucks produced in North America and possibly reduce the sale of cars assembled in North America, the opposite of the intended effect.
If this proposed change to NAFTA seems illogical and counterproductive, you’re right. Raising the cost of producing a car or truck in North America is not a good recipe for commercial success. Foreign producers don’t have to follow the convoluted NAFTA requirements to sell their cars in the US market; instead, US auto importers merely pay a 2.5 percent tariff—which doesn’t require them to meet any domestic or regional content criteria. So if the proposed NAFTA content rules force North American automakers to switch to higher priced local suppliers, and the added cost is more than the current import tariff, NAFTA will actually benefit importers by giving them a price advantage over North American production.
The only way to mitigate the negative effects of rising prices of American autos is to start another trade war:
The only way the NAFTA revision would not hurt US-based automakers is if the United States were to raise the cost of imported cars by imposing a stiff new tariff on imported cars from Europe, Japan, and South Korea above the maximum rate of 2.5 percent set by US obligations under the World Trade Organization (WTO). This could be done presumably by invoking the authority of Section 232 of the Trade Expansion Act of 1962 to restrict imports that threaten to impair US national security. Using Section 232 authority is the only way that US officials arguably can raise tariffs without violating the letter of WTO obligations and/or paying compensation to affected exporting nations.
In the face of persistently rising prices, how would the Fed react? Would regard these developments as a transitory effect on inflation, or would they push harder on the monetary brakes?
Now do you see why I lay awake at night?
The election effects that no one talks about
In addition, there is an electoral effect that I have not seen any analyst or strategist talk about. The polls indicate that the Democrats are likely to regain control of the House, though the Senate is likely to still see a Republican majority.
What are the likely effects of such a political transformation, and how would the market react?
If the Democrats were to become the majority in the House, they would have control of the committee chairmanships. Axios reported that the Republicans have compiled over 100 subpoenas and probes that would make life at the White House a living hell. These probes would range from Trump’s tax returns, to Jared Kushner’s ethics law compliance, to classified discussions at Mar-a-Lago, just to name a few.
While the first order market effects are likely to be minor, and regarded as more inside-the-Beltway fights, it would paralyze the government and tie the President’s hands on any legislative initiatives. The risk is Trump may use his other executive powers to assert his authority, such as to escalate a trade war, or to start a shooting war somewhere.
As well, Bloomberg reported that the Democrats have already laid out their tax plans should they retake the House. These initiatives include:
- Raising the corporate tax rate;
- Raising the capital gains tax rate;
- Repeal the carried interest tax break;
- Revise small business taxes; and
- Undo the SALT limit.
While the carried interest tax break and SALT limit provisions are relatively small potatoes, there is consensus among Democrats about the issue of corporate taxes:
Democrats are finding success — particularly among blue collar workers over 50 — by tying the corporate tax cuts to future reductions in Medicare, Medicaid and Social Security, Lake said.
Slashing the corporate tax rate to 21 percent from 35 percent is estimated to cost $1.3 trillion over the next decade, according to estimates from the nonpartisan Joint Committee on Taxation. Increasing the rate, by at least a few percentage points, is likely to figure in Democrats’ sights as a way to offset the costs of other investments.
In an infrastructure plan released in March, Senate Democrats called for a 25 percent corporate rate. More moderate House Democrats, including Neal, have said they’re supportive of a rate in the mid-to-high 20s. Representative John Delaney, a Maryland Democrat who is running for president in 2020, has called for increasing the corporate rate to 23 percent and to use additional revenue to fund infrastructure.
It is unclear at this point what the midterm elections are, and how big a Congressional vote margin the Democrats can muster to push through a corporate tax hike. One risk for investors is the market is not pricing in the chances of a corporate tax increase, however modest. In addition, the Congressional Budget Office has projected that the stimulative effects of the tax cuts are likely to start fading they take effect after two years, or 2020, the addition of any corporate tax increases would create a potent ingredients for a fiscal induced slowdown just as the full effects of monetary tightening are being felt in late 2019 and early 2020.
As we approach the midterm elections, expect analysts to begin to focus on the ramifications of a Democrat victory. Fiscal policy is likely to become either unchanged or slightly tighter in 2019. The combination of a tight fiscal policy and tight monetary policy is likely to tank the economy into a slowdown – which is a scenario that is not discounted by the market.
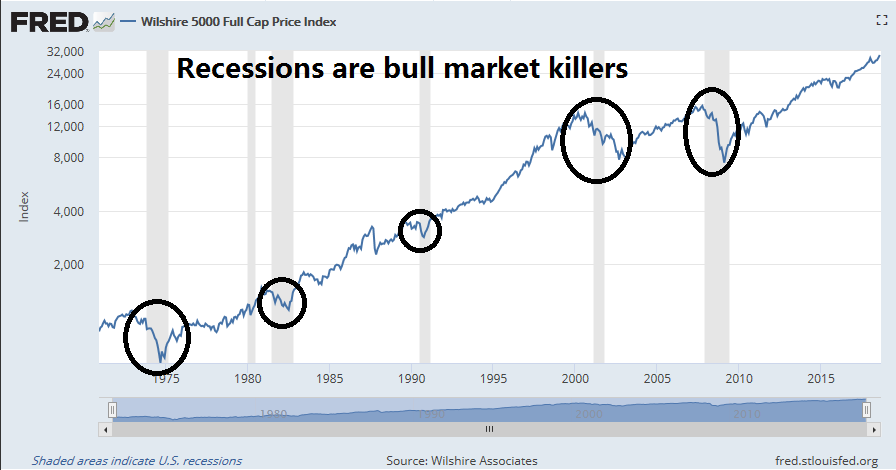
In conclusion, there are a number of macro headwinds that equity investors face. The combination of a tight monetary policy, aggressive trade policy, and the possible post-midterm election tighter fiscal policy are likely to tank the economy into a recession. As history shows, recessions are bull market killers. The only question is the degree of downside risk (see How far can stock prices fall in a bear market?).
The week ahead
Looking to the week ahead, the market action last week appeared to have been climactic. In the last 12 months, the market has ridden the top of its Bollinger Band (BB) 10 times, not including the most current episode. The market has pulled back in 7 out of the 10 occasions (blue circles). The only three exception (red circles) were marked by continued overbought readings on RSI-5, defined as RSI staying above 70, during those episodes. The RSI-5 reading as of Friday’s close was 68.8, which is below the 70 overbought line. This suggests that we are due for a period of short-term weakness.
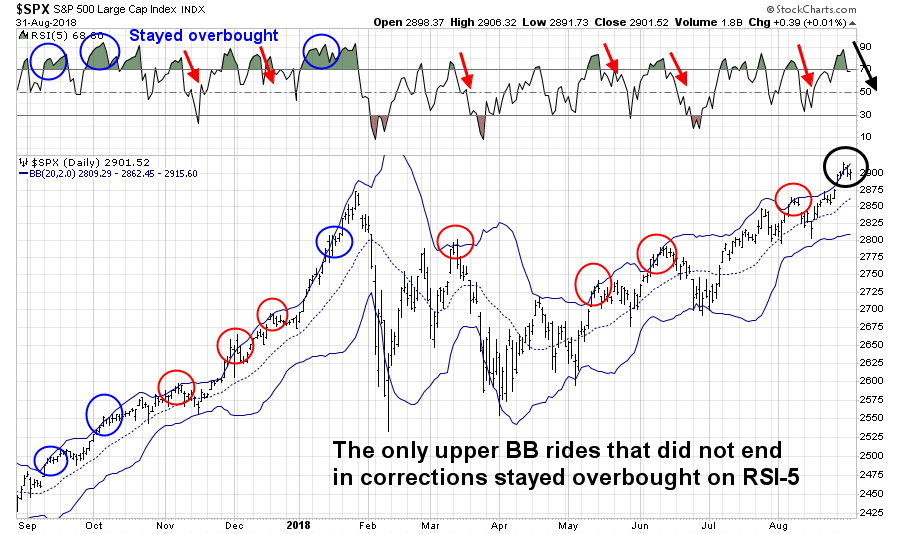
While this may be a case of torturing the data until it talks, the minimum target for a pullback in 6 of the 7 upper BB breaks was the 20 day moving average (dma). Since the 20 dma has been rising, that makes the 2860-2880 zone the initial downside target.
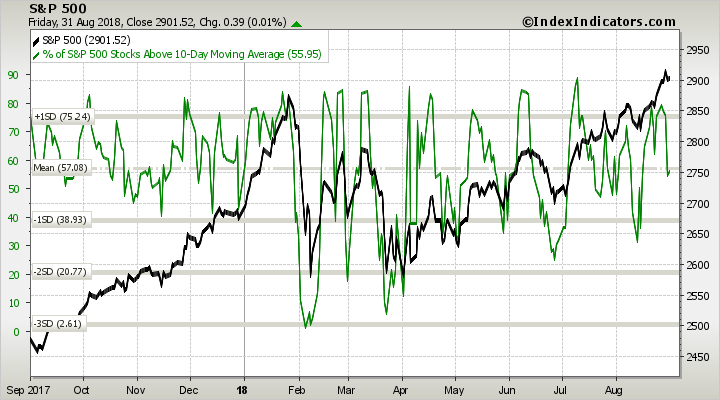
Short-term breadth indicators from Index Indicators confirms the bearish trading outlook. Price momentum is negative, and readings are nowhere near oversold territory.
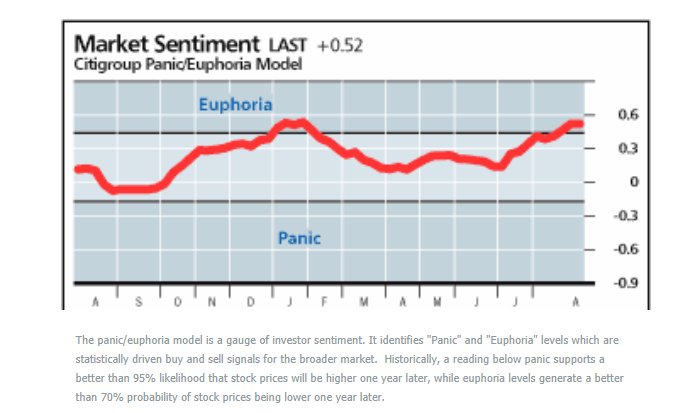
The Citi panic/euphoria index is firmly in euphoric territory, which is contrarian bearish. The last time this happened was January, when the market peaked out and shortly began a corrective period.
Despite my intermediate term bearish bias, one of the challenges for my inner trader is the recent achievement of fresh all-time highs in several major US equity indices. All-time highs are generally bullish and should be respected and not be ignored. I will be watching how the market behaves during the upcoming period of likely weakness. One of the challenges for the bulls is whether we can see a Dow Theory buy signal, marked by fresh highs in both the DJ Industrials and Transports. The DJTA staged an upside breakout to new highs during the latest rally, and the DJIA is roughly 650 point from a new high.

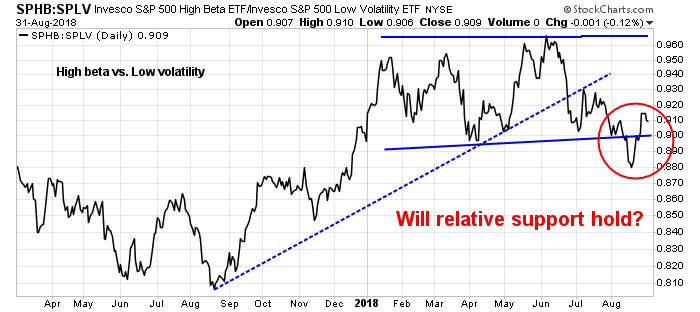
Another indicator to watch should the market pull back is the behavior of equity risk appetite, as measured by the high beta vs. low volatility pair. The ratio recent breached a key relative support level, but rallied back above support turned resistance. Will relative support hold this time if stock prices weaken?
My inner investor has been taking advantage of the recent rally to scale back his equity holdings. My inner trader remains short the market.
Disclosure: Long SPXU
I am reading a book by Peter G. Peterson titled “Running on Empty”. He is the Billionaire founder of Peterson Institute (see Cam’s reference, above).
The book is a must read for someone trying to understand how US politicians have dug a big financial hole and getting out of it may be difficult at best. Wholeheartedly recommended.
The book reads as though it was written yesterday. Just realized it was written in 2004!
I remember reading the book “Banruptcy 1995: The Coming Collapse of America and How to Stop It:”. It was published in 1995, and scared the heck out of me. Just goes to show how difficult it is to predict the future.
I remember reading the book “Banruptcy 1995: The Coming Collapse of America and How to Stop It:”. It was published in 1992, and scared the heck out of me. Just goes to show how difficult it is to predict the future.
I used to be scared witless of these doomster stories when I was younger. Then I learned to distinguish between the “this will not end well” stories outlining rising risk, e.g. rising debt levels in China.
The key is to recognize the risks, and learn to watch for the bearish triggers. If there is no obvious trigger, the boom can go on for much longer than you expect.
You will note that my analysis now all have specific time horizons. The outcomes I am projecting are expected to occur in the 12-18 months, not someday.
Another excellent analysis, Cam.
The OECD Leading Economic Indicator for the US just turned down. Canada and Europe were already falling. Here is the chart.
https://product.datastream.com/dscharting/gateway.aspx?guid=f2e06730-1148-4a30-a063-7ce8cb05da8b&action=REFRESH
Note how this type of weakness preceded intermediate corrections in 2011 and 2015. Plus of course, bear markets.
Most people just watch the Conference Board Leading Economic Indicator which is still rising.
American politicians have promised benefits way beyond what America can afford. A day of reckoning is coming, no matter what one may say. Sure, doomsday predictions have so far not come out to be true, but they will, one day. Peter G. Peterson’s book is prescient in its message.
Hi Cam, thanks for the analysis. I remember earlier this year many of us considered Trump a joke and you have also considered some of his negotiation wins a farce (i.e. declaring victory after getting only negligible concessions). But if I remember correctly you did say that Trump would be more Trump-like after passing the tax law. That seems to be the case now. Just curious what you observed earlier this year that helped you foresee Trump’s aggressive change in trade after passing the tax law?
In his first year, Trump had governed mostly like a typical Republican President. It was clear (at least to me) that once the Party got it wanted in the form of tax cuts and deregulation, Trump would revert to his core beliefs in his second year.
Good newsletter but I have to take issue with a couple points.
1) I disagree with the quotes of the left leaning analysts that conclude that President Trump is prolonging a trade war with China and will never be satisfied. While the stakes are very high with regards to China, negotiations are ongoing and the U.S. MUST insist on certain changes to the way China operates. Xi is not ready to concede these changes so it may take some time to achieve. But, if a recession approaches next year China will surely suffer more and eventually agree to a much better framework for the U.S.
2) Should the Democrats gain control of the House of Representatives (not a certain outcome) their increasing corporate tax platform will not make it through a Republican Senate or a Presidential veto. The harm they present will be from the ongoing investigations of Trump and his family making governing difficult. Also, it will then be nearly impossible for the President to get any beneficial economic legislation passed.
However you interpret it, the backdrop is at best neutral, and at worst bearish for equities.