One of the most frequently asked questions from last week’s post (see Major market top ahead: My inner investor turns cautious) was my downside objective for stock prices. While technical analysis could highlight a possible trigger for a bear phase, it is less reliable for quantifying downside risk.
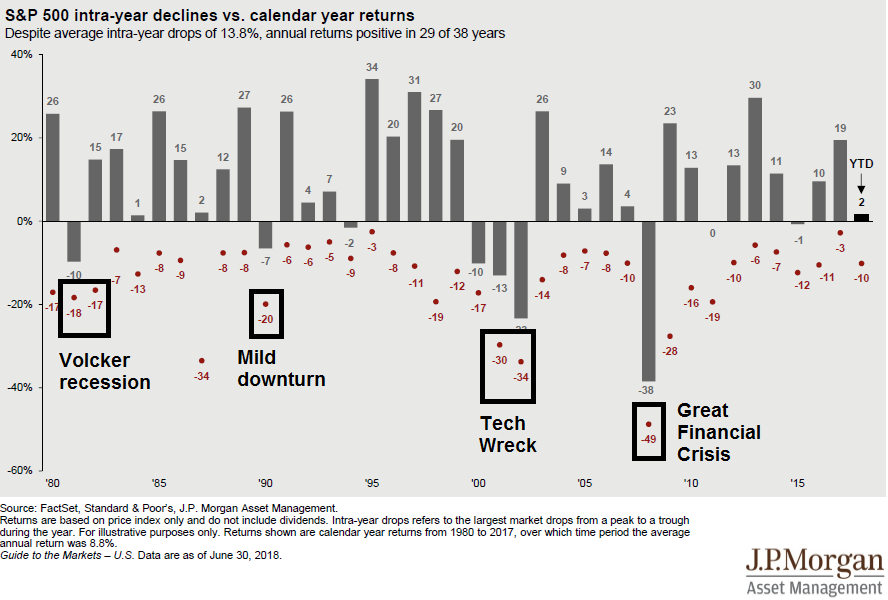
Assuming the trigger for a bear market is a recession, one way to guesstimate downside risk is to examine how the historical record of stock prices behaved in past recessions. Beginning in 1981-82, that bear market was particularly nasty because it lasted over a year, and it was triggered by the Volcker tight money era. The 1990 bear market and recession, which was ostensibly triggered by the Iraqi invasion of Kuwait, was mild. The Tech Wreck in the aftermath of the NASDAQ Bubble in 2001-02 was also painful, but was preceded by an unprecedented surge in stock prices. The bear market of 2008 was short and sharp, but stock prices fell roughly 50%. In conclusion, the historical record indicates that downside risk is in the 20-50% range.
But that’s not the whole story.
A fundamental perspective
That 20-50% figure is wide enough to drive a truck through. Another way of estimating downside risk is to analyze two components.
- How much will earnings fall in a downturn, and
- How will the capitalization rate, or the inverse of the P/E ratio, behave in the same period?
History gives us some guidance. Earnings fell roughly 20% in the “mild” 1990 recession, and fell considerably more in the post-NASDAQ Bubble and the GFC, in the order of 40-50%.
Recessions tend to be periods in which the excesses of the past cycle are unwound. Arguably, there are few excesses evident in the American economy outside of sky high unicorn valuations in Silicon Valley. Even if the likes of Uber were to blow up in the next downturn, their demise is unlikely to sink the economy. That argues for a mild Fed-induced recession, where earnings fall 20% for purely cyclical reasons, such as a downturn in housing, and so on.
However, if we were to cast our eyes around the world, the excesses are not to be found within US borders, but abroad. I don’t need to repeat the story of how high debt levels in China represent an accident waiting to happen. Imagine the following scenario, the Fed induces a mild slowdown in the US, which could be exacerbated by a trade war. Falling American consumption craters Chinese exports, and drags the Chinese economy into a slowdown through the combination of falling trade, and defaults from excessive debt. The Chinese slowdown tanks most of Asia, such as Hong Kong, South Korea, Taiwan, and Japan, as well as the resource extraction economies of Australia, New Zealand, Canada, Brazil, and South Africa. Germany, which is the growth engine of the eurozone and a major exporter of capital equipment to China, slows, which drags down European growth and exposes the banking leverage problems that were not fixed from the last crisis.
On top of that, shrinking USD liquidity in the offshore market pressures EM economies (see Turkey). In short, these are the ingredients for another Great Financial Crisis.
To quantify downside risk, we modeled different scenarios, where earnings fall 20% in a mild recession, and 40-50% in a deeper crisis. I have combined that with projections of how the P/E ratio might behave under different interest rate scenarios. CNBC reported that Jamie Dimon believes the 10-year note should be yielding 4%, and 5% is not an unrealistic outcome.
Though the bank chief previously theorized that the yield on the benchmark 10-year Treasury note could reach 4 percent in 2018, his comments Saturday at the Aspen Institute’s 25th Annual Summer Celebration Gala appeared to reflect his belief in a stronger economy.
“I think rates should be 4 percent today,” Dimon said. “You better be prepared to deal with rates 5 percent or higher — it’s a higher probability than most people think.”
In a similar vein, Josh Brown recently highlighted some anecdotal analysis from Larry Jeddoloh in Barron’s:
A couple of weeks ago, I drove exactly the same route I did two weeks before the elections in 2016—through Winston-Salem and Raleigh-Durham and Charlotte, N.C., up into the Shenandoah Valley in southwestern Virginia and then up to Washington, D.C. One reason I thought Trump would win was that almost every lawn had a Trump sign. It went on for miles. Now it has completely flipped—there are no Trump signs, but there are large numbers of Help Wanted signs. We are going to get some wage pressure. The Fed will be pushed to raise interest rates. The natural rate for 10-year Treasury yields is more like 4% to 4.25%, not 3%. The last time the 10-year took a run to 3%, in January and March, the markets started to wobble. The speed of the move is just as important as the level. So the market can drive the economy in my view.
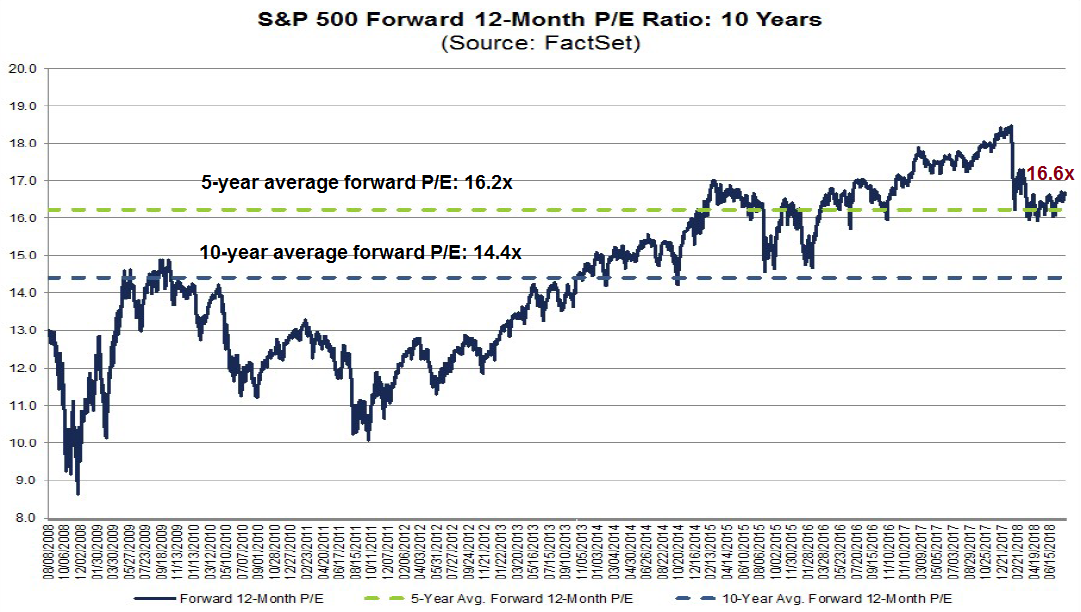
According to FactSet, the forward P/E ratio stands at 16.6, which is not significantly different from its 5-year average, indicating valuations are not overly excessive. We can then calculate an equity risk premium based on the 10-year yield of 2.9%, where ERP = E/P (1/16.4) – 2.9% = 3.1%. Everything else being equal, if the forward P/E were to decline to the 10-year average of 14.4, the ERP would be 4.0%.
Scenario analysis
I conducted scenario analysis to arrive at a downside target using differing assumptions:
- Earnings fall between 20%, 40%, and 50% for one-year.
- The 10-year Treasury yield remains at 2.9%, rises to 4.0%, and 5.0%.
- ERP either remains unchanged, or rises to a level equivalent to a current de-rating of forward P/E to the 10-year average.
The results are summarized in the table below.
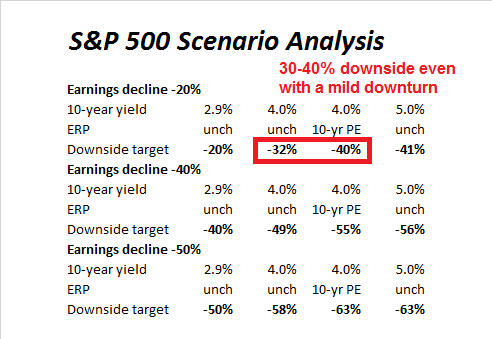
Downside risk varies between -20% to -63% in the worst cases. The unweighted downside average target of all these scenarios is -47%. Even if we were to assume a mild downturn where earnings fall -20%, it is not difficult to arrive at a 30-40% drawdown if the 10-year yield were to rise to 4%.
In conclusion, a reasonable estimate of peak-to-trough downside US equity risk in a recession next year is in the 35% to 45% range. In a rosy scenario, downside risk is limited to 20%, but that would be the most optimistic scenario.
Cam
In this recession, what broad sectors appear to be resilient and possibly provide positive return? Or, the better question, how can I evaluate which sectors will behave more strongly in a recession.
Thanks!
If you are looking for positive absolute returns in equities in a recessionary environment, there aren’t really any foolproof places to hide. Traditionally defensive sectors such as consumer staples, healthcare, interest sensitive sectors such as utilities and REITs will perform better (go down less), but there are no guarantees.
In the current geopolitical environment, aerospace & defense might perform well, but it`s a very small group and there are no guarantees either.
I assume that leaves long-term treasuries as the best option (and inverse ETFs on overbought/weak sectors).
Long UST should perform well, but you should be aware of where the Fed is in its tightening cycle, and what the effects are on the yield curve. The Fed appears to be on a preset course right now, and no one knows what further hikes in the short end might do to the long end, at least in the short run.
Maybe another way to look at it is to note that strong support should come in at the lows of 2015-16 where the support range is 1800 – 2000. Taking an average gives 1900 or roughly a 1000 point drop from the S&P 500 high of 2872. This gives a percentage drop of roughly (1000/2900)*100 = 34.5%
Cam
Thanks for the well written missive. Whilst a decent pullback (50-66%; Fibonacci retracements) may be seen accompanied by recession, let us examine Larry Jeddeloh’s (TIS group) premise that the Trump administration had a base case scenario of cheapening the US $ by 20-25%.
https://www.barrons.com/articles/a-new-era-for-the-market-1533932024
I quote from his article;
“The administration has a two-step approach to trade. Starting on Election Day, the approach was to get the dollar down 20% to 25%. The U.S. dollar index fell 10%, to 89 [in January 2018], but then rallied all the way to 96. I don’t think that was the plan”.
With the recent devaluation of the Yuan, the Trump administration has an even greater incentive to cheapen the US $. Yes, Jamie Dimon’s 4-5% rate on ten year treasury will need a much cheaper $ which would be inflationary. Inflation is possible with further expansion of the money base through QE (not happening) or through further tax cuts, and creating massive budgetary deficits. Now it is true that a rise in ten year treasury rate will have the tendency to strengthen the US $ (See how the US $ is strengthening as the Fed funds rise). That said, if the money base expands through permanent and further tax cuts, the $ may loose value and US stocks may go up further. Could the money base expand? Well, for the first time, we have tax cuts in recent history when US economy was running with full employment and strong GDP. Yes, if the money base does not expand and the US Fed keeps on tightening, yield curve inverts and we are looking at recession, proving Cam’s to be the likely scenario.
The President believes tariffs are adding to government income (they are not; they are likely to be inflationary in the end and act as a tax on America). So, based on presidential decree, we may see even more tariffs. Anything is possible with the recent history of this government (including very large expansion in base money in an attempt to cheapen the $). Unfortunately, Fiscal policy (= politics) does affect markets but I am not trying to politicize this discussion.
It’s hard to see how Trump can get the USD down when there is 1) the Fed is running a tighter monetary policy than other central banks, and 2) the US has a positive growth differential against others.
The Democrats are likely to retake control of the House in November, and fiscal policy is likely to get tighter next year. So fiscal policy is unlikely to weaken the USD.
The Treasury could try intervention, but that only works short term, and you are unlikely to get a 20-25% move in the USD that way.
Cam
You are right, the possibility of a $ weakening here is very low (An extreme event). That said, who would have thought two years ago that a trade war was to happen? Who would have thought Turkey would be targeted in an insignificant political event? The world is turning into a strange place no matter what one says, no matter where one looks (Brexit, Italian Lira tumbling, China and Canada not backing off, An ascendant Russia, trying to finagle its way into Turkey and in the backyard of NATO(!), gold making new lows, etc.). If the $ does not cheapen, a Fed induced recession is a likely event on the horizon. If geopolitics get the upper hand (especially if China goes into a recession), $ strengthens, and we have recession. If we have a real trade war, it leads to a recession. Let us see how long does the music keep playing. So far, the music is still on, the wine is flowing and the night is still young (perhaps), and the party goes on.
Presuming the democrats control the House, we have a grid lock. Not much would change then.
Cam
This is interesting;
https://www.bloomberg.com/news/articles/2018-08-14/fx-traders-are-on-alert-as-u-s-dollar-intervention-risk-climbs
Talk is cheap. Truth is that the US is cornered with high value $, being further magnified by Yuan devaluation and an economy running full steam. with the Federal Reserve on the throat of the bond market, that leaves the US with no option but to weaken the $.
Jesse Felder, of thefelderreport.com, posted some good info about the Hindenburg omen today. Mr Hui was my number one read at seeking alpha.com, before they went to a pay to read format. Thank you for years of great insight about the market(s) Cam.
Hi Cam, from what I read so far the most cited indicator of recession is monetary related (e.g. yield curve inversion, dropping world monetary base, M2 supplies, etc.). Do you think that the potential recession next year are caused by these monetary issues or are these monetary based observations are more of a symptom of a weakening global economy?
To be more clear, I’m asking whether it is the cause or the effect/symptoms. Thanks.
My inclination is to explain it as a symptom, rather than a cause. I look for a series of a symptoms of a pending slowdown.
Within the monetary dimension, money supply growth is decelerating, and the yield curve is flattening.
As for the consumer/household sector, retail sales are holding up well, but housing is slowing rapidly, and housing is the ultimate big ticket consumer item.
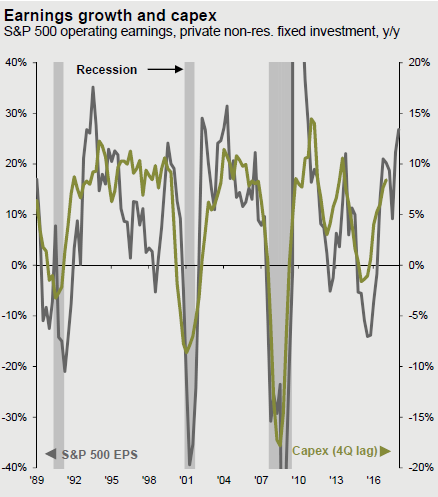
The corporate sector is holding up well. Corporate profits are strong (thank you tax cuts), but corporate bonds yields are starting to show some signs of rising stress.
Venerable analyst Liz Ann Saunders penned a pithy article about how beneath the surface, things are not exactly healthy or at least may turn on a dime. Her basic premise is $ shortage, inflation rearing its ugly head, Trump administration desperately thinking about somehow cheapening the US $ and volatility rearing its ugly head. Here is a link;
https://www.schwab.com/resource-center/insights/content/second-hand-news-facing-second-derivative-economic-inflection-point
All in all, we may be in for a rough ride when it comes to negotiating with China; a trade war could turn into a currency war.