Preface: Explaining our market timing models
We maintain several market timing models, each with differing time horizons. The “Ultimate Market Timing Model” is a long-term market timing model based on the research outlined in our post, Building the ultimate market timing model. This model tends to generate only a handful of signals each decade.
The Trend Model is an asset allocation model which applies trend following principles based on the inputs of global stock and commodity price. This model has a shorter time horizon and tends to turn over about 4-6 times a year. In essence, it seeks to answer the question, “Is the trend in the global economy expansion (bullish) or contraction (bearish)?”
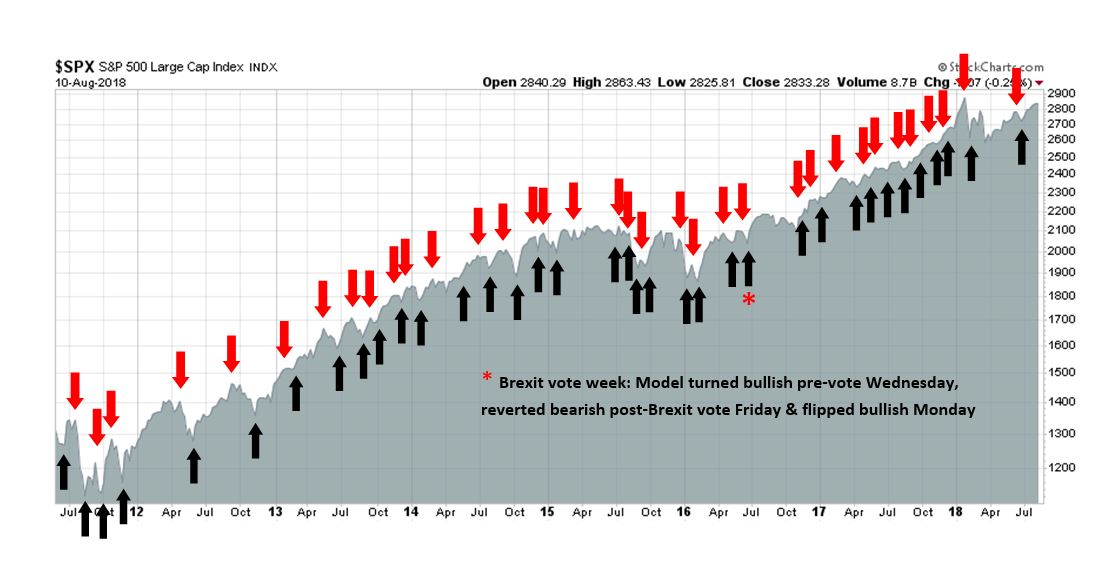
My inner trader uses the trading component of the Trend Model to look for changes in the direction of the main Trend Model signal. A bullish Trend Model signal that gets less bullish is a trading “sell” signal. Conversely, a bearish Trend Model signal that gets less bearish is a trading “buy” signal. The history of actual out-of-sample (not backtested) signals of the trading model are shown by the arrows in the chart below. The turnover rate of the trading model is high, and it has varied between 150% to 200% per month.
Subscribers receive real-time alerts of model changes, and a hypothetical trading record of the those email alerts are updated weekly here. The hypothetical trading record of the trading model of the real-time alerts that began in March 2016 is shown below.

The latest signals of each model are as follows:
- Ultimate market timing model: Buy equities
- Trend Model signal: Neutral
- Trading model: Bullish
Update schedule: I generally update model readings on my site on weekends and tweet mid-week observations at @humblestudent. Subscribers receive real-time alerts of trading model changes, and a hypothetical trading record of the those email alerts is shown here.
More market warnings ahead
I received a lot of feedback from my post last week (see Major market top ahead: My inner investor turns cautious), mostly because it represented a major change in investment outlook. I would like to clarify a point that the post did not represent a sell signal for stocks, but the setup for a sell signal.
In the short run, the market gods have given investors two gifts. First, the evolution of the Turkish Tantrum provides investors a glimpse at what a real EM blow-up might look like in the future, especially if China were to undergo a debt crisis.
In addition, the path of least resistance for stock prices is still up for the next few weeks. Any rally therefore represents a second gift from the market gods. Investors can take the opportunity to lighten up their equity holdings in anticipation of long-term market weakness.
There have been plenty of warnings that US equities are topping out, starting with how monetary policy is affecting both Wall Street and Main Street. The latest Turkish inspired sell-off just provides another point of bearish pressure.
Even before Friday`s market blow-up, the fault lines were starkly revealed when the Deputy Prime Minister of Turkey tweeted a complaint about Fed policy.
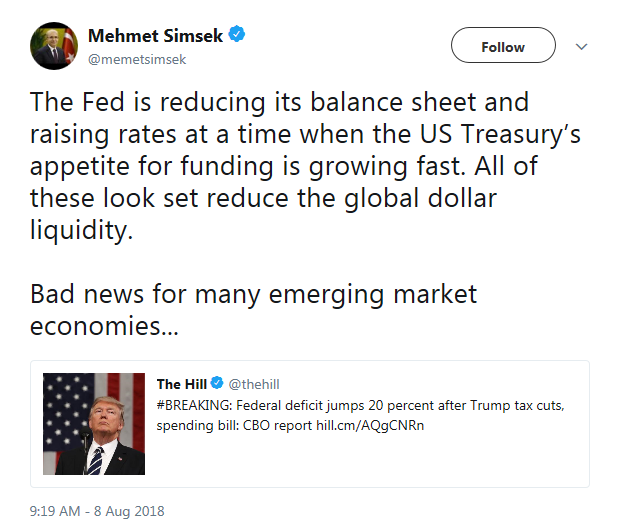
In light of Friday’s above consensus core CPI print, the Fed is likely to stay on their preset course of a quarter point rate hike every three months. Already, the Turkish lira crisis has sparked an upside breakout of the USD Index. If the breakout holds, it will spell trouble in other quarters. In addition to the pressure on other vulnerable EM currencies, a rising USD depresses the Chinese Yuan (CNY) and raise the specter of a currency war.

The Turkish Tantrum as dress rehearsal
My base case scenario for the onset of a bear market is caused by Fed over-tightening, which slows the American economy into recession. But the last tax bill also created incentives for US companies to repatriate offshore funds, which drained liquidity from the offshore dollar market. These factors are combining to raise the stress levels for offshore USD borrowers, and EM borrowers in particular.
Take Turkey as an example. Turkey`s external debt position amounts to 56% of GDP, with most of the exposure from Turkish banks, rather than sovereign debt. CNBC reported that international exposure to Turkey is fairly broad, with some concentrated exposure by European banks in the form of loans, along with some ownership exposure to Turkish banks.
Data from the Bank for International Settlements (BIS) — often called the central bank of central banks — shows that Spanish banks are owed $83.3 billion by Turkish borrowers; French lenders $38.4 billion; and banks in Italy are owed $17 billion. Regulators in Europe are reportedly worried that the weaker currency will lead to defaults in foreign loans…
When asked about the impact of the ongoing troubles in Turkey, Timothy Ash, a senior emerging markets strategist at Bluebay Asset Management, told CNBC via email that “it’s likely mostly banking exposure at this stage.”
However, he added that exposure is “pretty international.” “European, U.S., Japan, China, Middle East — everyone,” he added.
The BIS cross-border figures also show that Japanese banks are owed $14 billion, U.K. lenders $19.2 billion and the United States about $18 billion.

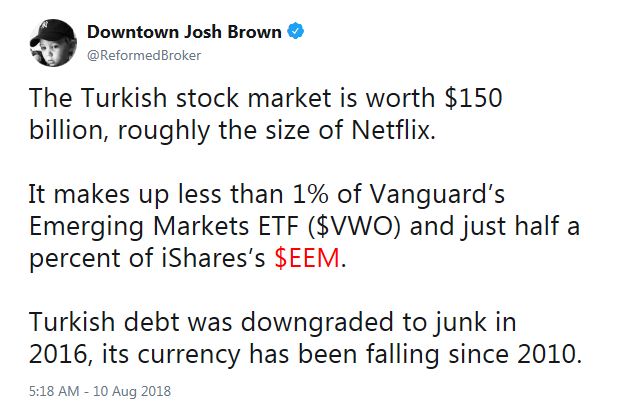
Everyone should take a deep breath and refrain from panicking. Global central bankers have well recognized procedures to deal with minor crises like this one. As Josh Brown pointed out, Turkey is not very important in the grand scheme of things.
However, how the global authorities behave during the Turkish Tantrum will serve as a rehearsal for further EM blow-ups in the future, especially if China were to undergo a debt crisis.
That`s the first gift from the market gods.
An Emerging One Belt One Road debt crisis?
Even if China were to sidestep a debt crisis, debt pressures from its One Belt One Road (OBOR) initiative is likely to cause problems for other EM countries should the global financial system become stressed (see my 2015 post China`s cunning plan to revive growth). A Center for Global Development study found that 23 out of 68 countries identified as potential borrowers in the OBOR Initiative were at a “quite high” risk of debt distress. Already, Sri Lanka made headlines in late 2017 when it ceded control of Hambantota port to China Merchants Port Holdings, a Chinese SOE, because of OBOR debt payment difficulties.
In particular, eight of those 23 countries are at high risk of debt service problems because of OBOR projects. Those countries are Pakistan, Djibouti, the Maldives, Laos, Mongolia, Montenegro, Tajikistan and Kyrgyzstan. The most important country on this list is Pakistan. A recent FT Alphaville article entitled Belt and Road, or Debt Trap? pretty much sums up the story of the initiative. A debt crisis in Pakistan would not only be isolated to that country, but it has wider geopolitical implications for the rest of the world. Pakistan borders Afghanistan and it represents a major supply route for NATO troops engaged in that region. Financial and political turmoil in Pakistan would crate headlines that reverberate around the world.
European fragility
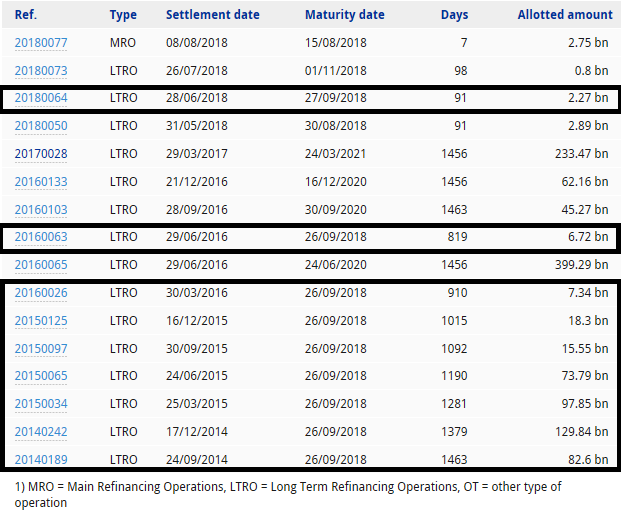
In addition to the exposure of Turkish loans to the European banks, September may see further turmoil in the European credit markets when over €400 LTRO loans come due. While the event may not necessarily affect US markets, it will be a stress point for the eurozone banking system, and serve to highlight the still fragile nature of the European banking system. (As a reminder to clear up any points of confusion, the following table from the ECB specifies dates in the dd/mm/yyyy format).
The Warren Buffett warning
Another implicit market warning comes from Warren Buffett. The Q2 2018 report from Berkshire Hathaway showed that the company’s cash horde had grown to $111 billion. As the chart below also shows, cash levels have bee rising faster than the stock market, which is an indication that Buffett can’t find any bargains.

Less noticed by investors is Berkshire’s sale of its 31% stake in USG, the drywall manufacturer, which Buffett bought at the height of the financial crisis. The transaction raises more questions than answers. Hasn’t Buffett said that his time horizon for his holdings is forever? What is the USG sale telling us about market valuation and the economic cycle?
Indeed, the relative market performance of homebuilders has been tanking. Is the USG sale be a cautionary sign for the housing market?

From a macro perspective, housing starts are beginning to plateau, and may be in the process of rolling over.

Marketwatch also reported that Redfin CEO stated that the housing market had hit a “significant slowdown” in recent weeks:
The housing market hit a sudden and “significant” slowdown in the past few weeks that could continue in coming months, Redfin Corp.’s chief executive said Thursday afternoon…
He said a decline in U.S. home sales in June was expected to reappear in August and September after a slight relief in July, specifically calling out difficulties in markets on the West Coast that have driven home sales higher in the past few years.
“For the first time in years, we are getting reports from managers of some markets that home buyer demand is waning, especially in some of Redfin’s largest markets,” Kelman said, specifically calling out Seattle, Portland and San Jose as areas where inventory was still tight but did not seem to be pushing prices higher still.
“June sales were down in these markets by double-digits and inventory was up also by double-digits,” he said of the West Coast cities. “The trend is continuing in July and reports are now coming in from Washington, D.C.; Boston; Virginia and parts of Chicago as well that homes there are getting harder to sell.”
The housing canary in the coalmine is struggling. What could be next, especially if the Fed were to continue its path of policy normalization?
A Charles Gave recession warning
Another warning came from Charles Gave of Evergreen Gavekal, who issued a global recession alert:
Over the last three months, I have become increasingly concerned that a recession will hit the world economy in 2019. In this paper, I shall explain why. My reasoning is simple and is based on the behavior of an indicator I have long followed, which I call the World Monetary Base, or WMB. Every time in the past that this monetary aggregate has shown a year-on-year decline in real terms, a recession has followed, often accompanied by a flock of “black swans.” And, since the end of March, the WMB has again been in negative territory in year-on-year terms. As a result, and as I shall explain, there is a significant risk of a recession next year.
Before I launch into a detailed examination of my reasoning, I should perhaps recap what the WMB is and why it is so important. It starts with the US Federal Reserve, which, because it controls the dominant reserve currency, acts as de facto central bank to the world. By purchasing government bonds from domestic banks, so flooding them with reserves, the Fed can engineer an increase in the US monetary base.
The Fed also provides “reserves” to other central banks. Typically, this happens when the US dollar is overvalued and/or when the US economy grows faster than the rest of the world. This combination leads to a deterioration in the US current account deficit, which means that the US starts to pump more money abroad. These excess dollars appear first in the hands of foreign private sector companies. But if they earn more than they need for working capital, they sell the excess to their local central banks in exchange for local currency.
As a result, local monetary bases rise, and the surplus US dollars get parked in central bank foreign reserves, where they show up as a line item of the Fed’s balance sheet called “assets held at the Federal Reserve Bank for the account of foreign central banks”. Increases in this item must have as their counterpart increases in the monetary bases of non-US economies (unless foreign central banks sterilize their purchases of US dollars).
So, if I take the US monetary base, and add to it the reserves deposited by foreign central banks at the Fed, I get my figure for the World Monetary Base. From this aggregate, I can get a rough idea of the pace of base money creation around the world, either through direct intervention by the Fed in the US banking system, or indirectly through US dollar accumulation by foreign central banks. When the WMB is growing, I can be relatively confident about the future nominal growth of the global economy. And when it’s contracting, it makes very good sense to worry about a recession.

A contracting world monetary base? USD shortage? Turkish Tantrum? A possible OBOR debt repayment crisis? Ouch!
Gave concluded that a recession may hit as soon as March 2019, which is well ahead of my own forecast of a late 2019 slowdown.
A world-wide recession is looking more and more probable. And if the time lag is similar to those in the past, it could hit by March 2019. Indeed, looking at the performance of markets over the last six months, it looks as if a bear market may have already started everywhere but in the US. As I have written repeatedly in recent months, bears are sneaky animals. Their victims seldom see them coming.
A looming trend following warning
Finally, from a technical perspective, Chris Ciovacco’s trend following model is poised to flash a bearish warning. This model calculates a 30, 40, and 50 week moving on the NYSE Composite. If the shorter moving averages start to roll over and cross over the longer term averages. The latest readings show that the short 30 wma rolling over and it is on the verge of crossing over the 40 wma, which would change market conditions from what Ciovacco describes as “volatility to ignore” to “volatility to respect”. (Note that the SPX is superimposed on the three moving averages, and have no effect on how each of the averages are calculated).

The storm clouds are gathering on the horizon.
Last Hurrah rally still in play
Despite the presence of all these risks, the Last Hurrah scenario remains in play. The latest update from FactSet shows that Q2 earnings season results have been nothing short of spectacular.

While Q2 earnings results may be dismissed as backward looking, Bespoke observed that earnings guidance is still positive, though decelerating. These conditions are supportive of further price gains, and the bears will have to wait for guidance to start rolling over before taking full control of the tape.

In addition, while the monthly price chart that I highlighted last week of the Wilshire 5000 showed a warning of a negative RSI divergence, the MACD histogram has not turned negative (marked by vertical lines). A negative reading on the MACD histogram, combined with negative RSI divergence, would be the definitive sell signal for the market.

In other words, don’t panic just yet. Take advantage this gift from the market gods to lighten up positions on market rallies.
The week ahead
Looking to the week ahead, I wrote in my previous post that the stock market appeared to be extended and it was in need of a rest (see Traders: Market stalling, but buy the dip). I did not expect that jitters over Turkey would be the catalyst for a disorderly sell-off.
In the short run, the market is oversold and poised for a relief rally. Breadth indicators from Index Indicators show an oversold condition over a 1-2 day time horizon.

With the caveat that a small sample size (N=4) may not be very meaningful, the VIX Index spiked on Friday from under 11 to over 13. Oddstats observed that, in past instances, such episodes have been bullish for stock prices.

The market successfully tested a minor trend line on Friday, and it remains in a well-defined rising channel after its upside breakout at 2800. Barring further negative surprises, expect the market to grind upwards and break out to fresh highs in the weeks ahead.

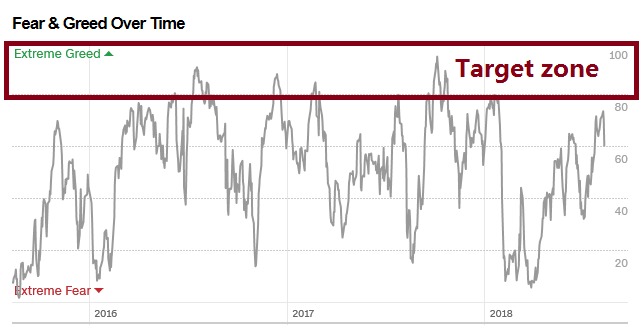
Wait for the Fear and Greed Index to rise above 80 into the target zone before selling.
My inner investor is preparing to lighten his long equity positions should the market rally to new highs. Subscribers received an email alert on Friday that my inner trader had re-entered his long positions in anticipation of higher prices next week.
Disclosure: Long SPXL
Are there not grounds for at least partially excepting the January melt-up from the trend graphs? That would change the divergences and the outlook.
I don’t understand the question. Moving averages measure the trend, and even outliers are part of the trend.
Are you not confusing measurement with reality?
you’re not making much sense.
Stock market is looking toppy, but watch for the Last Hurrah rally, which is an opportunity to sell.
Clear now?
Japan has been used as a deflationary model for how the post GFC economic and stock market cycles will play out in America. After, their 1990 crash, they battled deflation and still are, decades later.
Certainly we’ve seen a zero interest rate policy, a brand new thing here, like they’ve had.
I bring this up because they’ve had three recessions since 1990 without a negative yield curve. Seems a deflationary economic environment is more fragile. That tells me that the current U.S. yield curve is enough to tip Main Street into a recession sooner that most observers think.
Thanks for your input, Ken. I’ve long believed there’s a great deal we can learn from the decades-long troubles in Japan, despite our demographic differences.
Cam
Thanks for this post that hits the nail on its head. Your point about drying up $ liquidity is well taken. There is an absolute carnage going on various overseas bourses, and other asset classes (EM bonds, Currencies like Aussie $, commodities like Gold miners, and Agricultural scrips). Here is a link that shows this decimation in detail.
https://twitter.com/charliebilello
If one had to batten the hatches, assets like Europe and Japan, would be the ones to be liquidated (too late to liquidate Ems, which should not constitute a large part of a portfolio in any case).
Cam, does the recent breakout with the U.S. dollar dampen your recent short term bullish outlook on a gold trade?
Thanks,
Mike
You will recall that I wrote that “all bets are off” on the gold trade if the USD Index decisively breaks out. This pretty much counts as a decisive breakout, though the sentiment backdrop is still supportive of commodity strength/USD weakness. However, I would say that discretion is the better part of valor under these circumstances.
What is your thought that the 10/2 curve has not inverted yet?
any thoughts on this bear trap reports…
https://www.thebeartrapsreport.com/blog/2018/08/10/turkey-credit-risk-rising/
So today, we have surging currency volatility in the CVIX with equities ignoring risk coming down the road. As we witness in 2013, this price action is HIGHLY unsustainable. We expect a SHARP spike in equity volatility in the weeks to come. Currencies have it right.