Preface: Explaining our market timing models
We maintain several market timing models, each with differing time horizons. The “Ultimate Market Timing Model” is a long-term market timing model based on the research outlined in our post, Building the ultimate market timing model. This model tends to generate only a handful of signals each decade.
The Trend Model is an asset allocation model which applies trend following principles based on the inputs of global stock and commodity price. This model has a shorter time horizon and tends to turn over about 4-6 times a year. In essence, it seeks to answer the question, “Is the trend in the global economy expansion (bullish) or contraction (bearish)?”

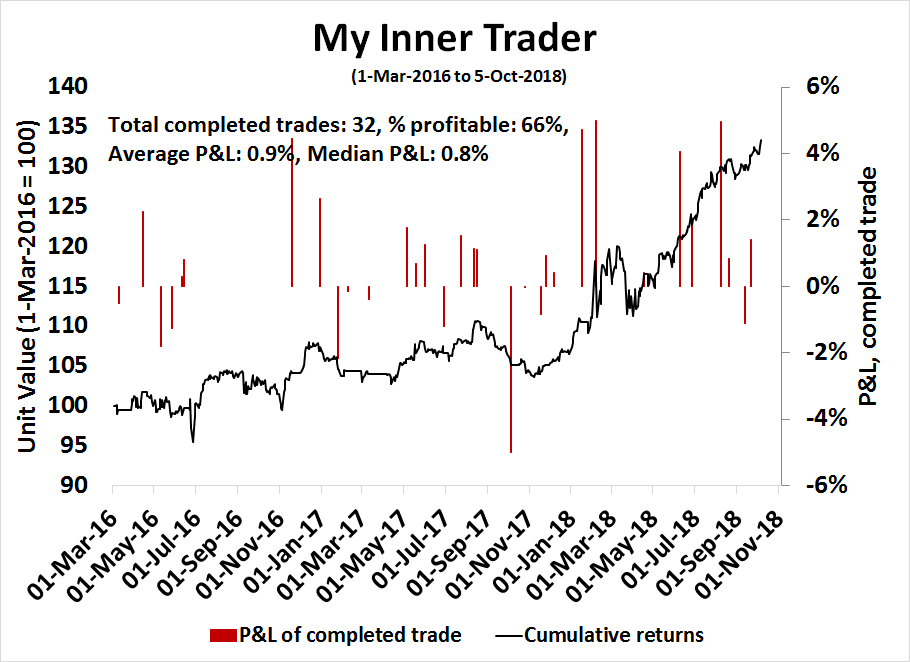
My inner trader uses the trading component of the Trend Model to look for changes in the direction of the main Trend Model signal. A bullish Trend Model signal that gets less bullish is a trading “sell” signal. Conversely, a bearish Trend Model signal that gets less bearish is a trading “buy” signal. The history of actual out-of-sample (not backtested) signals of the trading model are shown by the arrows in the chart below. The turnover rate of the trading model is high, and it has varied between 150% to 200% per month.
Subscribers receive real-time alerts of model changes, and a hypothetical trading record of the those email alerts are updated weekly here. The hypothetical trading record of the trading model of the real-time alerts that began in March 2016 is shown below.
The latest signals of each model are as follows:
- Ultimate market timing model: Buy equities
- Trend Model signal: Neutral
- Trading model: Bearish
Update schedule: I generally update model readings on my site on weekends and tweet mid-week observations at @humblestudent. Subscribers receive real-time alerts of trading model changes, and a hypothetical trading record of the those email alerts is shown here.
The 2020 recession consensus call
In the past few months, there has been a cacophony of voices calling for a recession or significant slowdown in 2020, such as Ben Bernanke (via Bloomberg), and Ray Dalio (via Business Insider). Bloomberg reported that two-thirds of business economists expect a recession by the end of 2020.
To be sure, the American economy is exhibiting behavior consistent with a late cycle expansion. Estimates of the output gap show that both the US and developed economies are running at, or above capacity, which are usually signs that a recession is just around the corner.

How close is the American economy to a recession? I answer that question using the long-leading indicator methodology outlined by New Deal democrat (NDD) in 2015. These indicators are designed to spot a recession about a year in advance, and they are broadly categorized into three groups (my words, not his):
- The consumer or household sector
- The corporate sector
- Monetary conditions
I would add the disclaimer that while the analytical framework comes from NDD, the interpretation of the output is entirely mine.
A mixed message from the consumer sector
Let’s start with some good news. The first indicator of consumer health is solidly green. Retail sales have generally topped out ahead of recessions, and there are no signs of a slowdown.

However, a word of caution is in order. The latest consumer confidence survey shows that the spread between future and current conditions is at an extreme, indicating late cycle conditions. While this is nothing to panic about, it does indicate a higher than usual risk level, but there are no signs of a bearish trigger.

Score retail sales a solid positive.
Another key indicator of consumer health is housing. Not only is housing a highly cyclical barometer of the economy, it is also the biggest-ticket item in consumer durable spending. The outlook for housing is less bright.
The latest figures show that housing starts appear to be topping out. While this data series is highly noisy, and we will undoubtedly see housing permits and starts spike in the months ahead as a result of hurricane related reconstruction, this sector seems to have topped for the cycle.

Similarly, real private residential investment also looks toppy.

New Deal democrat recently wrote a comprehensive review of housing and concluded:
In summary, mindful of the fact that there is some conflicting evidence, the large preponderance of evidence leads me not to expect any significant new highs in home sales for the rest of this year, and more likely than not, sales will continue to stagnate or decline.
Further, if this situation persists one more month, and if both the last remaining positive – housing starts – and the neutral indicator of quarterly private residential investment in the GDP roll over, then the long leading indicator of the housing market will be firmly negative.
The verdict from the stock market is equally negative. The relative performance of the homebuilding stocks is in free fall.

The ratio of lumber to the CRB Index, which shows the cyclicality of the price of a key building material while filtering out the commodity element, has also fallen dramatically.

Score housing as a mild negative.
The corporate sector wobbles
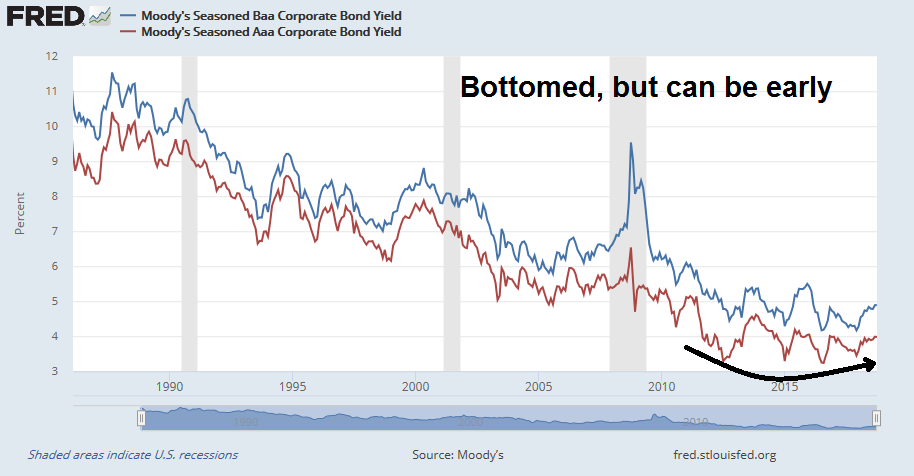
The outlook for the corporate sector has also been dimming. In the past, corporate bond yields have bottomed well ahead of recessions. but this indicator can be a few years early. Nevertheless, Aaa yields bottomed out in July 2016, and Baa yields made a double bottom in July 2016 and December 2017.
NIPA corporate profits deflated by unit labor costs have historically topped out ahead of past recessions. This is another key indicator used by Geoffrey Moore in his forecasting. This indicator topped out in 2014.

One difficulty with the use of corporate profits as a long-leading indicator is the delays with its release. NDD has used proprietors’ income as a more timely proxy for corporate profits. This indicator has also topped out, regardless of whether it is normalized by unit labor costs, or inflation.

Score the corporate sector indicators as negatives.
Long leading indicators: Monetary indicators
In his speech on October 2, 2018, Fed Chair Jerome Powell said in so many words that the Fed plans on steadily raising rates:
This historically rare pairing of steady, low inflation and very low unemployment is testament to the fact that we remain in extraordinary times. Our ongoing policy of gradual interest rate normalization reflects our efforts to balance the inevitable risks that come with extraordinary times, so as to extend the current expansion, while maintaining maximum employment and low and stable inflation.
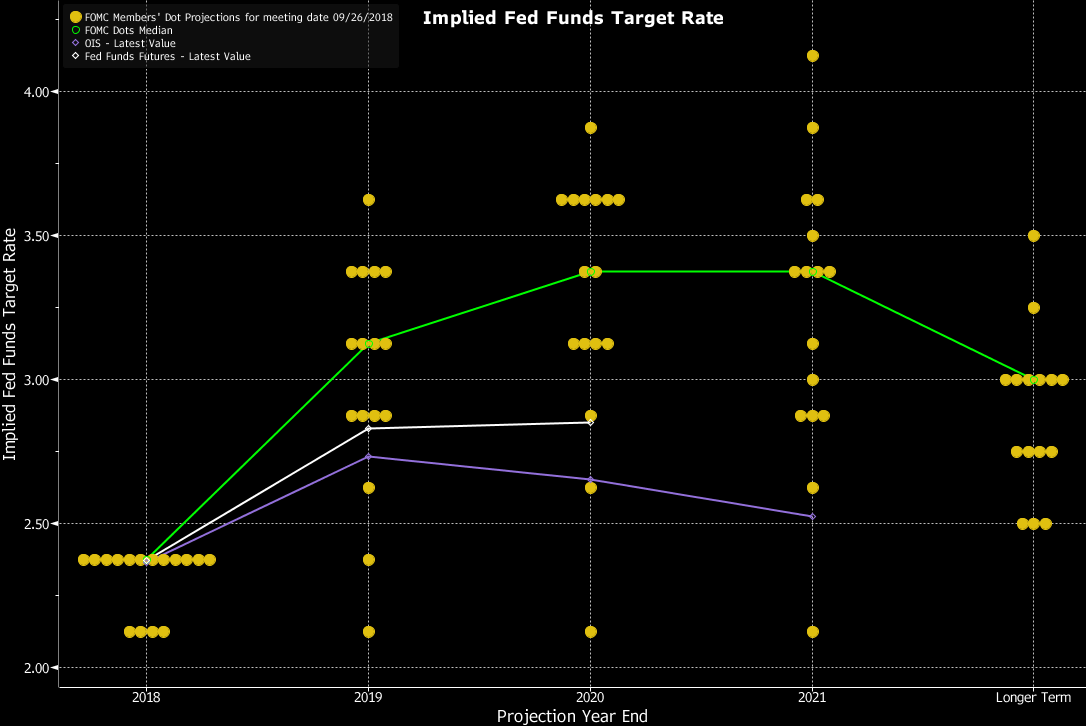
Powell adopted a hawkish tone in the post-speech Q&A, “We are a long way from neutral, probably.” That is another indication that the Fed will be persistent in hiking rates, and the market should not expect any pause of its tightening in the near future. More worrisome is the market`s continuing disbelief of the Fed`s hawkish message. The chart below shows the “dot plot”. Both the market derived Fed Funds futures (white line) and Overnight Index Swap (purple line) are below the Fed’s median Fed Funds projections (green line).
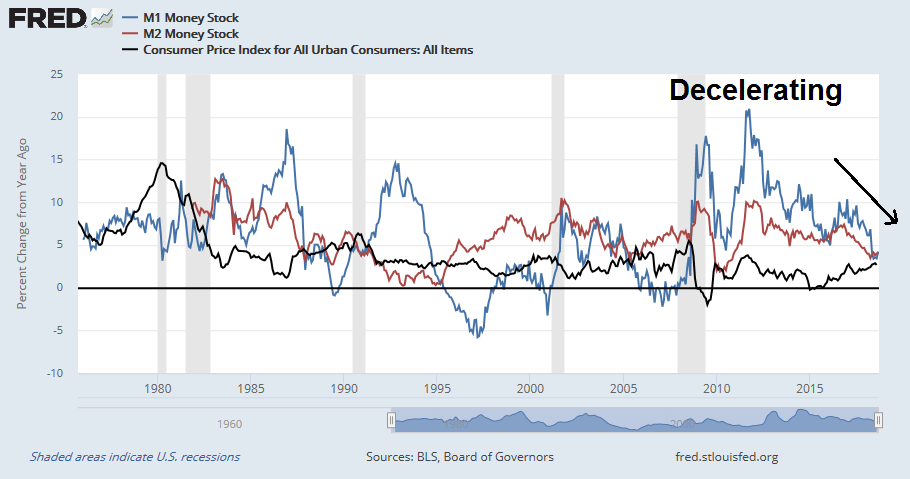
Under these circumstances, it is important to keep an eye on the long-leading monetary indicators. First, the combination of rate normalization and quantitative tightening is showing up in monetary growth. In the past, either real year-over-year M1 or M2 has turned negative ahead of recessions. Currently, money supply growth is decelerating rapidly, though readings are not negative yet. While I do not generally anticipate model readings, real money supply growth is likely to turn negative in Q4 if they continue to decelerate at the current rate.
The shape of the yield curve is a classic leading indicator of recession. The market has been transfixed by the 2s10s Treasury curve (blue line), which had been flattening until last week. Still, the curve is not in the danger zone as it is not inverted yet. There has been some criticism of the usefulness of the 2s10s curve because of the Fed’s past quantitative easing programs that has distorted the yield curve. Bloomberg highlighted analysis from Gavekal indicating the private market yield curve (red line), defined as the Baa corporate bond yield minus the prime rate, has already inverted. The historical evidence shows that private market yield curve inversions have led the Treasury 2s10s curve, and its signals have been noisier.


These indicators make up the full suite of long-leading indicators outlined by NDD in his original post. In later versions, he added financial conditions to his list. One of the causes of recessions is a credit crunch that slows economic activity. While NDD uses the financial stress indices produced by the Chicago and St. Louis Fed, whose readings are benign, I prefer to monitor corporate bond spreads. Currently, bond spreads are sending a mixed message to investors. While high yield, or junk, bond spreads are at cycle lows, investment grade and emerging market spreads are starting to widen. None exhibit signs of high financial stress.
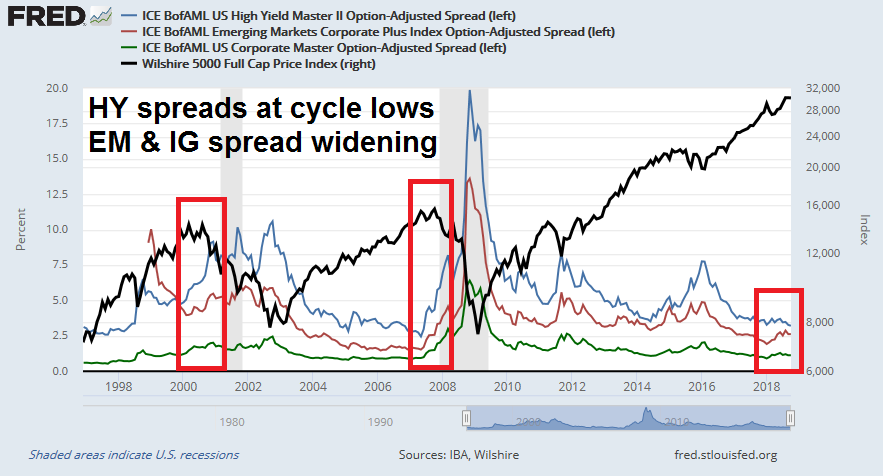
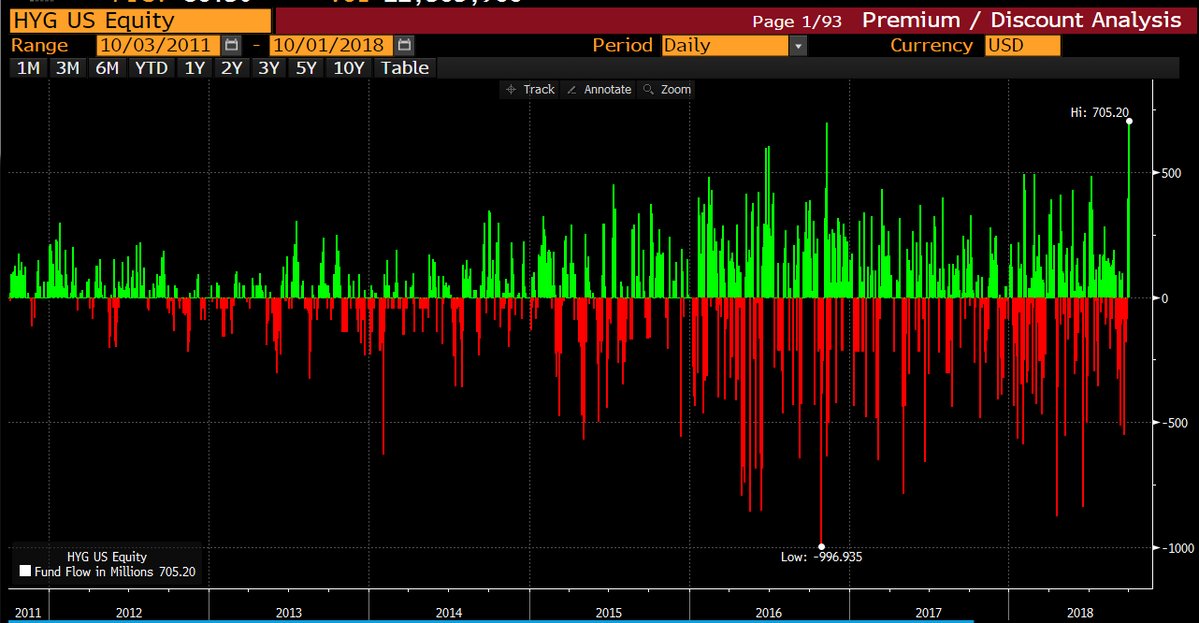
In fact, the high yield ETF (HYG) reported its highest ever single day inflow ever last week. While investors may interpret this as a contrarian sign of excessive exuberance, there are no immediate indications of financial stress.
Score the monetary indicators as neutral to slightly positive.
Investment implications
After that review, where does that leave our recession model? Conditions are neutral to slightly negative, and deteriorating. These readings are not enough to make a recession call yet, but if the pace of deterioration continues at the current rate, the models will flash a recession warning by the end of the year, which translates into the start of a recession in late 2019 or early 2020.
The technical message from the market tells a similar story. In late August, I warned about a bearish setup by highlighting a negative monthly RSI divergence (see 10 or more technical reasons to be bearish on stocks). While the negative RSI divergence represented a bearish setup, past divergences were accompanied by a MACD sell signal (bottom panel), which has not occurred yet.

However, I would caution that the lack of a MACD sell signal from the major US equity indices does not mean that the bulls can sound the all-clear siren. Global markets already flashed a monthly MACD in July. Historically, US and global equities have moved closely together, but the US has been significantly since April (top panel).

I interpret these conditions as signals to exercise a high degree of caution. While conventional economic analysis projects a possible recession in late 2019 or 2020, the risk is a recession gets pulled forward because of the trade war. I already pointed out that the US and China are locked into a trade war (see Quantifying the fallout from a full-scale trade war). Already, global PMIs are falling, and the PMI export orders index has fallen below 50, indicating global trade is falling for the first time in two years.

As well, last week`s Medium article which discusses the issues involved), sufficient uncertainty will be raised to have a chilling effect as Chinese vendors market their 5G technology. As well, it will have an impact on the supply chain decisions made by multi-nationals.
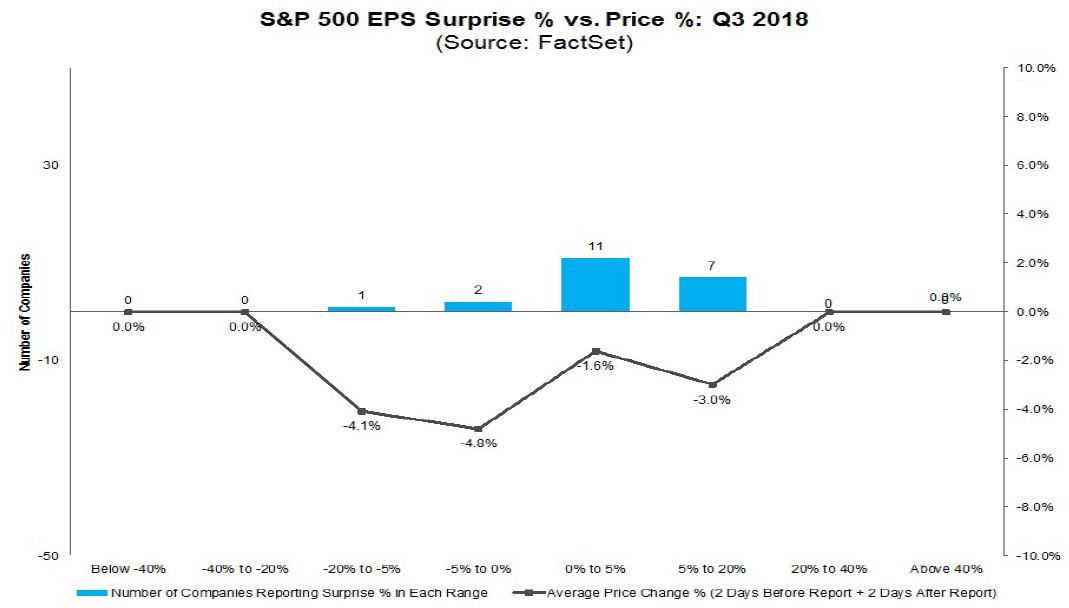
In addition, US equity investors may see some disappointment in the upcoming Q3 earnings season. Bloomberg reported that Q3 negative guidance is outpacing positive guidance by 8-1.

On the other hand, FactSet reported that the pace of Q4 estimate revisions, while negative, is still above average. This suggests that expectations are still too high, and investors have to be prepared for disappointment as earnings season proceeds.

In conclusion, the odds of a recession are rising. The lights on my recession indicator panel are not red, but they are flickering. In addition, recession risks are rising because of the looming trade war. Technical conditions are also reflective of these risks. Investors should therefore adopt a cautious view of equities.
The week ahead: A shallow or deep correction?
Looking to the week ahead…I told you so!
I have been tactically cautious on the stock market for several weeks. My inner trade took profits in his long positions and shorted the market on September 21, 2018 (see My inner trader). Stock prices finally cracked last week. The only question now is, “Is this a shallow or deep correction?”
At a minimum, we know a pullback is underway. All past corrections has seen the VIX spike above its upper Bollinger Band (BB), which occurred last Friday. If this is a shallow correction, expect it to consolidate at or about its 50 dma or lower BB.
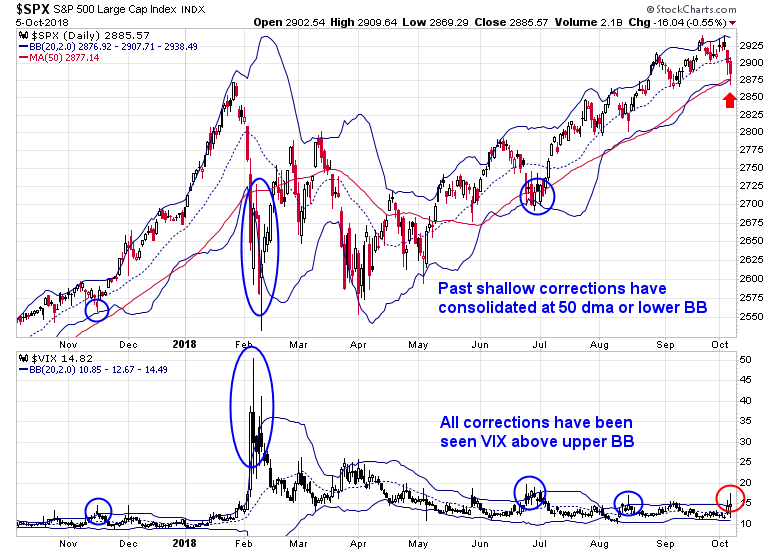
The S&P 500 tested its 50 dma at the lows of the day last Friday and bounced. However, much technical damage has been done as it violated a key uptrend line, which suggests that a deeper correction may be on the horizon. The market action of the NASDAQ 100, which had been a market leader, confirms the deeper correction hypothesis, as it decisively violated its 50 dma.

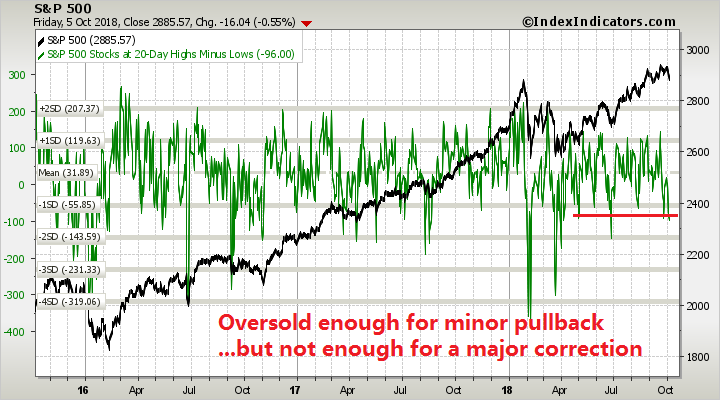
Breadth indicators from Index Indicators show that the market is oversold on a short-term basis and may be due for a bounce.

Longer term (1-2 week time horizon) breadth is also telling a similar story of an oversold market, but oversold markets can get even more oversold.
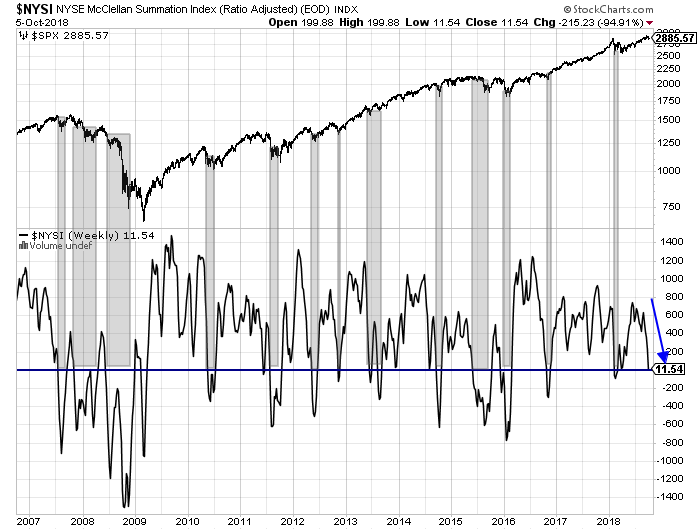
Longer term breadth indicators are supportive of the deeper correction scenario. Urban Carmel pointed out that, in the past, whenever the NYSE Summation Index (NYSI) has fallen below 0, the $SPX has suffered a drawdown of at least 5%. While NYSI did not close below 0 on Friday, it is very, very close. However, the chart below shows that NYSI is not a leading indicator of market weakness, but it is coincident with stock prices. It is therefore more useful as a guide to the magnitude of a pullback than its timing.
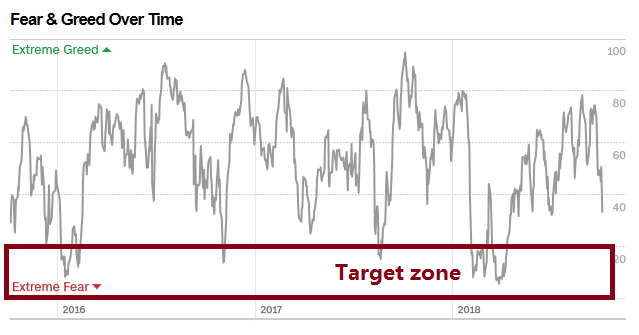
As well, sentiment has not fully panicked yet. None of the components in my Trifecta Bottom Spotting Model has flashed a buy signal. The term structure of the VIX has not inverted; TRIN has not spiked above 2, which is an indication of a “margin clerk market” characterized by price insensitive selling; nor has the medium-term overbought/oversold model moved into oversold territory. These conditions suggest that the market needs a final capitulation before the low is in.

Similarly, the Fear and Greed Index fell to 33 Friday, which is a depressed level but inconsistent with the sub-20 readings seen at a washout bottom.
From a technical perspective, I would expect a minor relief rally to begin early in the week. We will be able to better gauge the character if this pullback on a re-test of the lows. In the past year, shallow corrections have consolidated before prices have turned up.
From a fundamental perspective, much depends on the market reaction to Q3 earnings season. As I pointed out, we are entering earnings season with a higher than average level of negative guidance, but a lower than average level of Q4 EPS downgrades. Such a combination is a setup for disappointment. Keep an eye out for how the market reactions to beats and misses.
Another key indicator is to watch is the 10-year Treasury yield (TNX). The market has been spooked by rising bond yields, and TNX is approaching trend line resistance at just under 3.3%. Watch if the trend line holds.

My inner investor is cautious on the equity outlook, and he is underweight stocks relative to targets. My inner trader is maintaining his short positions, and he may short further into any rally that materializes next week.
Disclosure: Long SPXU
Agree, my Picasso LT composite cycle has been suggesting a high in either the Spring or Fall of 2019 for some time now. This would then be about 6-12 months before your suggested 2020 recession. The market is usually a leading indicator for recessions. 2019, so far, looks like a Spring high, Summer low and a Fall high. Also the 2019 high follows the decennial cycle.
Cam, keep up the good work. I enjoy reading your commentary and charts!
I believe we are in a similar market environment like 2015. There we had a deep recession and bear markets in their companies’ stocks in the energy and commodity producing industries accompanied by bear markets in ever country outside the US. Although the S&P 500 and NASDAQ didn’t fall the required 20% it was a rough ride. There was a deep, surprise dive in August 2015 and markets bottomed in early 2016 when commodity prices started to recover.
At the time I said a bear market had ended and a new bull market started that would go up for two years or more. Most forecasters were saying the markets had been going up for seven years and we’re ready to fall. A few others said there had been a bear that ended in early 2016. Here is a good article that discusses this.
https://www.nytimes.com/2018/09/29/upshot/mini-recession-2016-little-known-big-impact.html
Today we have a recession in housing and autos, two interest rate sensitive sectors.
Rosenberg has done a deep dive into US real estate leading statistics and concluded we are in a recession there now that will get worse with rising rates as per the Fed Dot Plots.
Here is the latest projection of Fed Funds at the end of 2019. There has been a big jump recently.
https://product.datastream.com/dscharting/gateway.aspx?guid=b7ec9234-f31b-4931-89e1-1040262ad80a&action=REFRESH
Similar to 2015, we have international markets heading for or already in bear markets.
I don’t know whether the S&P 500 will decline the 20% for an official bear markybut I believe rough times are ahead NOW, not in 2019. Rough enough that people will look back and wished they’d have missed it.
Ken,
I did read that article and thought of you. You had been saying about bear markets in certain sectors and not others. Also, I remember at the same time you coming up with your “lower for longer” call.
Also, I do feel like,” the rough times are ahead NOW”, is true. I am worried about 1st half of 2019.
Thanks again for all your contributions here.
–Mohit
Yes Mohit, ‘Lower for Longer’ was a key element in start of the new bull market in February 11th 2016. The Fed had raised rates for the first time in eight years and forecasters said long term interest rates would soar. Instead bond yields fell, not just a little but a lot. This removed a huge worry about what would happen when the Fed started towards normalization of rates.
But here we are at a different turning point, the Fed has stated that the are ‘far from neutral rates’. That is Fedspeak for ‘expect much higher interest rates ahead.”. This at a time when interest rate sensitive industries are already showing obvious signs of duress.
The completely, economically wrong tax cut when the American economy was flying, let’s the inflation genie out of the bottle and a new era if interest rates’higher for longer.’. This is so obviously a huge negative to a highly indebted world and American corporate culture that knowledgeable investors will act to reduce risk sooner than expected. That means NOW.
Ken,
I hear you about the Fed regime change. And that’s why when speaking to you in the past, I raised close to 30% in cash. This way, I might not get every bit of the last pennies in profit, but I won’t be crying as much if the markets take a nose dive.
Like Cam and others have mentioned here earlier, “How many pennies can you pick up in front of the steam roller?”
Agreed on Completely wrong tax cut. That’s going to create a huge hangover.
Shallow or deep? Inexactly: when the S&P500 passes the AD line on the way down, the drop will be half way.
Thanks for the great posts Cam. I was likely wrong about China bottoming. It helped to look at a monthly stack of spx hsi ssec. I was thinking they were poorly coorelated. The monthly shows they are highly coorelated. I added aord and the dax to the stack. All these indices are either leading the US to the downside or the US is leading to the upside. The depth of the current declines will answer that question. If the European debt bomb goes off, it’s hard down. DB doesn’t look good.
A prayer for the bears.
Now I lay me down to sleep,
My bearish bets I hope to keep,
Foremost in my bearish dreams,
The 3 of 3 while the vix screams,
When I awake to Joe and Becky’s talk,
I pray dear lord make folks sell stock.
Amen