Mid-week market update: The Dow has made another record high. Most technical analysts would interpret such a development bullishly as there is nothing more bullish than a stock or index making a new all-time high. However, there is the nagging problem of poor breadth.
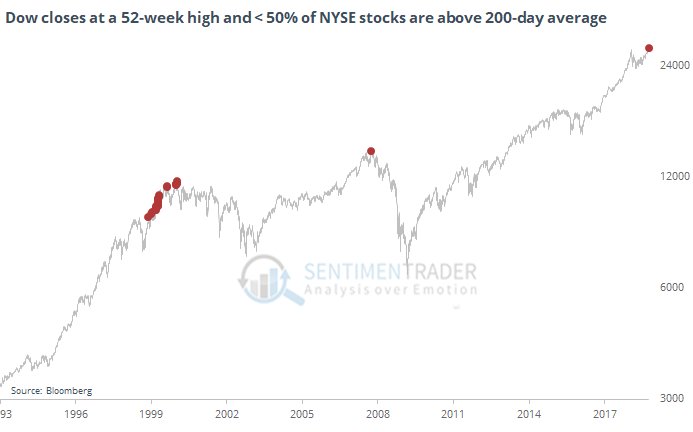
In the past few weeks, I have been warning about the precarious technical condition of the stock market. On Monday, I wrote about the narrowing Bollinger Band of the VIX Index, which is a sign of complacency, and the pattern of declining new highs on both NYSE and NASDAQ stocks even as the market advanced to all-time highs (see The calm before the storm?). The negative breadth divergence has gotten so that that it has prompted analysts like SentimenTrader to point out the ominous historical parallels with the Tech Bubble top.
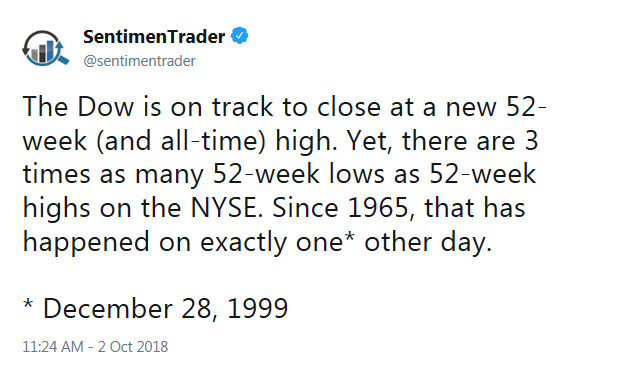
He also highlighted the historical record of poor breadth when the DJIA made a new high.
Rather than obsess endless about the negative breadth divergence, I examined performance market cap, style, or factor, rotation. The analysis yielded some surprising answers, and laid out the challenges for the bulls and bears.
The clues from market cap analysis
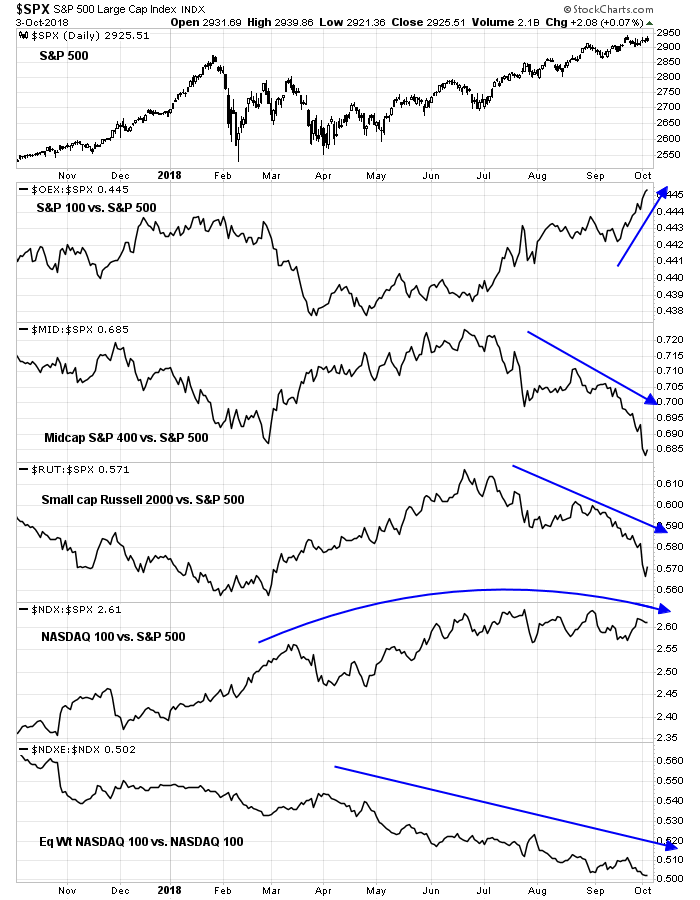
First, an analysis of relative performance by market cap tells the story of narrow leadership. As the chart below shows, the market leaders are the S&P 100 megacap stocks. Both mid and small cap relative performance have rolled over badly. Even the NASDAQ 100, which had been market leaders, has flattened out compared to the S&P 500. A comparison of the equal weighted to cap weighted NASDAQ 100 tells a similar story (bottom panel). The equal weighted index has been steadily underperforming its cap weighted counterpart for at least a year.
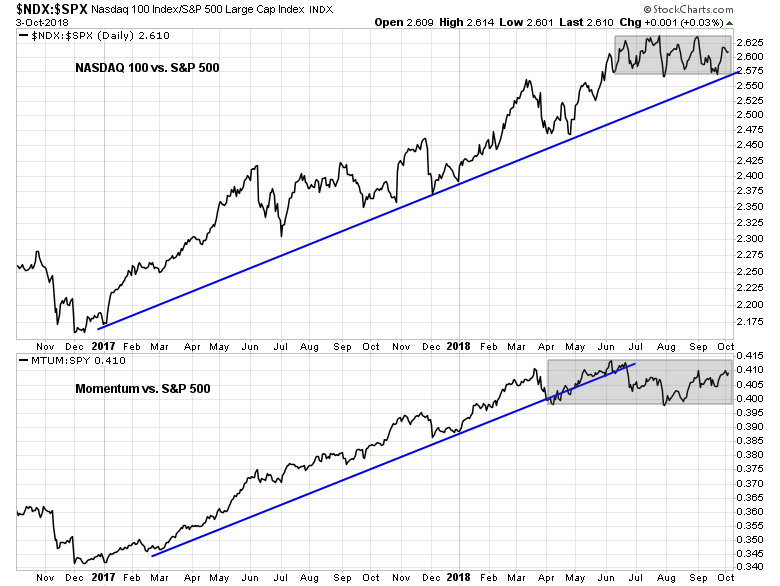
The relative performance of the NASDAQ 100 and the price momentum factor (bottom panel) illustrates the challenges facing the bulls. While the NASDAQ 100 remains in a relative uptrend, it has been consolidating sideways for several months. As well, price momentum breached its relative uptrend in June and it also displayed a similar consolidation pattern.
Does that mean the market is destined to correct sharply? Not so fast. An analysis of style, or factor, rotation reveals a ray of hope for the bulls.
The clues from style rotation
I use the Relative Rotation Graphs, or RRG chart, as the primary tool for the analysis of sector and style leadership. As an explanation, RRG charts are a way of depicting the changes in leadership in different groups, such as sectors, countries or regions, or market factors. The charts are organized into four quadrants. The typical group rotation pattern occurs in a clockwise fashion. Leading groups (top right) deteriorate to weakening groups (bottom right), which then rotates to lagging groups (bottom left), which changes to improving groups (top left), and finally completes the cycle by improving to leading groups (top right) again.
The RRG chart below shows how market leadership has developed when viewed through a style, or factor, prism. The top half of the chart, which consists of improving and leading groups, are mainly composed of defensive or value styles, such as high quality, consistent dividend growth, and large cap value. The bottom half of the chart, which is made up of lagging and weakening groups, are composed of high-octane styles such as IPOs, high beta, small caps, and growth. These are not surprising results in light of the current environment of deteriorating breadth.
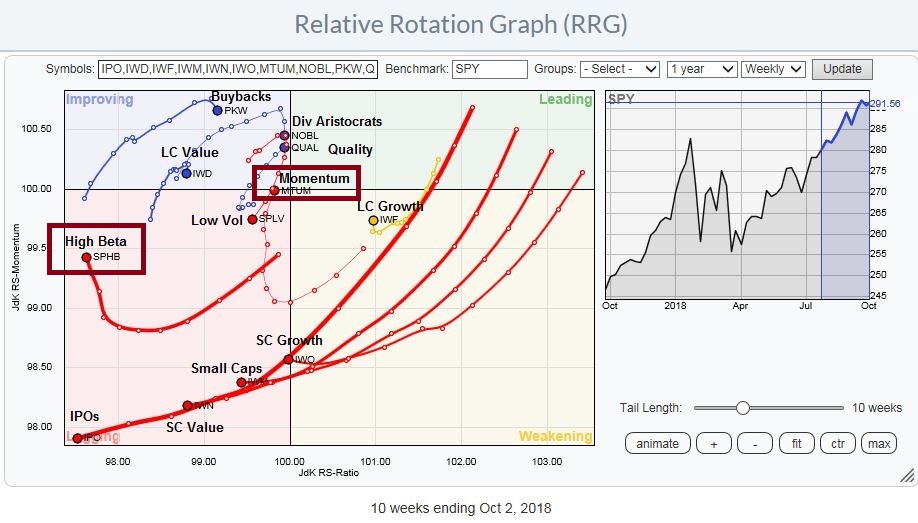
But wait! There an anomaly on this chart that stand out. The price momentum factor is on the verge of moving from the lagging to improving quadrant. As well, high beta stocks appear to be poised to see a similar upgrade in the next few weeks.
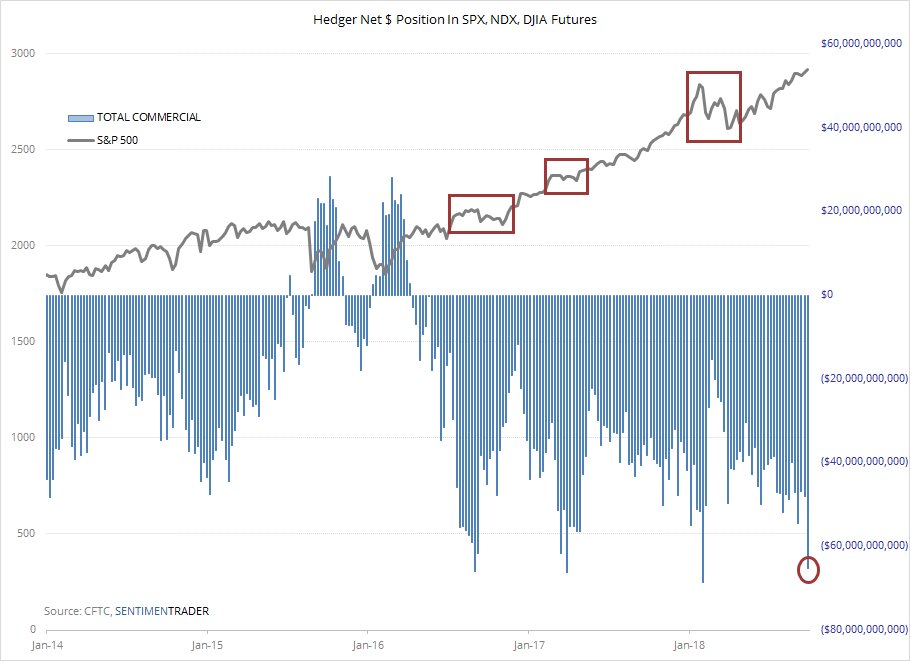
These conditions define the challenges for the bulls and bears. SentimenTrader recently pointed out that futures hedges (aka the smart money) has moved to a historically high short position in SPX, NASDAQ, and DJIA futures. Past episodes has seen stock prices either stall out or correct.
Will the market correct, or just flatten out? Here is how style and factor analysis can yield some clues. If price momentum and high beta can continue to improve, then any pullback is likely to be shallow and brief. On the other hand, if these factors were to weaken from current levels, then expect a deeper correction. Readers who want to follow along at home can use this link to monitor the real-time progress of these factors.
My inner trader concludes from this analysis that the payoff is asymmetric. The directional bias is tilted to the downside and upside potential is limited at current levels. He therefore remains short the market.
Disclosure: Long SPXU