Notwithstanding today’s NAFTA USMCA driven reflex rally today, one puzzle to this market is the remarkable level of complacency in the face of potential market moving events, such as a trade war.
From a technical perspective, complacency can be seen through the historically low level of weekly Bollinger Band on the VIX Index, which has foreshadowed volatility spikes (h/t Andrew Thrasher). The chart below depicts the 10-year history of this indicator. While the sample size is small (N=5), four of the five past instances have seen market corrections (red vertical lines). The only exception occurred when the stock market had already weakened. When combined with episodes of low levels of NYSE and NASDAQ new highs, which is the case today, the outlook is particularly worrisome.

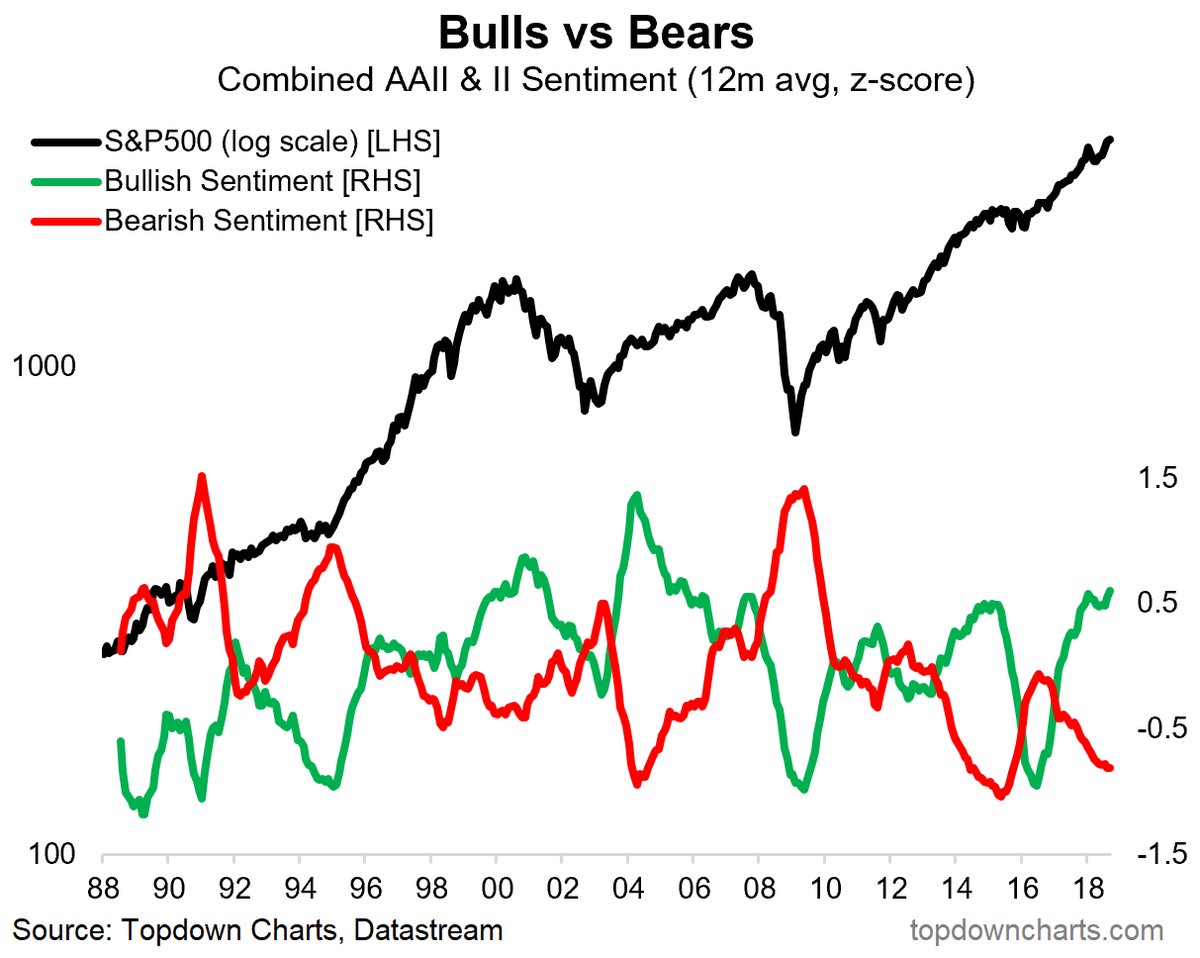
Another way of measuring complacency is through investor sentiment. Currently, bullish sentiment is elevated but not extreme. Callum Thomas of Topdown Charts combined AAII and II sentiment in a single metric, which shows equity sentiment at historically bullish levels, but they were higher at previous major market peaks.
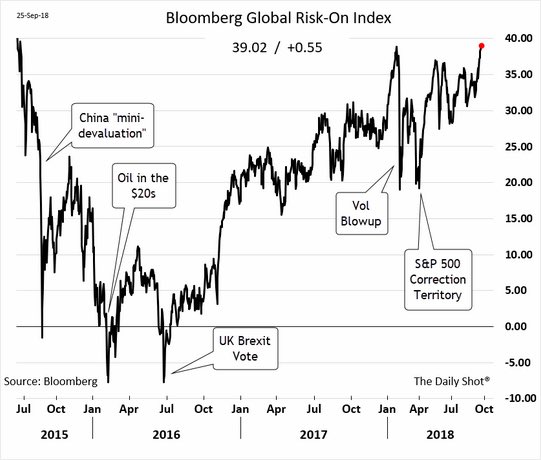
Similarly, the Bloomberg Global Risk-On has not seen such levels of bullishness since 2015.
My former Merrill Lynch colleague Walter Murphy recently characterized this market as “9th inning, two outs”.
All we need to jolt the market out of its complacency is a bearish catalyst. There are several candidates for the triggers of a volatility spike.
A search for the bearish trigger
First, we have not seen the tariff retaliation from China, which could spook markets. The SCMP reported that flight bookings from China to the US for the Golden Week holidays is down a dramatic 42% from last year:
Chinese tourism to the United States is set to fall in next week’s National Day holidays, with flight bookings down and analysts saying numbers for the year are slowing as political tensions accelerate.
There has been a dramatic 42 per cent decrease in flight bookings from China to the US in next week’s holidays – known as “golden week” – compared with last year’s holiday week, according to travel fare search engine Skyscanner. Last year’s holiday period was one day longer.
The first three quarters of 2018 have seen a 16.7 per cent drop in flight bookings from China to the US, its figures show.
The fall in travel to the US is not attributable to a slowdown in growth. Aggregate Chinese tourism spending continues to rise, but they are avoiding the US:
Overall, Chinese outbound travel worldwide stayed strong, growing at 5.5 per cent from the previous year, the ForwardKeys study found, based on 2018 data compiled from global airline booking databases.
“It looks like a trend,” said ForwardKeys spokesman David Tarsh, who predicts harm to the US economy caused by a downturn in Chinese tourism could reach half a billion dollars.
“The US runs a US$28 billion travel and tourism trade surplus with China,” said Jonathan Grella, spokesman at the US Travel Association, a Washington-based non-profit representing and advocating for the travel industry.
“The source of our concern is that these trade tensions could end up upsetting an economic dynamic that is really working for America right now,” Grella said, adding that the US$28 billion was calculated by the travel association using consumer spending data.
In addition, Chinese growth is slowing again. The New York Times reported that the authorities are instituting a clampdown on bad economic news. The imposition of administrative measures suggests that Beijing may not resort to the usual policy of fiscal stimulus as it had in the past (which I warned about in Is China ready for the next downturn?).
A government directive sent to journalists in China on Friday named six economic topics to be “managed,” according to a copy of the order that was reviewed by The New York Times.
The list of topics includes:
- Worse-than-expected data that could show the economy is slowing.
- Local government debt risks.
- The impact of the trade war with the United States.
- Signs of declining consumer confidence
- The risks of stagflation, or rising prices coupled with slowing economic growth
- “Hot-button issues to show the difficulties of people’s lives.”
The government’s new directive betrays a mounting anxiety among Chinese leaders that the country could be heading into a growing economic slump. Even before the trade war between the United States and China, residents of the world’s second-largest economy were showing signs of keeping a tight grip on their wallets. Industrial profit growth has slowed for four consecutive months, and China’s stock market is near its lowest level in four years.
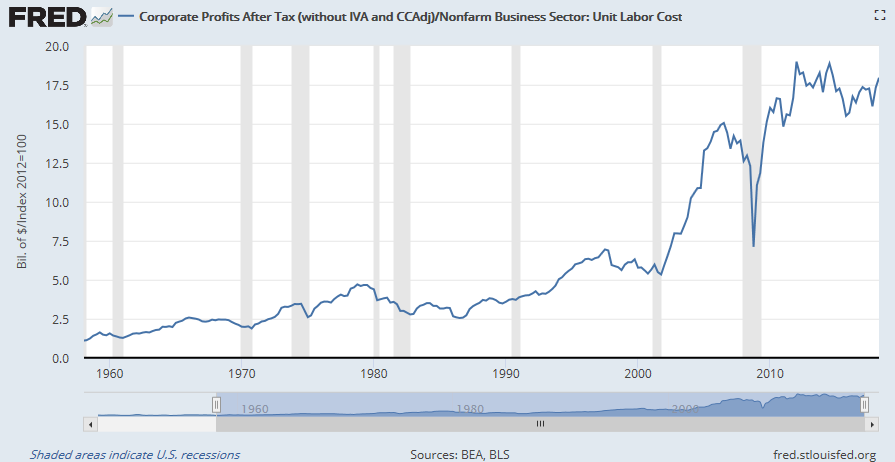
Back in the US, Wall Street does not appear to have factored in rising labor costs in their estimates. The latest consensus estimates of profit margins for 2018-2020 are 11.9%, 12.5%, and 13.2% respectively.
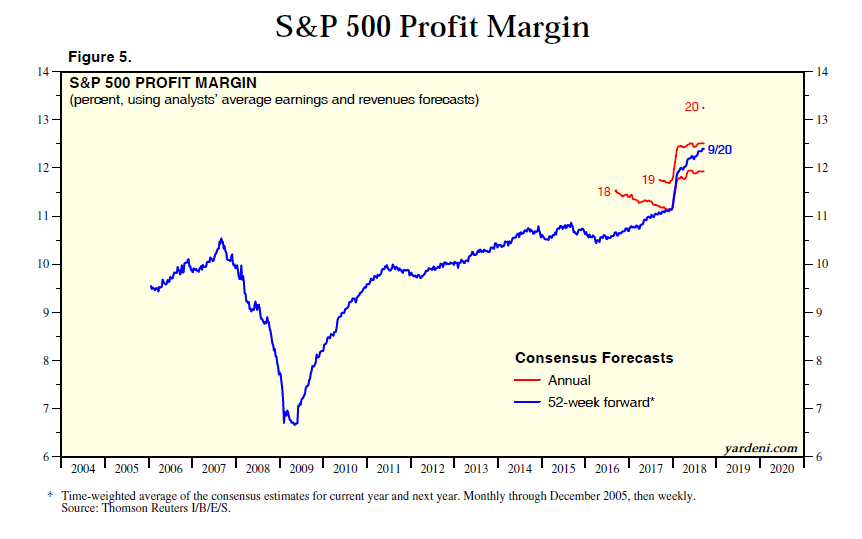
These margin projections fly in the face of the steady rise in labor costs, as measured by average hourly earnings. It appears that Wall Street analysts didn’t get the memo that rising labor costs will put downward pressure on operating margins. They are assuming that companies will be able to pass through price increases, which does not seem plausible in a highly competitive operating environment. We can already see that NIPA corporate profits deflated by unit labor costs have peaked. Past peaks have been recession warnings in previous cycles.
As we approach Q3 earnings season, FactSet reports that the level of negative pre-announcements has spiked to above average levels. At the same time, forward EPS revisions flattened out last week after a prolonged rise. This could either be a data blip, or the start of a series of downward estimate revisions. As stock prices have moved coincidentally with forward EPS estimates, this development is a potentially bearish development. Regardless, these conditions could set up a period of corrective market action sparked by earnings disappointment, or downward EPS revisions due to negative Q4 guidance.

Lastly, the midterm elections are about a month away. The latest forecast from FiveThirtyEight shows that the Democrats have a 4 in 5 chance of taking control of the House, and a 1 in 3 chance of controlling the Senate. Lost in the discussion from market analysts are the fiscal implications of such a political shift.
Expect more questions of, “if you want _____, how will you pay for it?” (insert your favorite partisan initiative such as “tax cut”, “Space Force”, or “Medicare for All” into the blank). In all likelihood, fiscal policy will become either neutral or tighter under the split control of the White House and Congress. As the sugar high from the 2017 tax cut bill begins to fade, the economy will face both tighter fiscal and monetary policy, which is an outcome that few Street analysts have discussed.
Disclosure: Long SPXU
Cam I’ve heard and seen several posts of late pertaining to the Hindenburg Omen- more new lows than highs while an index makes new highs. Maybe even seen you post that recently.
Today I saw a strategists comments that this was a result of Bond ETF’s and inverse ETF’s; have you seen or have a chart with stock only data regarding ne highs/lows?
Try this chart. The lower panel is S&P 1500 new highs/lows %, which are all common stocks
https://stockcharts.com/h-sc/ui?s=%24SPX&p=D&yr=2&mn=0&dy=0&id=p44230983237
Cam, do you assess any truth to the rumor that the central bank has found that the best way to keep the country happy and spending is to have the member banks buy futures on the major indices at key times, especially to make it appear that we have no concerns over the tariffs ?
Perhaps the Russell 2000 is a meaningful index ?
I haven’t heard that rumor but the only way such an scheme could work operationally is in a place like China where the banks are state owned. Otherwise banks owned by public shareholders have to answer to their boards and shareholders in the way they deploy capital.
There is a post from July showing buybacks and the SMI. What I find interesting is that in 2000 there was little change in buybacks, in 2008 after a prolonged surge in buybacks, they crashed and the S&P also crashed more sharply than in 2000. So now we have had an even bigger surge in buybacks. Well they can’t keep increasing forever can they? I wonder how much of a support to passive indexing and algos these buybacks have been. Any bumps in the bull rise get a bid eventually from buybacks. What happens when the algos go into bear mode and buybacks decline? So by my way of thinking, buybacks is something to keep an eye on.