Preface: Explaining our market timing models
We maintain several market timing models, each with differing time horizons. The “Ultimate Market Timing Model” is a long-term market timing model based on the research outlined in our post, Building the ultimate market timing model. This model tends to generate only a handful of signals each decade.
The Trend Model is an asset allocation model which applies trend following principles based on the inputs of global stock and commodity price. This model has a shorter time horizon and tends to turn over about 4-6 times a year. In essence, it seeks to answer the question, “Is the trend in the global economy expansion (bullish) or contraction (bearish)?”
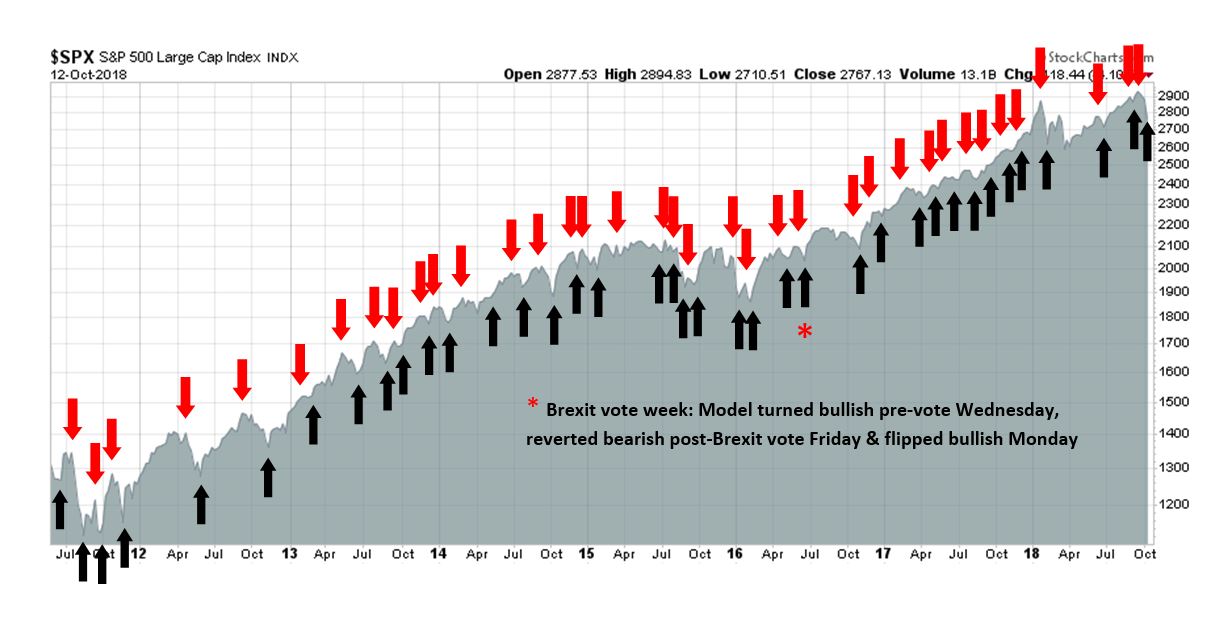
My inner trader uses the trading component of the Trend Model to look for changes in the direction of the main Trend Model signal. A bullish Trend Model signal that gets less bullish is a trading “sell” signal. Conversely, a bearish Trend Model signal that gets less bearish is a trading “buy” signal. The history of actual out-of-sample (not backtested) signals of the trading model are shown by the arrows in the chart below. The turnover rate of the trading model is high, and it has varied between 150% to 200% per month.
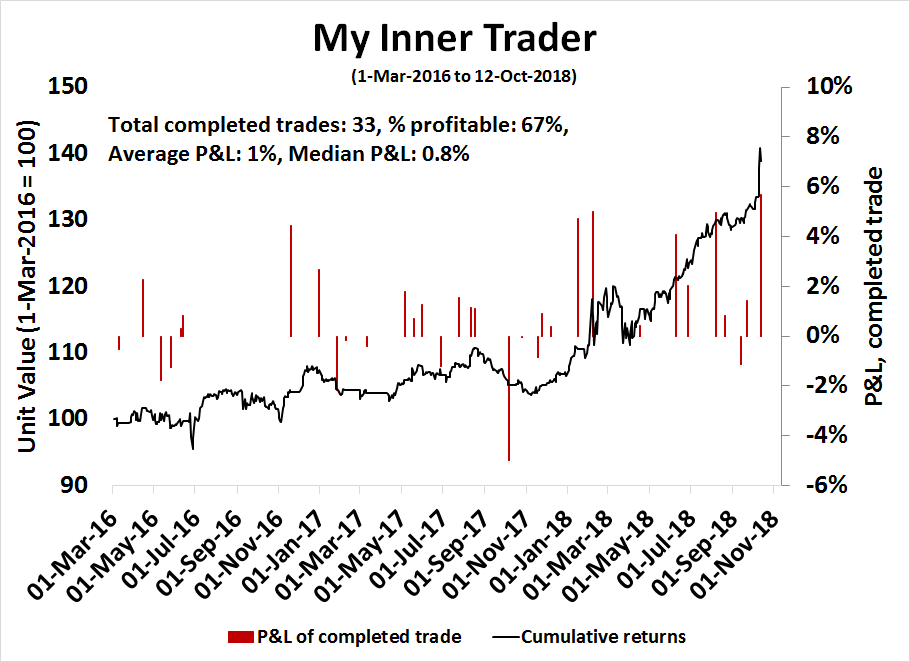
Subscribers receive real-time alerts of model changes, and a hypothetical trading record of the those email alerts are updated weekly here. The hypothetical trading record of the trading model of the real-time alerts that began in March 2016 is shown below.
The latest signals of each model are as follows:
- Ultimate market timing model: Buy equities
- Trend Model signal: Neutral
- Trading model: Bullish
Update schedule: I generally update model readings on my site on weekends and tweet mid-week observations at @humblestudent. Subscribers receive real-time alerts of trading model changes, and a hypothetical trading record of the those email alerts is shown here.
Where’s the bottom?
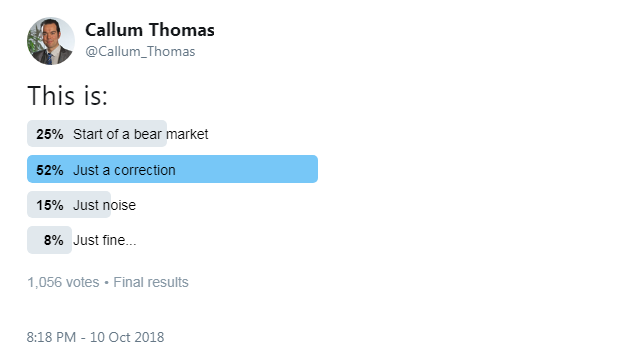
When the market selloff began last Wednesday, Callum Thomas conducted an (unscientific) Twitter poll asking if this is a correction, the start of a bear market, or just market noise. The overwhelming response favored a correction, which is contrarian bearish from a sentiment viewpoint.
Regular readers know that I have become increasingly cautious on the outlook for US equities since August (see 10 or more technical reasons to be cautious on stocks and Red sky in the morning). Now that the major US averages have begun to show signs of technical breakdowns, it is time to ask, “Is this just a correction, or the start of a bear market?”
Correction: No recession in sight
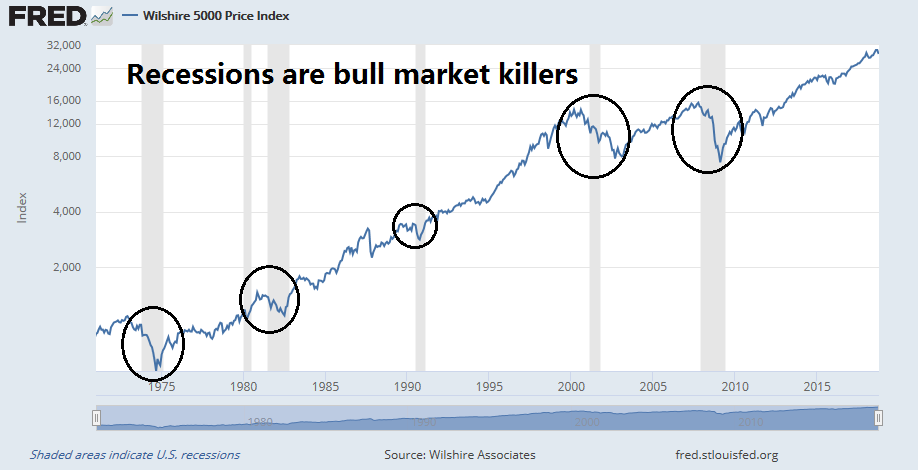
There are numerous reasons to support the case that the latest round of weakness is only a correction. First, there are no signs of a recession yet. As I pointed out last week (see A recession in 2020?), my recession indicators are not flashing red, only flickering. We do not have a definitive recession signal yet. As investors know, recessions are bull market killers.
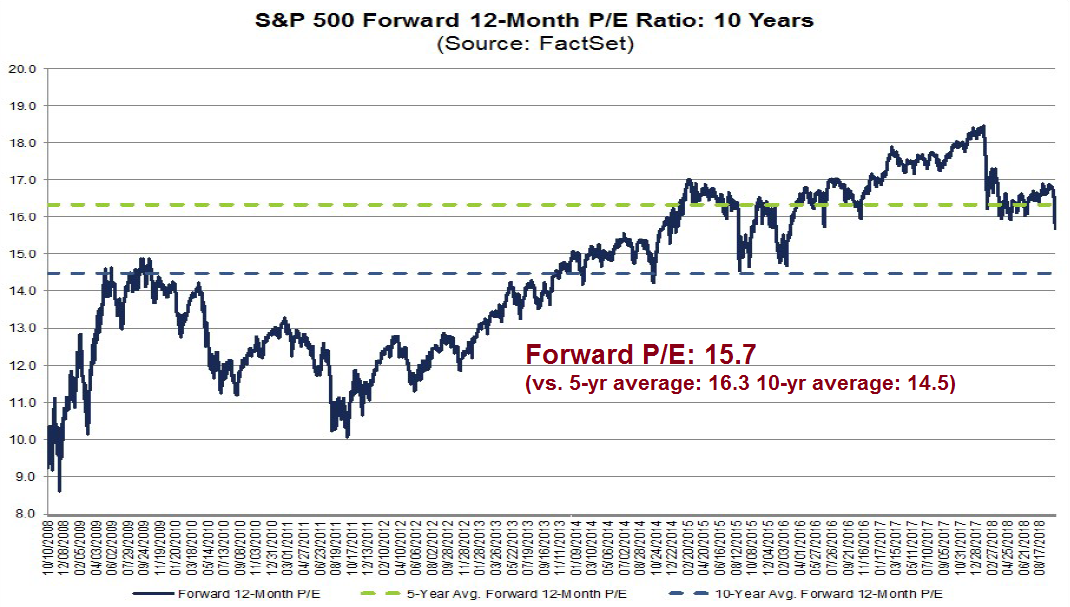
Corporate earnings decline in recessions. If there is no recession, equity valuations are not stretched by historical standards. The latest update from FactSet shows that the forward P/E ratio is 15.7, which is below its five-year average but above its 10-year average. Further stock market weakness would represent a valuation reset that would make US stocks quite attractive by historical standards,
Correction: Bondmegeddon nearly over
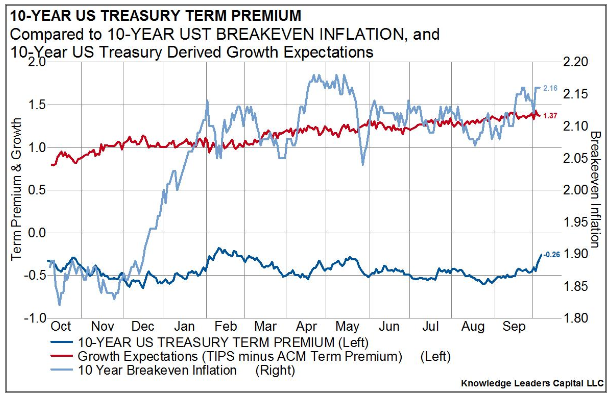
Another support for the bull case is analysis from Bryce Coward of Knowledge Leaders Capital that the bond market selloff, which sparked the rout in equity prices, may be mostly over because the bond market has mostly discounted the Fed’s expectations as outlined by the “dot plot”. Coward found that the spike in bond yields was mainly attributable to rising term premium, with little movement in inflation or real growth expectations.
When trying to understand the recent move in bonds, it’s helpful to measure the movement of each component of the bond: real growth expectations, break even inflation, and the term premium. The 18 basis point move was driven by the term premium rising by +18bps, a +1bps point rise in inflation expectations and a -1 basis point decrease in real growth expectations. That is, there was practically no alteration of either inflation expectations or growth expectations, and nearly the entire sell off was driven by the term premium.
Coward attributed most of the rise in term premium to jitters over a more hawkish Fed:
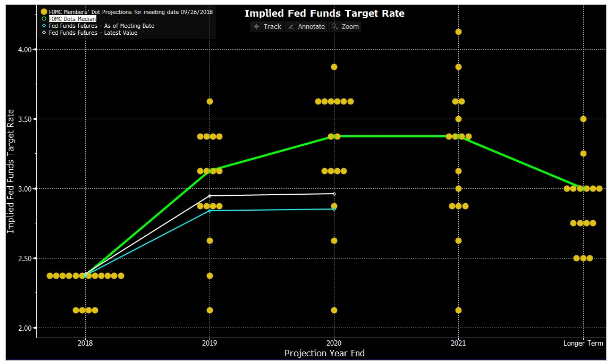
But just how much more does the 10-year need to rise to reflect Fed policy expectations? Very short-term rates could rise a little further, but longer-term rates are about reflecting the terminal Fed funds rate for this cycle. That is, the market could fully discount the Fed’s dot plot via curve flattening. As previously stated, the 10 year treasury bond yield is just the sum of the expected future short-term rates. At the end of the rate hiking cycle, those expectations should configure themselves such that the 10 year bond equals the terminal Fed funds rate. The median Fed member’s terminal Fed funds rate is currently 3.375%, just 17bps higher than the current 10 year treasury yield. The weighted average Fed member’s terminal Fed funds rate is 3.28%, just a few basis points higher than the current rate. This tells is that the rise in yields may be closer to its end than its start, but there is still a little to go to completely discount Fed policy, especially on the short end of the curve.
In conclusion:
The 10 year rate is very near to the Fed funds terminal rate for this cycle. This implies that long rates may not need to move much more to fully discount Fed policy, but that shorter-term rates may need to move a bit higher still, flattening the curve a bit.
Correction: Cautious institutions
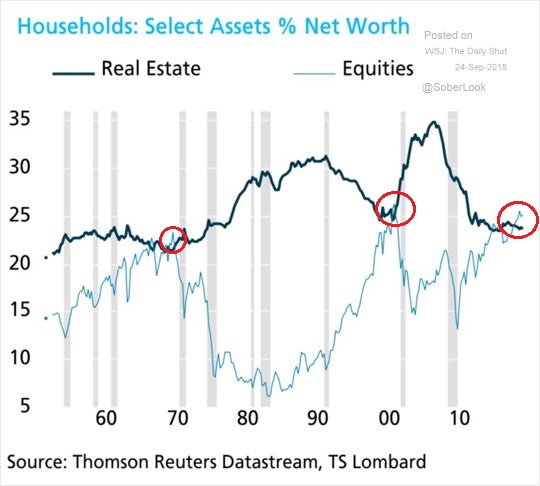
Finally, one reason that is suggestive of a shallower, rather than deeper pullback, is a bifurcation in sentiment. I have outlined how long-term individual investor sentiment is over-stretched by historical standards, such as how household equity assets have exceeded real estate holdings (see The things you don’t see at market bottoms: Booming confidence edition).
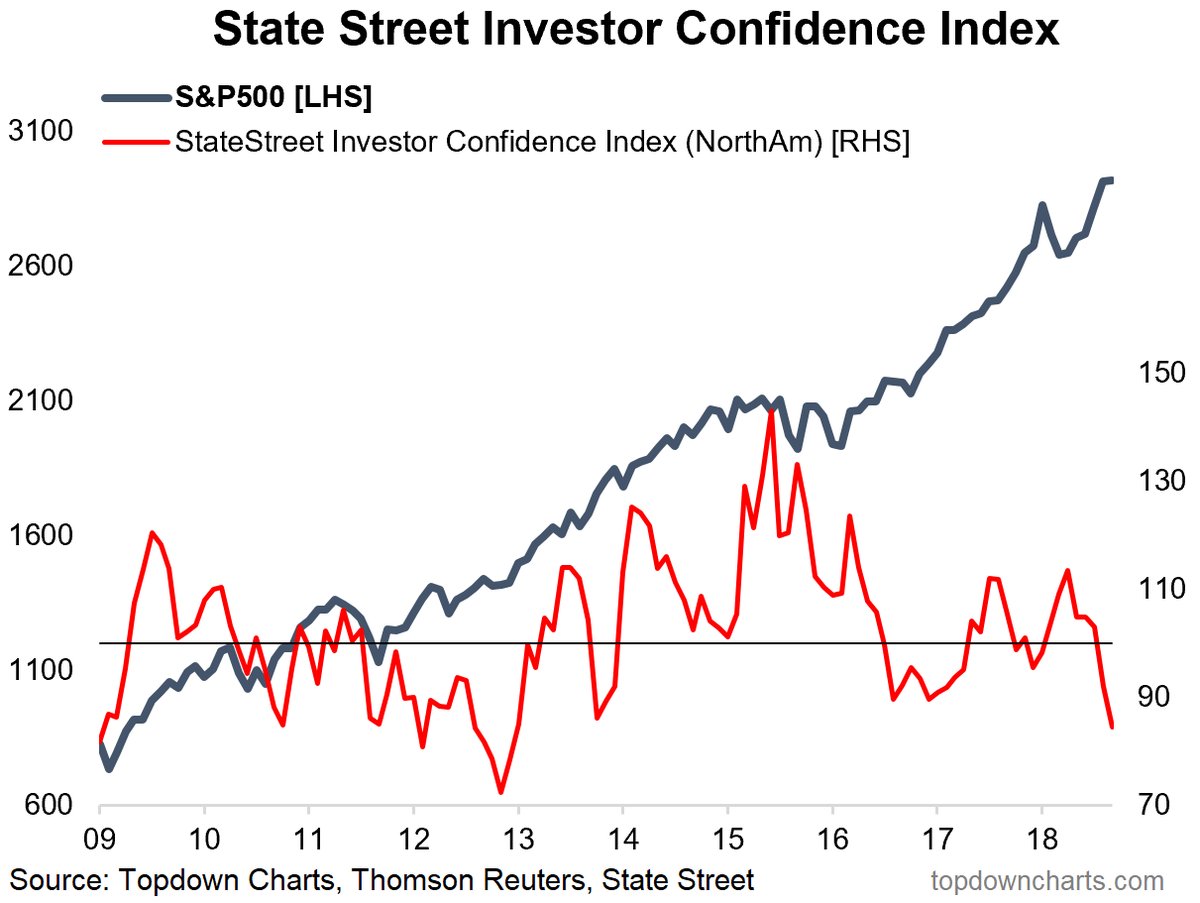
By contrast, various institutional surveys have shown that institutions are generally cautious on equities, which would put a cushion on stock prices if they decline. Callum Thomas highlighted data from State Street’s custodian data, which shows that US investors are already defensively positioned.
Global institutional investors are also cautious on equities.

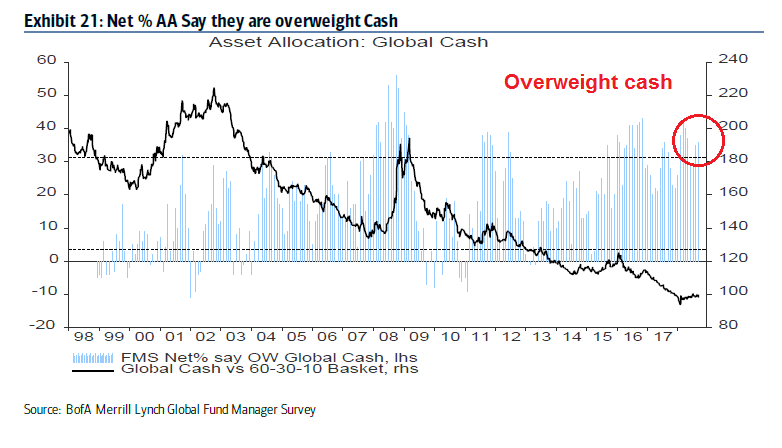
The latest BAML Fund Manager Survey also shows that managers are overweight cash…
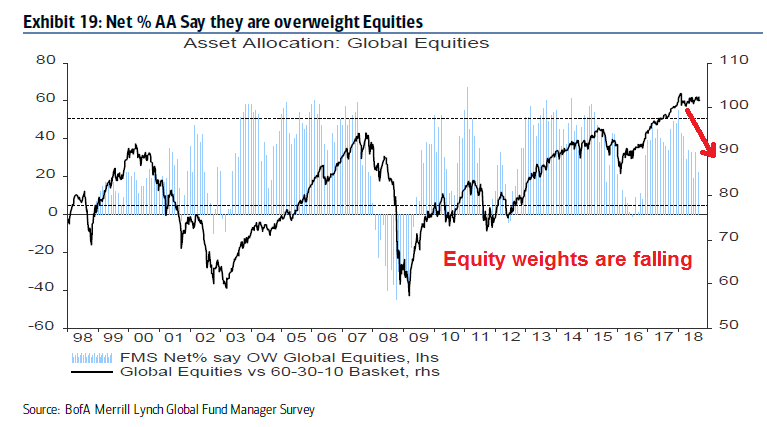
…and they have been reducing their equity weights since late 2017.
While individual investors may be all-in on equities, institutions are cautious, which would provide a cushion should stock prices decline significantly.
Bear case: A hawkish Fed
While the case for a correction rests mostly on conditional outcomes, such as the lack of a recession signal right now, there is no assurance that the economy will not fall into recession in late 2019 or early 2020.
The Powell Fed has made it clear that the default path for monetary policy is to keep raising rates until they see definitive signs of a slowdown, otherwise known as “when something breaks”. While Powell has stated before that he is putting less weight in economic models, such as the Phillips Curve, and greater weight in market-based signals as measures of financial stability in monetary decisions, don’t expect a Powell Put in the manner of past Greenspan, Bernanke, or Yellen Puts.
Bloomberg reported that New York Fed president actually welcomed the stock market selloff as a way of cooling off risk appetite.
“The primary driver of us raising interest rates is just the fact that the U.S. economy is doing so well in terms of our goals,” Williams said Wednesday in a reply to questions after a speech in Bali, where the annual meetings of the International Monetary Fund and World Bank are taking place. “But I would also add that the normalization of monetary policy in terms of interest rates does have an added benefit in terms of financial risks.”
“A very-low interest-rate environment for a long time does, at least in some dimension, probably add to financial risks, or risk-taking, reach for yield, things like that,” he said. “Normalization of the monetary policy, I think, has the added benefit of reducing somewhat, on the margin, some of the risk of imbalances in financial markets.”
In short, despite the tamer than expected CPI print last week, don’t expect the Fed to pause in its policy path any time soon. The Fed is well on its way to keep raising rates until it sees signs of a cooling economy, by which time it may be too late to reverse course and avoid a recession.
As well, the counterpoint to the above analysis from Knowledge Capital Leaders indicating that the 10-year Treasury yield has mostly discounted the rate path implied by the dot plot is further rate hikes will act to invert the yield curve. Bloomberg also reported that Street strategists also expects the yield curve to continue flattening into 2019. Past inversions have been sure fire recession signals.
Bear case: A new Cold War
Even if the economy were to sidestep a recession, Trump’s trade policies have introduced further downside risk in the form of slower global growth. Notwithstanding the looming trade war between the US and China which could slow the two economies, as well as the economies of their major trading partners, the trade war is turning into a new Cold War. This is a new development that represents a tectonic shift in global trade patterns that puts a long-term speed limit on global growth potential.
The recent bombshell report from Bloomberg that Apple and Amazon’s network servers may have been compromised by Chinese spy microchips embedded in the motherboard of servers is a case in point. Despite the vehement and specific denials by Apple and Amazon, which were made by technical personnel rather than lawyers; the Reuters report that the UK cyber security agency supports Apple’s position, and whose denial was confirmed by the US Department of Homeland Security, these revelations will have a chilling effect on the ability of the Chinese to sell electronics to foreigners. The SCMP reported that this incident will force US vendors to re-think their supply chain security.
Although experts remain divided over whether China has the technical know-how to pull off the spy chip hack described by a Bloomberg BusinessWeek report last week, technology research firm IDC believes one thing is certain – the incident will push US hardware vendors to reconsider the integrity and location of supply chains to safeguard security.
“Advanced semiconductor design is the next battleground between China and the rest of the world to ensure security is hard-wired in silicon to employ the most stringent standards and processes across the supply chain,” according to an IDC report co-authored by five analysts including Mario Morales, programme vice-president of enabling tech and semiconductors.
“Vendors will also continue to move forward with implementing their own hardware design and extend the capability to critical components needed for their equipment and workloads. This will be the new arms race in the IT world,” the report said.
This incident is expected to hobble China’s next step in economic development in accordance the China 2025 plan to move into higher value-added design:
IDC said that the ramifications of the story are just beginning to be felt, and cautioned that China’s manufacturing and supply chain is deeply integrated within the business models of many US companies. As such, the supply chain dependency of many American-based vendors will need to be reassessed to stave off any future security hacks.
At the same time, CNBC reported that the Trump administration is, in effect, starting a new Cold War with China (my words, not theirs):
The administration’s clearest and most comprehensive broadside on China yet followed what one official called “thousands of hours” of study and planning. It will involve agencies across the U.S. government, from the Pentagon to the U.S. Trade Representative. The consequences will be both immediate and potentially generational for global economic and security matters.
These initiatives include:
- A landmark speech by Vice President Mike Pence at the Hudson Institute, calling out China as America’s foremost threat, ahead of Russia, due to both the scope and seriousness of its activities abroad and within the United States.
- An underreported aspect of the new U.S.-Mexico-Canada trade agreement that requires all three parties to inform the others if they begin trade talks with “non-market economies” (read China). Trump administration officials view it as a template for trade deals to follow.
- A leaked report that the U.S. Navy’s Pacific Fleet has proposed a series of military operations during a single week in November to send a warning to China and to provide a deterrent to its Beijing’s regional military ambitions.
- On Friday, the Pentagon released the results of a yearlong look at vulnerabilities in America’s manufacturing and military industrial base. “China represents a significant and growing risk to the supply of materials deemed strategic and critical to U.S. national security,” including a “widely used and specialized metals, alloys and other materials, including rare earths and permanent magnets,” the report says.
Pence went far beyond Trump’s UN speech statement that China was acting to influence American elections against him. Pence said for the first time, echoing a view held by Trump since before his presidential campaign, that “what the Russians are doing pales in comparison to what China is doing across this country.”
These steps represent a new containment policy of attempting to slow or halt China’s development path and drive to becoming a superpower, and goes well beyond the initial stated goal of returning offshored jobs back to America. Reuters reported that the Five Eyes global signals intelligence alliance is broadening its cooperation with other countries such as Germany and Japan to counter Chinese influence operations and investments:
The five nations in the world’s leading intelligence-sharing network have been exchanging classified information on China’s foreign activities with other like-minded countries since the start of the year, seven officials in four capitals said.
The increased cooperation by the Five Eyes alliance – grouping Australia, Britain, Canada, New Zealand and the United States – with countries such as Germany and Japan is a sign of a broadening international front against Chinese influence operations and investments.
Some of the officials, who spoke on condition of anonymity because of the sensitivity of the talks, said the enhanced cooperation amounted to an informal expansion of the Five Eyes group on the specific issue of foreign interference.
While China has been the main focus, discussions have also touched on Russia, several said.
“Consultations with our allies, with like-minded partners, on how to respond to China’s assertive international strategy have been frequent and are gathering momentum,” a U.S. official told Reuters. “What might have started as ad hoc discussions are now leading to more detailed consultations on best practices and further opportunities for cooperation.”
As China has been a major engine of global growth over the last few decades, these steps are likely to have the secular effect of slowing overall global growth potential.
Already, China is seeing the cyclical effects of slowing growth. Chinese business confidence is getting crushed in the wake of the trade war. The Thomson Reuters/INSEAD Asian Business Sentiment Index for China has plunged from 63 to 25.
Bear case: Ambitious earnings expectations
The last major risk to the bull case comes from overly optimistic earnings expectations. Analysis from Morgan Stanley shows that the Street expects margin expansion in every non-financial sector in 2019.
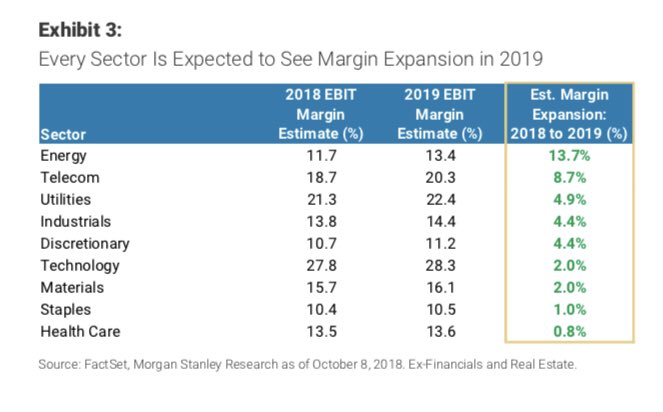
These projections appear to be highly ambitious in light of the following two factors:
- Possible margin pressure from rising labor costs, especially in light of Amazon’s minimum wage boost to $15; and
- Either margin pressures from rising tariffs, or inflationary pressures if higher tariffs are passed through to consumers. In the latter case, the Fed will be forced to raise rates at an even a faster pace.
I will be closely monitoring Q3 earnings season for clues on these two key issues. How much pressure are they seeing from higher compensation costs? What about the trade war? The initial effects are just starting to be felt, and we may see either cost pressures, or guidance as to the ability of companies to pass on tariff related price increases.
As time passes, these dual pressures are likely to increase and so does the risk for earnings disappointment.
Bearish tripwires
To recap. Is this the corrective pause that refreshes, or the start of a bear market? Frankly, I don’t know. However, I am relying on the following disparate real-time macro and technical tripwires for a bear market.
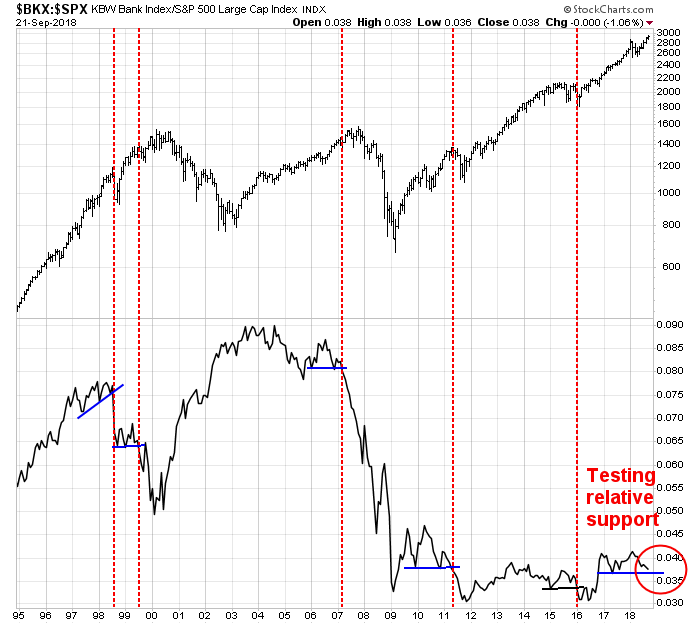
First, the relative performance of bank stocks has been a good real-time warning of rising stress in the financial system. These stocks have been weak on a relative basis and they are on the verge of testing a key support level. Watch for a technical breakdown, which hasn’t happened yet.
The stock market has stumbled four out of five times in the last 10 years whenever the USD Index has risen 5% or more year/year. That’s because the USD has both been viewed as a safe haven currency, a rising USD also acts as a form of monetary tightening, and a stronger greenback creates an earnings headwind for large cap multi-nationals with foreign operations. The USD Index would need to reach about 98 to trigger this bearish tripwire.

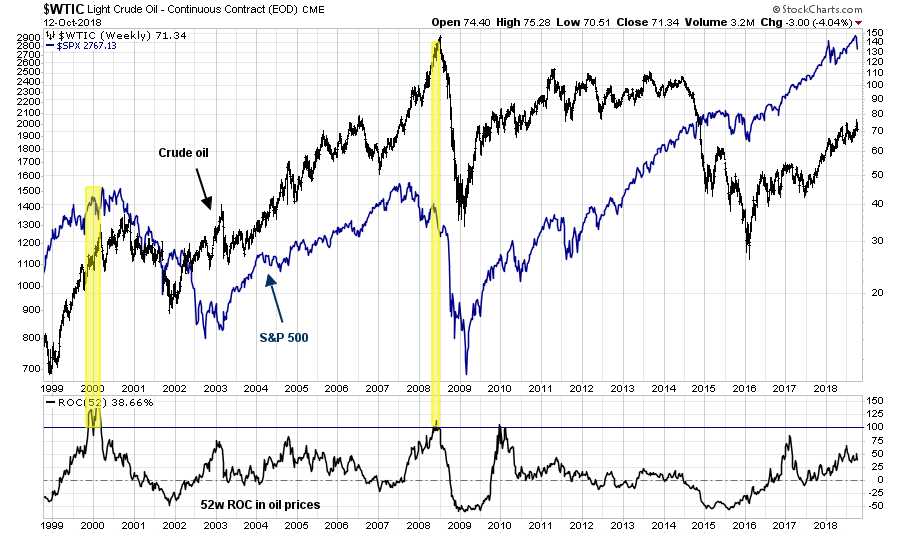
Rising oil prices have historically been a sign of rising inflationary pressures, which would force the Fed to take a proactive stance to cool growth excesses. In the past, stock prices have take a tumble whenever the year/year change in oil prices exceed 100%. Oil prices would have to reach about $100 to trip this bearish indicator.
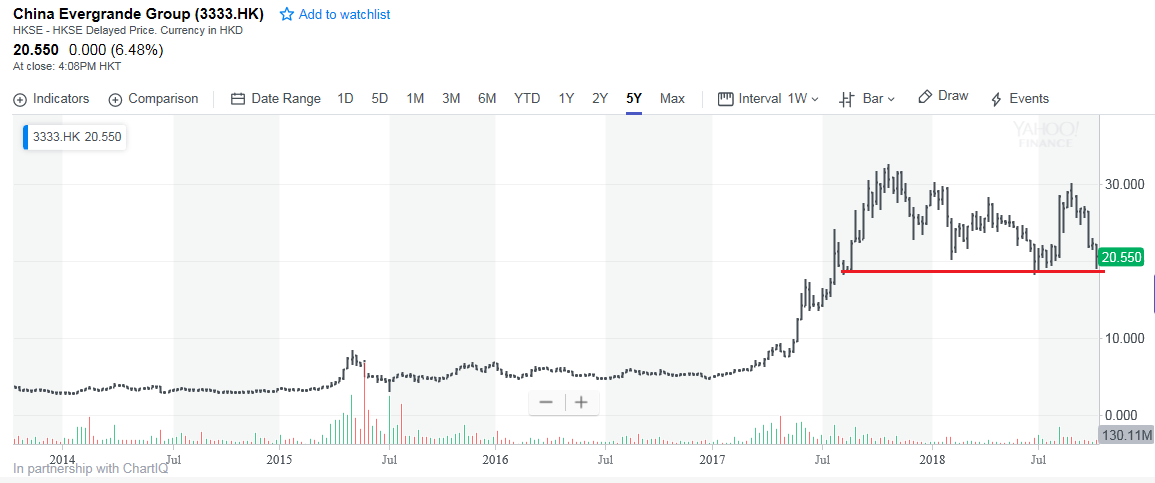
As well, it is becoming clear that China and Asia are undergoing a major slowdown. The key question is the resiliency of the Chinese economy and financial system. The canaries in the coalmine are the Chinese property developers, such as China Evergrande (3333.HK). So far the stock has retreated and it is testing a major support level. A decisive break could be a real-time signal of an uncontrolled unwind of leverage whose effects could spread worldwide. Watch closely!
Finally, I warned in the past about the technical risks posed by the negative monthly RSI divergences showing up in the Wilshire 5000 chart. That said, past bearish breaks have been accompanied by a MACD sell signal, which hasn’t occurred yet. The reading is barely positive, and we would need to see a negative monthly close before flashing a sell signal.
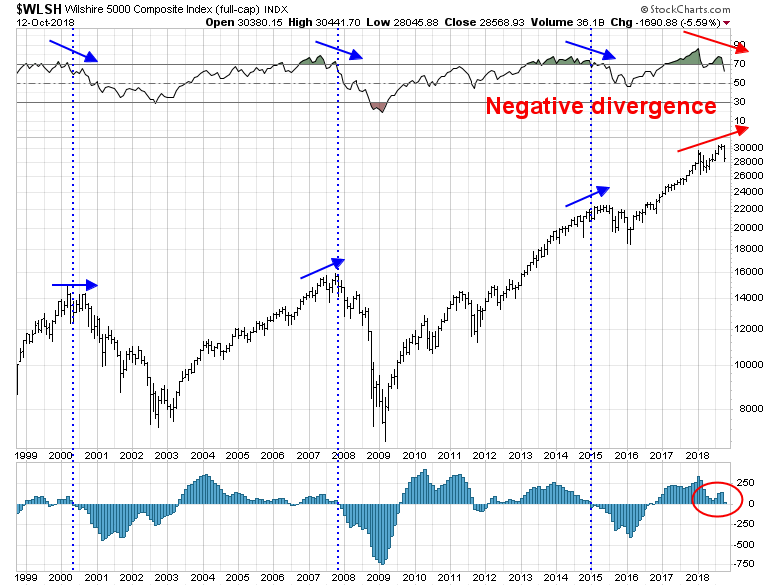
That said, MACD did flash a sell signal for global stocks in July, and global stock prices have historically been higher correlated with US stock prices.

The good news that is none of these bearish tripwires have been triggered. However, it doesn’t mean that the bulls can sound the all-clear signal. A number of these indicators are on the verge of turning bearish.
I am watching these indicators closely. Each of these indicators represent an independent dimension of market risk, and any of the them, it’s going to mean trouble. Nevertheless, I am maintaining an open mind as to how these risks resolve themselves.
The week ahead: Playing the bounce
Looking to the week ahead, the market has suffered much technical damage in a very short amount of time. It is highly unusual for stock prices to suddenly fall from an all-time, slice through the 50 day moving average (dma) support, and then cratered to the 200 dma, all in less than two weeks. It is difficult to believe how the bulls could regain control and proceed as if nothing happened with a V-shaped recovery. The last time this happened was the February correction after the January blow-off. The market rallied, but returned to test its lows about two months later.
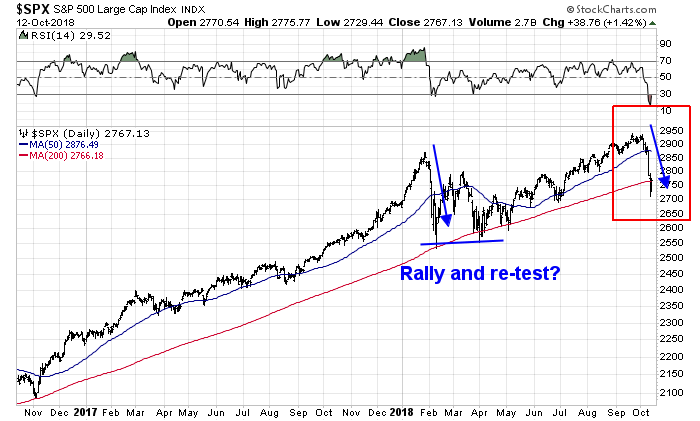
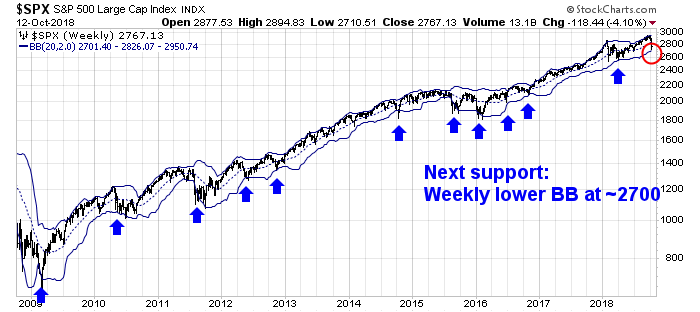
The SPX ended the week at 2767, which is about the level of its 200 dma. However, it is difficult to know what the downside potential is should the 200 dma fail to hold as a support level. The next support level may be the lower weekly BB, which stands at roughly 2700.
Callum Thomas’ Twitter poll shown at the top of this post where 52% of respondents believed (as of Thursday morning) that this bout of market weakness is just a correction is worrisome. It suggests a strong entrenchment of the “pause that refreshes” or “this is a opportunity to buy the dip” mentality. Even if this is just a correction, the market may need a further shakeout to shake that complacency before a durable bottom can be seen.
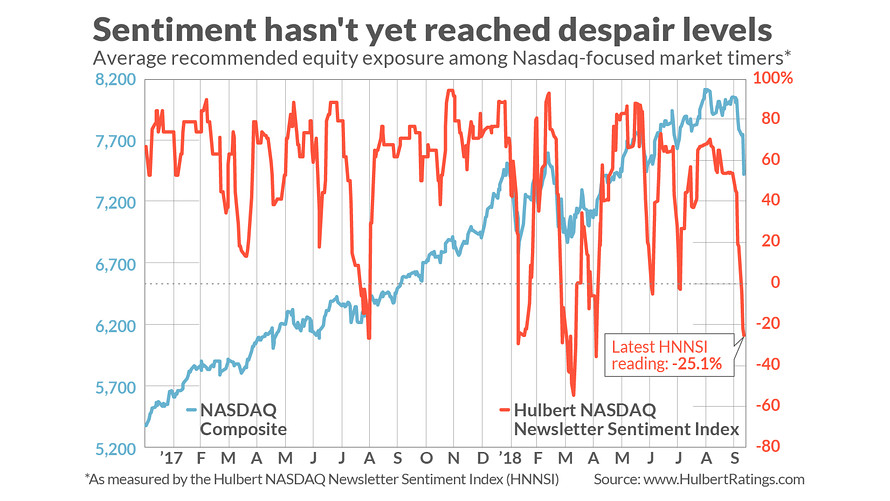
Mark Hulbert pointed out last Thursday that his Hulbert Nasdaq Newsletter Sentiment Index (HNNSI), which measures the sentiment of Nasdaq market timers, had not fallen to washout levels yet. These readings also suggest that the market may need another downleg or re-test of the previous lows before a durable bottom is made.
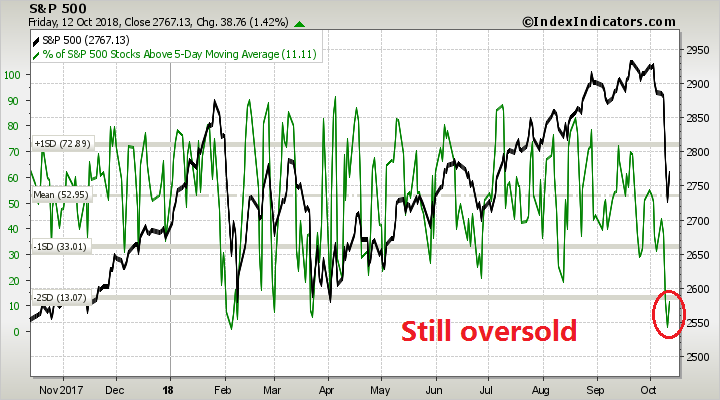
However, it is also becoming apparent that the stock market is poised for an oversold bounce. Subscribers received an email alert after Thursday`s close indicating that the short-term trading model had turned bullish. Breadth indicators were oversold across multiple time frames. That said, past instances of these oversold extremes resolved themselves with an initial rally, followed by a retest of the lows some days and weeks later.
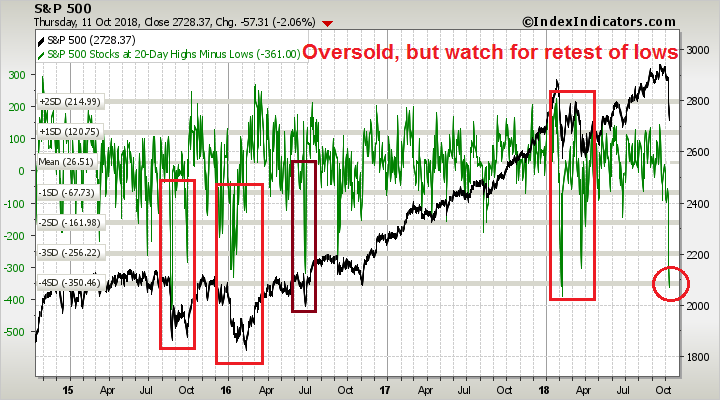
Indeed, the short-term breadth indicator (1-2 day horizon) has already begun to normalize, but the market remains oversold. The only question is how far this reflex rally can run.
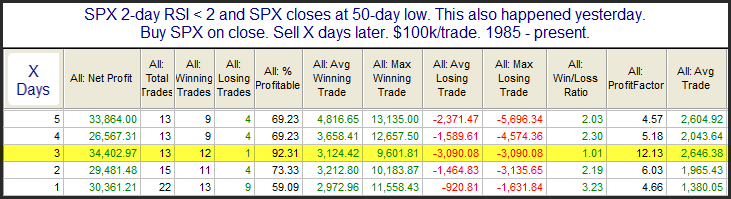
Rob Hanna at Quantiable Edges offered some clues through his historical studies. He searched for back-to-back 50-day lows accompanied by extremely oversold RSI readings. This signal was triggered as of last Thursday`s close, and he found that the market tends to top out again between 3-5 days after the event, which makes the top either this coming Tuesday or Thursday.
Next week is also option expiry (OpEx) week, and Hanna found in a separate study that October OpEx has a historical tendency to be extremely bullish. He found that the market has historically topped out on the Thursday during October OpEx week.

If history is any guide, expect the trading peak to occur this coming Thursday. Even if you are bearish, wait for the bounce to short. Markets simply do not melt down further from such extreme oversold levels.
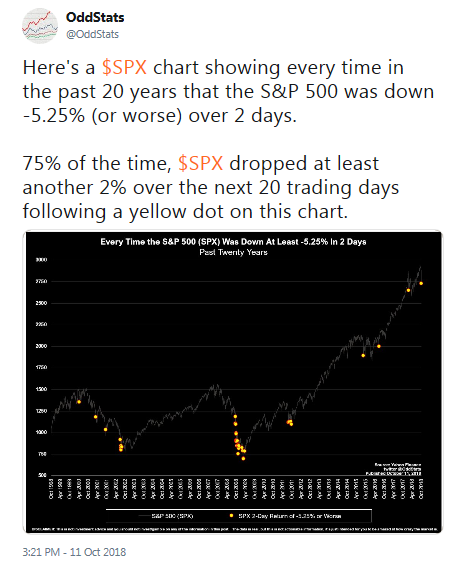
For now, my working hypothesis is a bounce of unknown magnitude and unknown duration, followed by a re-test of the lows (via OddStats). Severely oversold markets just don’t recovery and go straight up.
However, the bulls have one ray of hope. The NAAIM Exposure Index, which measures the exposure of RIAs, fell dramatically last week to levels below its Bollinger Band (BB). Historically, a breach of NAAIM Exposure below its lower BB has been an excellent short-term buy signal (vertical lines).

My inner investor become progressively more defensive since my warnings in August. He is monitoring the tone of reports from Q3 earnings season, which begins in earnest next week.

The early results are mixed . We are entering Q3 earnings season with heightened expectations and subpar corporate guidance. So far, companies with earnings beats are barely outperforming, but earnings misses are not being severely punished. As only 6% of the index has reported, these results are highly preliminary. We need to wait for more reports to gain a better perspective.

There were, however, some macro insights from the limited number (N=24) of earnings calls so far. While companies cited the strong USD as the greatest headwind to earnings results, there are signs that rising wages are beginning to pressure margins. As well, the trade war is starting to bite as “tariffs” and “China” are increasingly being cited as the negative operating factors.
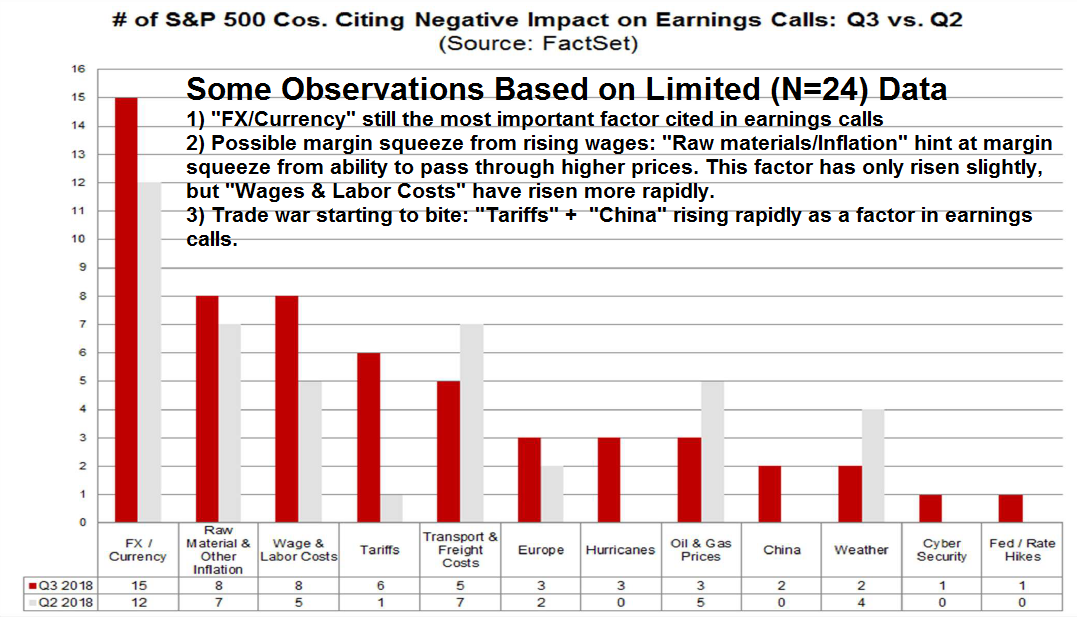
Atlanta Fed president Raphael Bostic recently raised highlighted concerns about margin pressures from wages and tariff-related costs as a result of the Fed’s discussion with local businesses: These are factors that I will be monitoring as Q3 earnings season progresses.
Consistent with aggregate measures of wage growth, reports from my district suggest some firming in labor costs. A growing number of firms across the District reported an uptick in merit increases, averaging in the 3 to 3.5 percent range.
Further, there was a marked uptick in the reported ability of firms to pass on cost increases. This was especially true for firms subject to tariff- and freight-related cost increases. Those firms reported little to no pushback when passing along rising costs to their customers. But I get the sense that the phenomenon is becoming more widespread. It’s a development that I will continue to watch closely.
My inner trader took profits in his short positions and reversed to the long side last Friday in anticipation of a relief rally. Volatility has returned to the markets, and I would advise trader to scale their positions accordingly based their risk tolerance levels.
Disclosure: Long SPXL
Interestingly, the TRIN triggered on Friday, not because longs capitulated, but because shorts threw caution to the winds in covering. Cam, did your Friday early morning trade alert contribute to this ?
In regards to 10 year yields being very close to their logical peak given the Fed Dot Plot and the recent relationship to yields, that overlooks the other century of the relationship. Before this recent period bonds had a two to four percent real return. Lately it’s been negative and still is. As we move back to normalcy, and away from a deflationary economic environment, it’s reasonable to expect real returns to return. Hence bond yields could go up much more that investors and Bryce Coward expect with all the mayhem that would cause.
Excellent work Cam!
The question is not, “When will the bear market start?” That’s because the bull market peaked in January and we’ve been in a bear market since. That is the critical factor in navigating the markets now.
Readers of Cam’s newsletter are experienced investors in following American stock markets. That’s the overwhelming focus. In the past, what’s happening in the U.S. economy and stock markets were the driving forces. Things are changing. Back in 2015, global stock markets ex-US, had a bear market from May of 2015 to early 2016. That led to two big correction in the S&P 500 and a bear market in Russell 2000 U.S. Small Cap Index (down 26%). So watching the global scene would have helped to navigate that treacherous time.
This year, the Global ex-US Index peaked in January and is down 18% while the Emerging Market Index is down 25%. Here are the charts.
https://tmsnrt.rs/2OX8Rnv
So the world is already in a bear market. Higher interest rates are a global killer since there has been a huge growth in global debt in the last ten years, especially in emerging markets due to extremely low rates. The U.S. tax cuts have temporarily helped the American market do better but the negative global scene is starting to weigh on them since May. It’s days as an outlier are over in my opinion.
Here is the evidence which I think is overwhelming. The key corporate beneficiaries of the tax cut are failing.
The price action on Shareholder Yield ETF (SYLD) is the proof. It owns shares in 100 big cap American companies that are chosen because they are highly profitable, raising dividends and buying back their own shares. These are the biggest beneficiaries f the tax cuts and the ability to repatriate overseas cash. They are big, mostly household names and most are international. They had huge profits held offshore that they are repatriating to boost dividends and buy back shares. That led to big outperformance after the December tax cut passed until May. Then the global bear market and the trade war started to drag down these shares that are the backbone of U.S. stock market. Here is the chart on SYLD;
https://tmsnrt.rs/2yhzBG3
There has been a 13% drop in relative performance of SYLD to the S&P 500 in just three months. That is huge for such a basic, mature group of companies. Note also that there was just as big a jump in relative performance from December 2017 (the tax cut timing) to May when these companies were spending billions buying back shares, raising dividends and analysts were raising their future profit estimates.
My clients were happy when it was doing well. Fortunately my momentum approach got me out when the positive trend changed. I follow this ETF closely.
The good times are over in my estimation and that is very negative for the U.S. market outlook. These companies overseas profits will be hurt by the higher US dollar and slower global economic growth. The bear market in global stocks and the downturn in their leading economic indicators foretells a global recession is coming soon. The anti-globalization movement will also have an unknowably great negative impact on global American company sales and higher costs of their supply chains hence surprising less future profits that analysts currently are forecasting.
The investment world is changing as the American economy is a smaller share of the world. Global stock markets influence more. The political scene is toxic with Trump using trade as a weapon. Companies have adopted global supply chains to make their products. They are selling more goods overseas. GM sells more cars in China than the U.S.. for example. China is a huge market for Apple. Watch SYLD to see how these important companies’ stocks are doing. Keep the chart URL above to check its progress. The chart updates every night (amazing technology).
I expect the global bear market (and that includes the U.S.) to end when interest rates hurt enough to have them start falling. It will end when Central Bankers stop Quantitative Tightening because they see economic problems cropping up. It will end when have unemployment in the U.S. approach or even exceed its natural rate of 4.2%. All of these points in time are far off so I suggest tightening your seat belt.
We are in this together. Good luck.
Great share as always. Thank you.
Ken, you seem to have a great fear of bear markets, yet studies show that stocks rarely fall more than 2% a month even in bear markets. I know you run money and have lots of folks to look out for, but still….
@Cam great data points and observations as always!
If you can touch on EM equities in your future posts it would be much appreciated. Would like to know if it still has more significant downside relative to US if signs of recession in US become more prominent. Thanks.
EM looks ok for a bounce but I would avoid it longer term. China looks like it’s slowing, and the offshore USD market is showing signs of stress – which will negatively affect the vulnerable EM economies.
Is there a way to monitor activity of the USA plunge protection team? If not written about here before, it would be interesting to see an article on the USA plunge protection team – what they do and how they do it, and if there is a way to detect their actions.
The plunge protection team is mostly an urban myth, and it’s as real as the Loch Ness Monster or the Sasquatch. If it ever existed, it was an ad hoc group put together between Treasury and the Fed in order to deal with the Crash of 1987.
If you want to see the PPT in action, wait for a one-day -20% move in US equities.