Preface: Explaining our market timing models
We maintain several market timing models, each with differing time horizons. The “Ultimate Market Timing Model” is a long-term market timing model based on the research outlined in our post, Building the ultimate market timing model. This model tends to generate only a handful of signals each decade.
The Trend Model is an asset allocation model which applies trend following principles based on the inputs of global stock and commodity price. This model has a shorter time horizon and tends to turn over about 4-6 times a year. In essence, it seeks to answer the question, “Is the trend in the global economy expansion (bullish) or contraction (bearish)?”
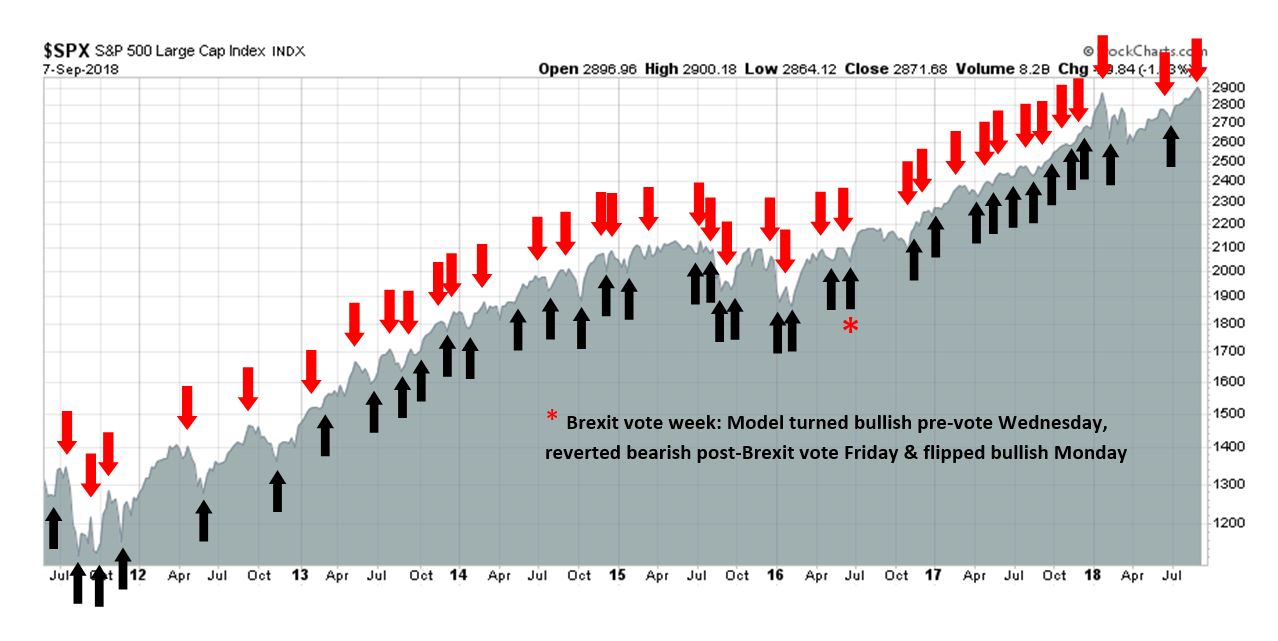
My inner trader uses the trading component of the Trend Model to look for changes in the direction of the main Trend Model signal. A bullish Trend Model signal that gets less bullish is a trading “sell” signal. Conversely, a bearish Trend Model signal that gets less bearish is a trading “buy” signal. The history of actual out-of-sample (not backtested) signals of the trading model are shown by the arrows in the chart below. The turnover rate of the trading model is high, and it has varied between 150% to 200% per month.
Subscribers receive real-time alerts of model changes, and a hypothetical trading record of the those email alerts are updated weekly here. The hypothetical trading record of the trading model of the real-time alerts that began in March 2016 is shown below.

The latest signals of each model are as follows:
- Ultimate market timing model: Buy equities
- Trend Model signal: Neutral
- Trading model: Bearish
Update schedule: I generally update model readings on my site on weekends and tweet mid-week observations at @humblestudent. Subscribers receive real-time alerts of trading model changes, and a hypothetical trading record of the those email alerts is shown here.
Global slowdown in progress
There is an adage among the nautical set:
Red sky at night, sailor`s delight
Red sky in the morning, sailors take warning
In the global economy, there are signs of a red sky in the morning. Last week, IHS Markit highlighted falling global manufacturing PMI.
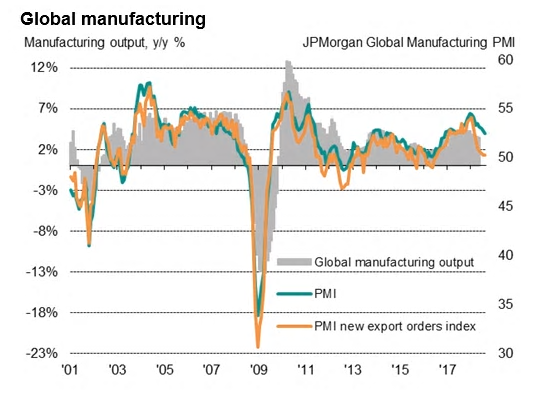
Stagnant growth can be attributed to a slowdown in export orders in every major region of the world. In particular, the export order components of the UK, Japan, China, and much of Asia are below 50, indicating negative growth.
The global trade slowdown is confirmed by the OECD, which is a sign that the trade war is starting to bite.

Let’s take a tour around the world and see how the global economy is progressing.
The US: From tailwinds to headwinds
Starting our tour in the US, the snapshot shows a picture of strong growth, but forward-looking indicators are pointing to deceleration. The upside surprise from the ISM Manufacturing PMI appeared anomalous.
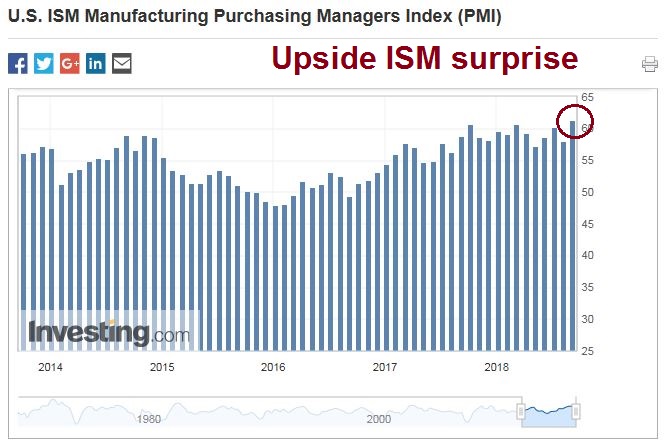
Chris Williamson, chief economist at IHS Markit, attributed the strength in ISM to a likely bias towards larger companies, while the Markit survey focuses more on SMEs.
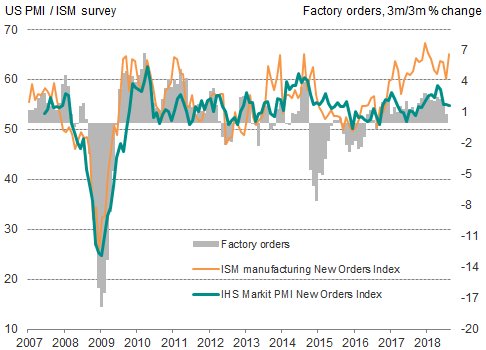
Another explanation is companies undertaking a precautionary inventory build ahead of tariffs that are being implemented later in the year. The share of respondents in the ISM survey saying that inventories are up jumped up to levels not seen since 2013.

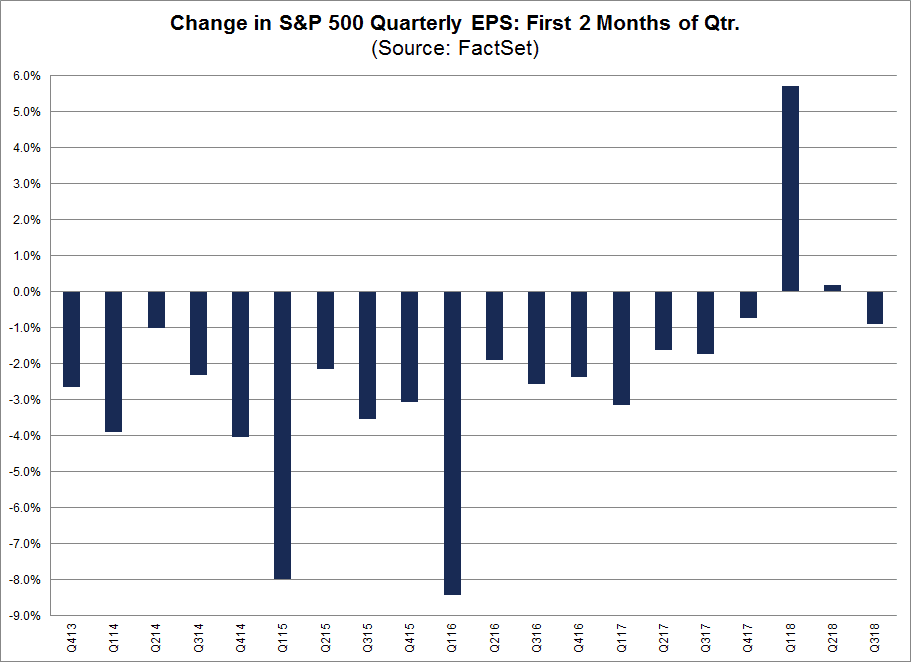
Looking ahead to Q3 earnings season, expectations are starting to get racheted downwards from the torrid EPS growth rates of Q1 and Q2. FactSet reported that the pace of Q3 guidance is normalizing, as 75% of companies have issued negative guidance, which is slightly above the 5-year historical average of 71%. The rate of Q3 EPS downgrades are now roughly consistent with history.
The strong ISM and August jobs numbers will give support to the Fed`s course of tightening monetary policy. As well, last week’s Fedspeak revealed a Federal Reserve that is determined to keep raising rates until something breaks. In an interview, Minneapolis Fed President Neel Kashkari, who is one of the most dovish members of the FOMC, revealed that the Fed’s institutional memory is still biased towards fighting inflation. By implication, Fed officials are likely to err on the side of caution should growth and inflationary pressures become evident.
There’s scarring from the financial crisis, yes. But there’s scarring, bigger scarring from the inflation of the 1970s. And I think that that is persuading us more than anything else and why we’re so biased towards … you know we say that we are we have a symmetric view of inflation. We don’t mind if it’s 2.1 or 1.9 but in our practice, in what we actually do, we are much more worried about high inflation than we are low inflation. And I think that that is the scar from the 1970s.
At the same time, John Williams, who is one of the highly influential triumvirate of the Fed chair (Powell), vice-chair (Clarida), and the New York Fed President (Williams), stated that he is not afraid of inverting the yield curve (via the WSJ):
Federal Reserve Bank of New York leader John Williams said Thursday the prospect of a yield-curve inversion by itself wouldn’t be enough to stop him from supporting further rate rises if he thought the economy called for them.
“I think we need to make the right decisions based on our analysis of where the economy is and where it’s heading,” Mr. Williams told reporters after a speech in Buffalo. “If that were to require us to move interest rates up to the point where the yield curve was flat or inverted, that would not be something I find worrisome on its own.”
Reuters reported that even the former dove, Charles “don’t hike until you see the whites of inflation’s eyes” Evans of the Chicago Fed, turned hawkish. He now believes that the Fed should not pause its rate hike program until the Fed Funds rate rises beyond the neutral level:
The Federal Reserve will likely have to raise interest rates past the neutral rate to keep the economy on a sustainable growth path and inflation around target, according to Chicago Federal Reserve Bank President Charles Evans.
“Given the outlook today, I believe this will entail moving policy first toward a neutral setting and then likely a bit beyond neutral,” Evans said in a speech originally intended to be delivered to a conference earlier this week in Argentina and released on Thursday.
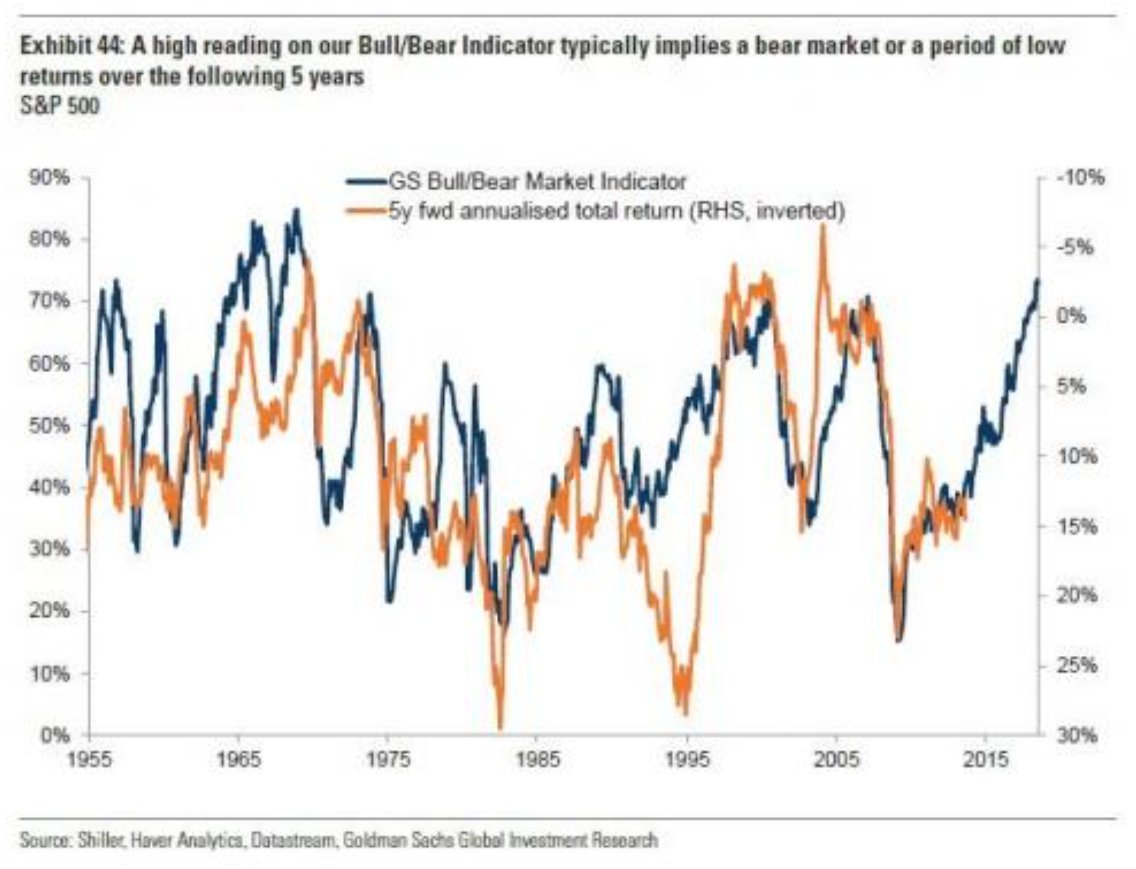
Longer term, the outlook is far more cloudy. The Goldman Sachs Bull/Bear Risk Indicator is not looking very pretty.
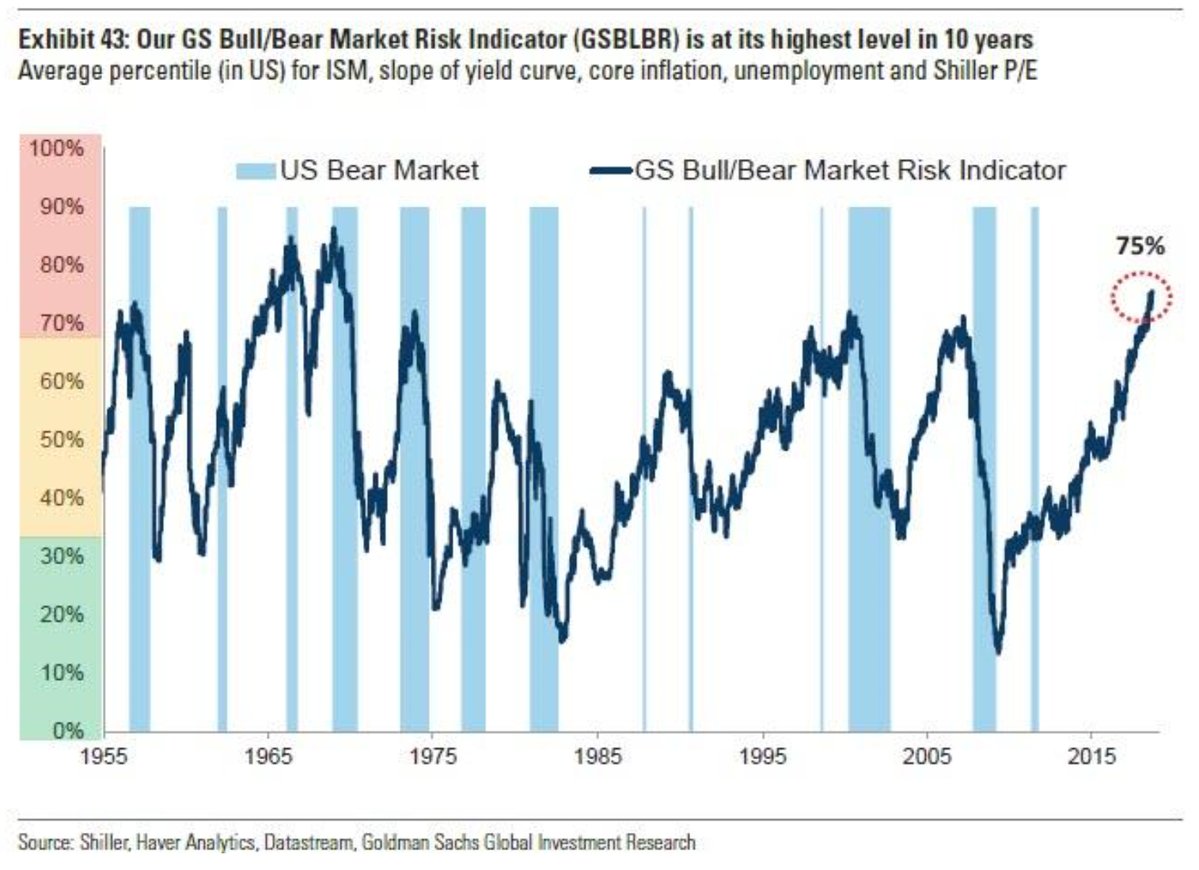
While this indicator is not intended to be a tactical market timing indicator and more effective at forecasting five-year returns, it nevertheless represents a warning for long-term investors.
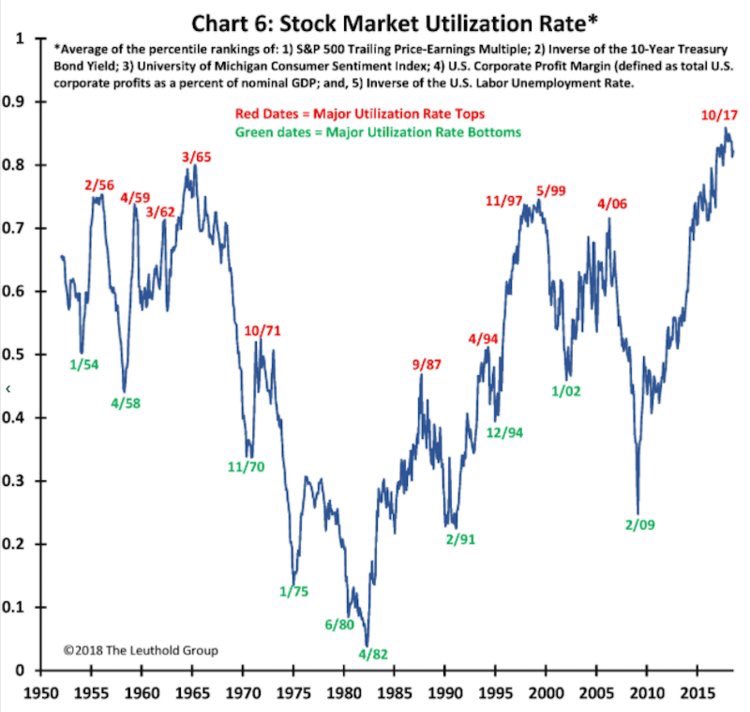
Business Insider reported that the Leuthold Group issued a similar warning for stock prices.
In short, the tailwinds are starting to turn into headwinds.
Jittery Europe
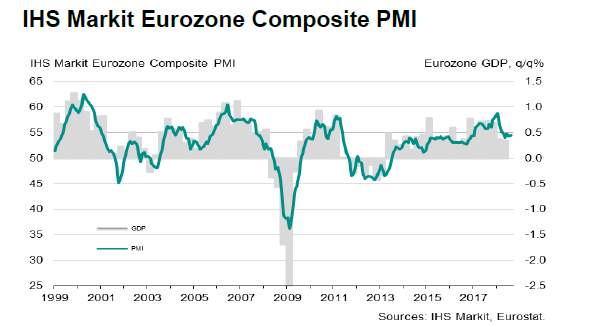
Across the Atlantic, IHS Markit reported that the Eurozone PMI was steady, but the expectations component was deteriorating.
The levels of new work continued to increase during August, with the rate of growth improving slightly on July, but business confidence regarding future activity continued to weaken. Latest data showed expectations were at their lowest level for 23 months as global trade tensions and the unknown impact on future activity continued to undermine confidence. Most notably, sentiment amongst Italian and Spanish companies fell to around five-year lows. Expectations in France were at their weakest in over a year-and-a-half.
Recent analysis from Goldman Sachs shows that recent outperformance in European equities has been driven mostly by foreign sales, indicating a lack of enthusiasm for local exposure. This begs the question of what might happen if non-European economies wobble.

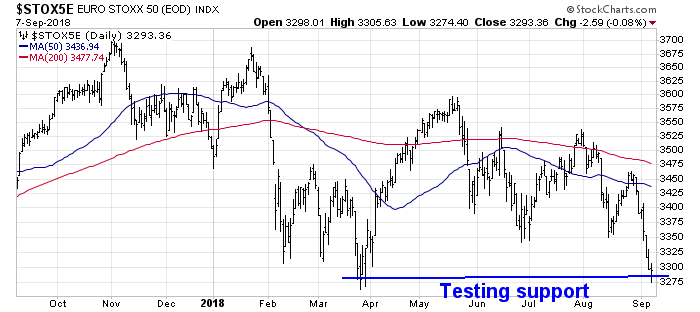
The Euro STOXX 50 has been behaving badly in response. The index has fallen below its 50 and 200 day moving averages, indicating a downtrend as begun. Tactically, it is now testing a key support level.
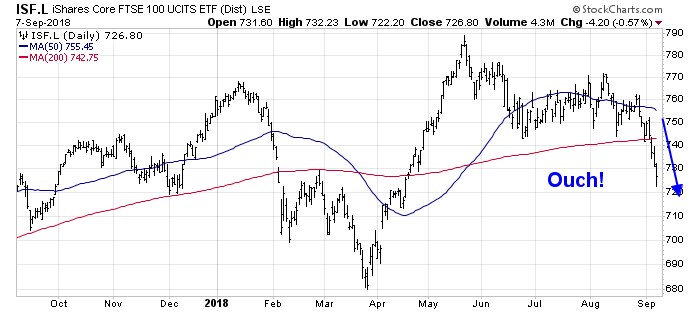
Across the English Channel, the FTSE 100 is exhibiting a similar downtrending pattern of trading below its 50 and 200 dma. The prospect of a no-deal Brexit is not helping matters.
Deflating Asia
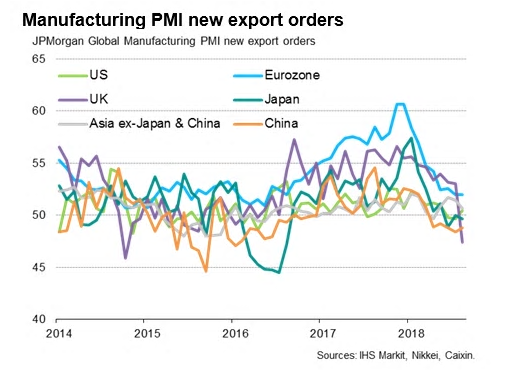
The weakness in the FTSE 100 is not surprising. A ranking of Manufacturing PMI export orders shows that the UK was in contraction. Moreover, the two major Asian economies, China and Japan, were also in contraction. Other countries at the bottom of this ranking were also mainly Asian.

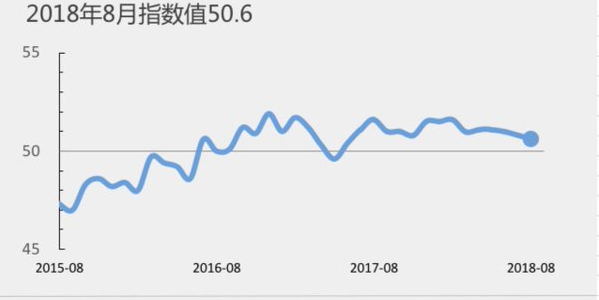
China’s Caixin PMI slowed to 50.8 in August, which is an 14-month low. Equally surprising was the performance of Guangdong province, China’s economic powerhouse, which saw PMI drop from 50.2 in July to 49.3 in August, indicating contraction.
A scan of the stock indices of China and her major Asian trading partners reveals a bearish picture. With the exception of the Taiwanese market, all other markets are either in downtrends, or recently suffered a technical breakdown (Australia).

The commodity markets are also signaling a global slowdown. Commodity prices are more sensitive to Chinese economic growth, as China represents the bulk of the demand in many instances. Both industrial metals and the CRB Index are in downtrends.

What the world tour is telling us
So what is the tour around the world telling us?
It tells us that the global economy ex-US is slowing. The slowdown is most evident in Asia, and Trump’s trade policies are likely exacerbating the downturn. Softness is also beginning to appear in Europe, and the prospect of a no-deal Brexit is not helping the UK outlook.
In the US, the nowcast remains robust, but tailwinds are starting to turn into headwinds. Both the Goldman Sachs Bull/Bear Market Risk Indicator and the Leuthold Stock Market Utilization Rate, which are composites of macro and equity valuation indicators, are flashing late cycle signals. The Leuthold indicator has begun to roll over, which is a more definitive bearish warning, while the Goldman Sachs indicator has not, and it is just signaling a high risk environment.
At the same time, policy direction is charting a bearish course. The Fed is determined to continue to tighten monetary policy. At the current pace, the yield curve is likely to invert in late 2018 or early 2019. The Trump administration appears to be determined to go all-in into a trade war (see my January 2018 publication Could a Trump trade war spark a bear market?).
In short, the clouds are gathering. Observant investors are seeing the metaphorical “red sky in the morning”. How many will take heed of this warning?
The week ahead
Tactically, traders should not be worried about a crash. While bottoms may be events, market tops are processes, and stock prices normally don’t fall in a straight line.
Here are the tactical bull and bear cases.
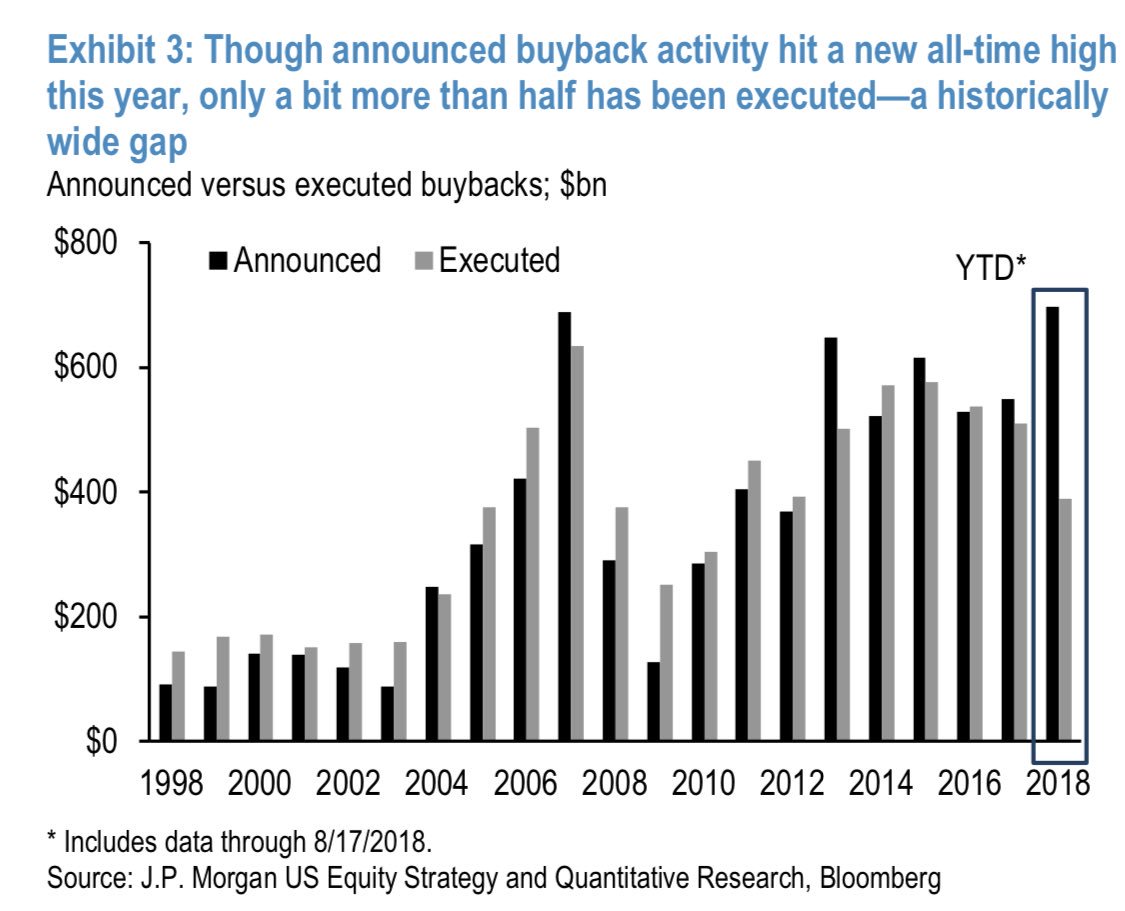
Starting with the bull case, the chart below shows the difference between actual and announced buybacks. Should the market decline further, expect that the buyback desks to become busier, and the additional buying should put a floor on stock prices, at least for now.
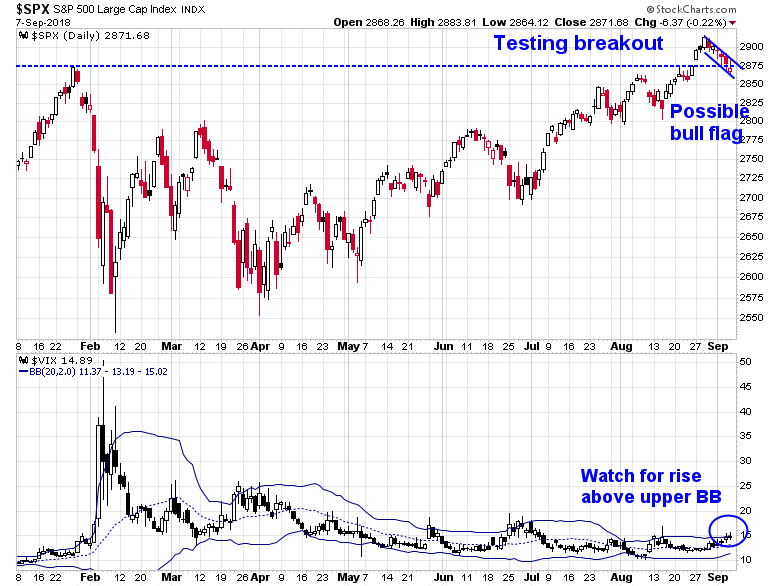
The S&P 500 retreated last week to test the breakout turned support level, and so far, support is holding. Moreover, the technical pattern appears to be a bull flag, which is a continuation pattern indicating higher prices. Moreover, the VIX Index is nearing the top of its Bollinger Band. A rise above the upper BB is an oversold signal that is a setup for a relief rally.
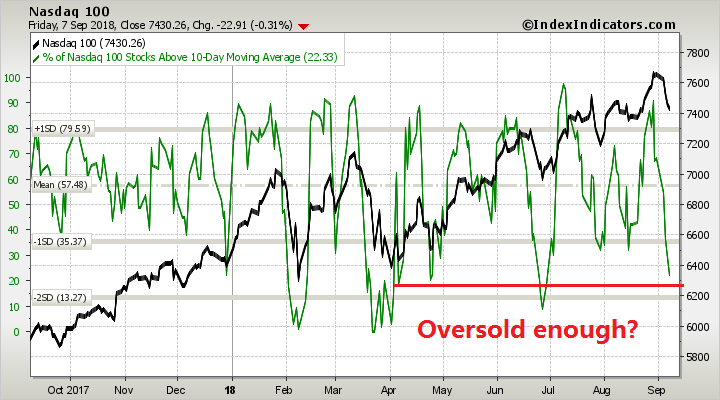
On the other hand, market internals of equity risk appetite are failing. The NASDAQ 100, which had been one of the market leaders, breached an uptrend line last Thursday. In addition, the high beta/low volatility factor ratio has broken down through a relative support level. These kinds of technical damage cannot be ignored, at least on an intermediate term basis.

Short term breadth indicators from Index Indicators show that the S&P 500 is nearing an oversold extreme, but may need one more down day before a bottom can be found. This is consistent with my observation that the VIX is just below its upper BB, which is also an oversold condition.

Breadth readings for the NASDAQ 100, which has bore the brunt of last week’s weakness, tell a similar story. However, this index may be sufficiently oversold to start a relief rally now.
Next Monday is Rosh Hashanah. Jeff Hirsch of Almanac Trader found the “sell Rosh Hashanah, buy Yom Kippur” trading pattern still works, and historically the DJIA has been weak the day before Rosh Hashanah, and strong on the day itself. If history were to be any guide, we may see a bounce on Monday before a final flush mid-week as the final trading low is achieved.

My inner investor is taking advantage of market strength to selectively lighten up his equity positions. My inner trader remains short, and he is waiting for the oversold signal to cover.
Disclosure: Long SPXU
Clearly the irresponsible tax cut when the American economy was booming has led to their stock market getting a boost while international markets are rolling over in a normal, late cycle manner.
The S&P 500 is highly weighted to international companies that will be hurt by a global slowdown and a US dollar coincident upswing. That is why the outlook for the index is poor. Currently it has held up because these same companies are huge tax-cut beneficiaries PLUS they are buying back huge amounts of their own shares due to the tax legislation allowing repatriation of offshore held profits.
Those two benefits to US equities are short term. The negatives of a disruptive trade war with higher interest rates and inflation on a highly indebted world are long term, very negative factors.
Excellent points, Cam …and Ken.
Thanks again for both of your’s perspectives!!
I use the 3x leverage ETFs such as SPXL and SPXU because they are held in a tax-deferred retirement account that does not allow leverage. The actual weight of these ETFs in the account tend to be relatively small, but they allow me to control my leverage that way. How you construct your portfolio is a function of your own return expectations, risk preference, and pain thresholds.
As they say, your mileage will vary. I cannot tell you how much you should buy or sell.
” SPXL and SPXU”
I often sell puts so I hope they will soon/eventually have weekly options on these.
Thanks Cam. That makes sense. Not asking about sizing. But there are 3x short funds on many indexes, some, like the biotechs you might think would have more to gain in a market selloff.
Eric, Yes, I like selling covered puts and calls on a stock when the IV > 50% (“high”) and I like the underlying LT. Worthwhile but they’re small, not common.
Cam, could you say a bit about your choice of SPXU for short exposure? I have about 20 US stocks in my portfolio I’d like to hedge market risk. For you, is it about tracking your long positions? (it doesn’t too well for me) Or liquidity? (that looks good) Or decay? (seems not to be too material except over many months) Are there other fairly good choices?
Sorry, anyone else is welcome to reply too.