I received a ton of comments after yesterday’s post (see A correction, or the start of a bear market?), probably because of the tumultuous nature of last week’s market action. Readers pointed out a number of buy and sell signals that I had missed in yesterday’s post and asked me to comment on them. (Rather than email me directly, I encourage everyone to put their comments in the comments section rather so that the rest of the community can see them.)
The bullish and bearish signals are not necessarily contradictory, as they operate in different time frames. I believe that they reinforce my conviction that the market is undergoing a long-term top. Tops are processes. Stock prices don`t go straight down when the market tops out. The most recent break was just a warning.
Even if you are bearish, I reiterate my view that the markets are too oversold to meltdown from current levels. Rob Hanna of Quantifiable Edges found that market bounces that begin on a Friday tend to be the most reliably bullish.
Here is the other feedback that I received which makes me believe that the US equity market is in the process of making a top.
Cautious technicians
The most notable comments came from multiple readers, who alerted me that a number of well-known technicians had turned cautious. Josh Brown highlighted the analysis from Ari Wald, who observed that internal cracks, which appeared first in non-US markets, are broadening.
In addition, JC Parets of All Star Charts turned cautious after staying bullish for a very long time:
Some of you guys have been reading my work for over a decade. But I understand there are many newer readers, so I think it’s important to address what’s going on here. I’ve been called a Permabull many times for over 2 years now, meaning that they believed I just always had a bullish bias towards stocks. The truth is that while so many were eager to pick a top during this entire rally, I was consistently bullish because the weight of the evidence pointed that way. This is no longer the case and our approach has had to adapt over the past week to a new environment.
The markets had gone through his stops:
We’re fortunate to have been accurate with our risk levels. As soon as Small-caps broke 169, things got bad. There was no reason to be in them for us if we were below that in $IWM. Large-caps broke our levels early this week and things got progressively worse after our prices were breached. That is why we set them. That’s the good news. The bad news is that I’m confident this is just the beginning.
The severe technical damage suffered has turned Parets more cautious, though he is not outright bearish just yet:
I believe we are entering a period of what is, at the very least, a period of consolidation. I think we’re lucky if it’s another 2015. That wasn’t so bad and markets recovered quickly to begin one of the greatest runs in history. I hope you enjoyed it.
The bigger issue here is that we’ve broken a lot of important levels. This makes any strength vulnerable to overhead supply. In other words, instead of the infamous BTFD – Buy The Freakin Dip, the old STFR – Sell The Freakin Rip is most likely to rule moving forward. I’m sure my friends at Stocktwits will have a lot of fun with this one. That’s just the environment we’re in now. Either we resolve through much lower prices and get it out of the way quickly, like 1987, or it’s a drawn out process that could take 6-12 more months.
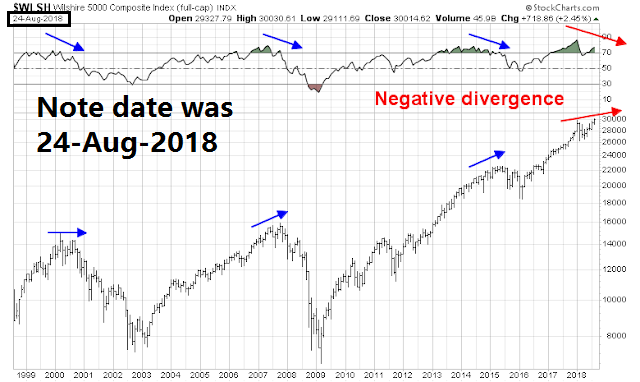
These changes of hearts illustrate the adage that market tops are processes. Different indications turn bearish in different time frames. I turned cautious back in August due to a negative monthly RSI divergence (see 10 or more technical reasons to be cautious on stocks). Since then, the market rose to an all-time high and then fell.
Here we are today, as other technical analysts have followed suit and turned cautious, sparked by trend line violations and trend following models, which tend to be late by design.
Two US Dollars
One of the bearish tripwires that I had outlined in yesterday’s post (see A correction, or the start of a bear market?) was the US Dollar. I wrote that the stock market had a history of running into trouble whenever the year/year change in the USD Index rose above 5%.
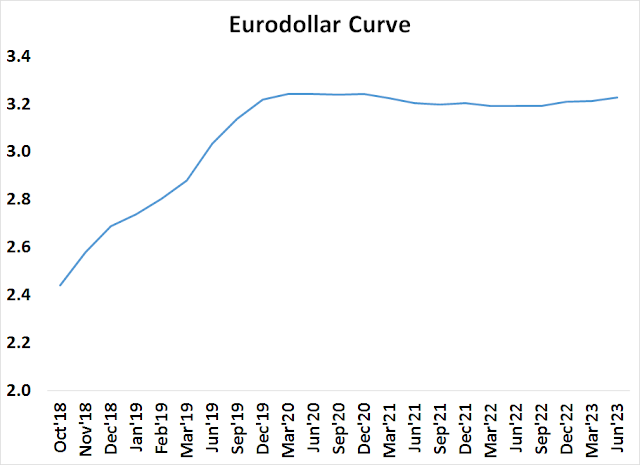
One reader astutely pointed out there are really two US Dollars that are relevant for the financial markets. There is the onshore USD, which affect terms of trade, and the operating margins of large cap companies with foreign exposure. In addition, there is the unregulated offshore USD market, otherwise known as eurodollars, whose year/year change had already breached the 5% level. Indeed, the eurodollar futures curve start to flatten and slightly invert starting in June 2020.
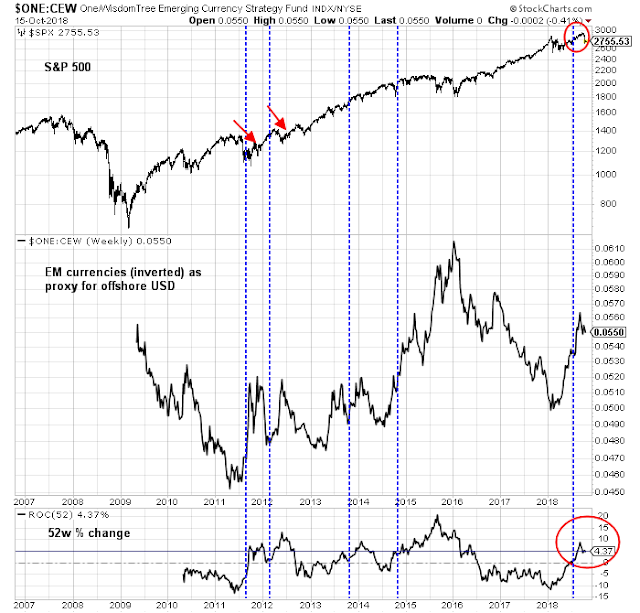
In order to analyze the effects of offshore USD stress, I used the inverse of the EM currency ETF (CEW) as a proxy for the offshore USD, as EM markets are far more vulnerable to hiccups in offshore USD shortages. As the chart below shows, a breach of the 5% year/year level has seen mixed results in the last 10 years. The stock market took a tumble only half the time.
In conclusion, this analysis shows that EM markets are especially fragile to further shocks, but fragility does not necessarily translate into bear markets. However, it does illustrate an additional risk that investors should monitor.
More signs of Chinese weakness
Another reader pointed that that Chinese car sales are tanking as a sign of weakness in the Chinese economy (via the BBC):
Car sales in China fell 11.6% in September to 2.4 million – the third month in a row of year-on-year decline.
The deceleration comes amid a slowdown in China’s economy and has pinched performance at vehicle manufacturers around the world.
At Ford, September sales in the country tumbled 43% compared with 2017, the US carmaker said on Friday.
The report followed steep declines reported earlier by Volkswagen, Jaguar Land Rover and General Motors.
Anne Stevenson-Yang of J Capital observed that car sales are correlated with property markets:
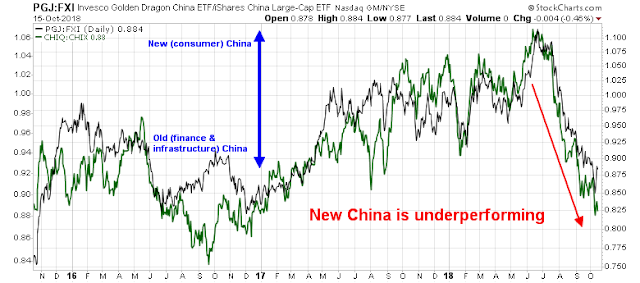
Indeed, my China pairs trades of New (consumer) China vs. Old (finance and infrastructure) China ETFs show that New China is lagging on a relative basis.
That said, I agree with Chris Balding when he stated that the greatest threat to Chinese stability is its property market, which is suffering from an off-the-charts level of financial leverage.
I am also cognizant of Anne Stevenson-Yang’s comment that cracks in the car market may be a warning of further property market weakness. I will therefore remain with my property developer stock prices as the key canary warning of trouble in the Chinese coalmine.
Insiders are buying
Lastly, some alert readers pointed out a Mark Hulbert column indicating that the “smart money” corporate insiders are buying this dip. The charts from OpenInsider confirms this assessment. Insider selling (red line) has dried up recently and fallen below the level of insider buying (blue line), which is a buy signal for this indicator.
Does that mean that stock prices will recover and rally to fresh highs?
For a longer term perspective, I analyzed the history of insider buy signals from 2007 to 2011. Excessively insider buying compared to sales have historically been good tactical buy signals and they have indicated either low immediate downside market risk or market rallies in the weeks and months after the signal. However, insiders were not perfect market timers, as they were buying all the way down after the 2007 market peak.
Bottom line: Investors shouldn’t count on insider trading as a buy signal. However, traders can use insider buying as a tactical trading signal.
Where are the bears???
For the last word, I highlight Callum Thomas’ (somewhat) long running (unscientific) equity sentiment poll done on the weekend. As the SPX cratered by -4.1% last week, you would have thought that sentiment would have deteriorated and the bears would come out in force. Instead, sentiment improved, indicating that traders were itching to pile in and buy the dip.
I interpret these conditions as the market poised for a relief rally, but the intermediate term path of least resistance for stock prices is still down. Sentiment hasn’t fully washed-out yet.
In short, market tops are processes. Both investors and traders need patience to navigate this environment.


The action at the end today was terrible. what fundamentals support a return to bullish moves aside for relief rallies? Jim Paulsen, who is usually inclined to be optimisitic, pointed out that earnings revisions after this quarter will be against the background of a 3.15% 10 year, much higher than a year ago. with oil going higher stocks have more reason to decline than rise. so it seems to me. On going Chinese weakness does not help. Bob Millman
Cars are great if u ignore the bad parts. But how many Chinese were first time buyers over the last few years? At some point you have a saturation effect and growth slows. There is replacement of course, but is there a case where car sales were going through a growth phase and now growth is slowing? I know “this time is different” are famous last words, but what happened in China in the last 30 years is different. How many people in the last 5 to 10 years have finally been able to buy a car? Maybe they will keep it for 10 years. Real estate in China makes me cringe.
In my experience, the canary in the coal mine for stock markets are the shares of asset managers. Mutual fund company stocks fell hard in bear markets and soared in the bulls. They’re a business whose margins and sales swing on the ups and downs.
BLACKROCK is the biggest asset manager today and a huge ETF provider. Here is their chart.
https://tmsnrt.rs/2PHOuYZ
I placed a red line at the 20% bear market signal point. We are a lot lower.
As per the recent question, “Is this a correction or the start of a bear market?” This chart says that the bear market started when markets peaked in January and we a well into it already.
Need more proof? Here’s the Home Builder and Auto ETF charts.
https://tmsnrt.rs/2PBTfTC
Both are well below the 20% bear market point.