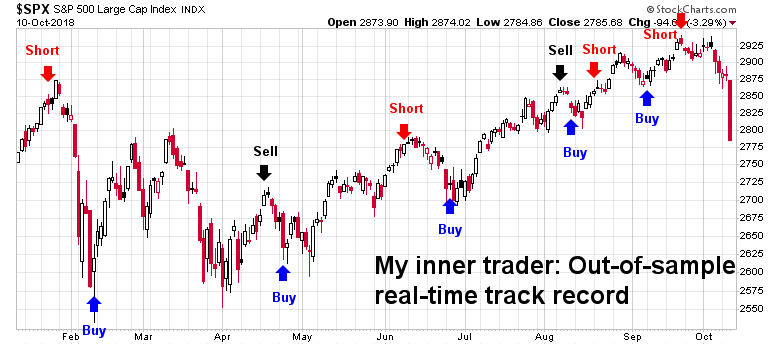
Mid-week market update: Is the correction over? At least my inner trader had been positioned for market weakness. Subscribers who had been following my inner trader, you know that we issued real-time alerts to buy the market on September 12, 2018 and flipped short on September 21, 2018. (You can subscribe here if you haven’t done so).
Where’s the bottom?
The bull case
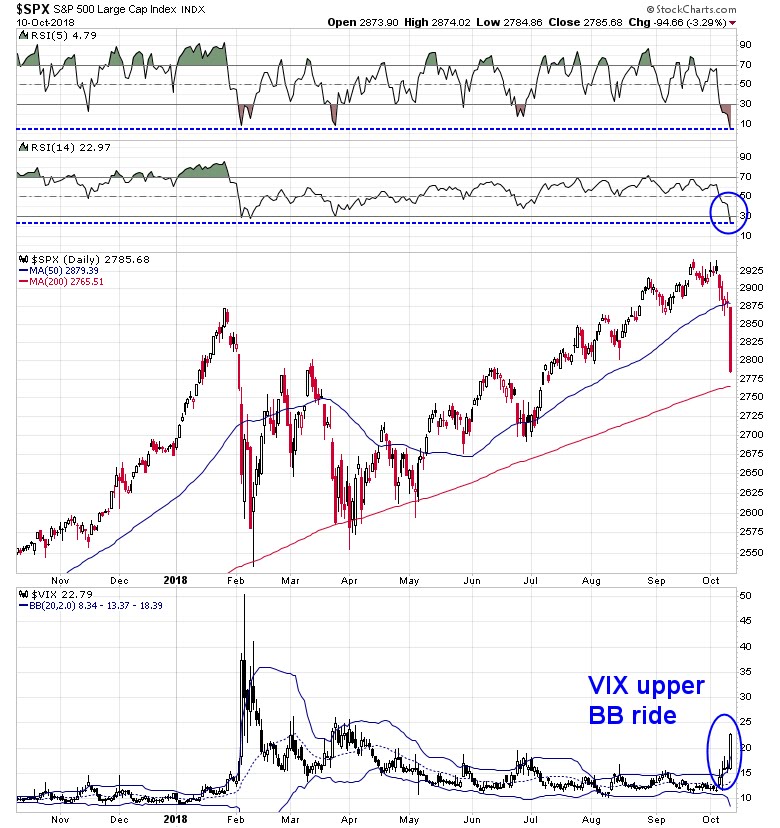
Here is the bull case. If this is a typical shallow pullback similar to the weak periods the US market has experienced since the February correction, then the bottom is near. The VIX Index spike above its upper Bollinger Band (BB) last week, which is a sign of an oversold market. Similar episodes during the post-February period has seen low downside after such signals. As well, both the 5 and 14 day RSI are more oversold than they were at the height of the February sell-off.
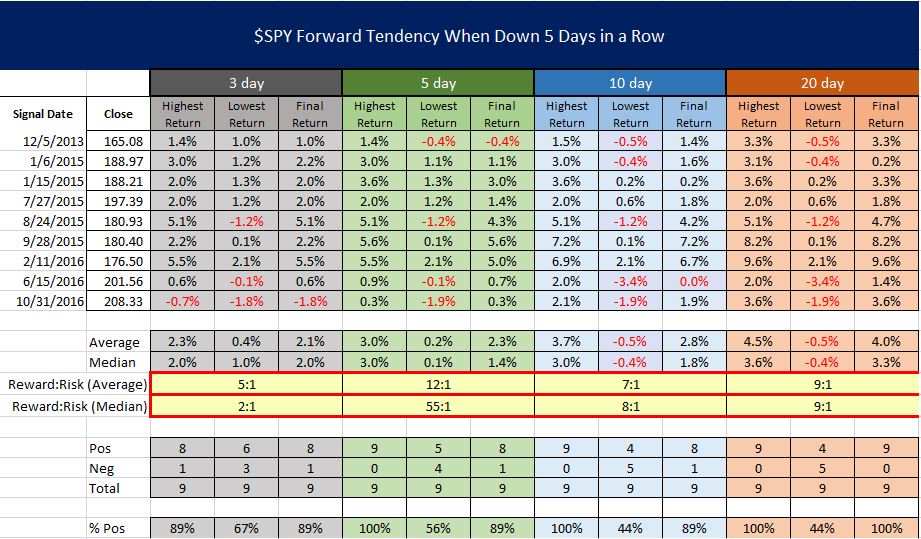
As well, there have been a number of historical studies showing what happens when SPY closes down five days in a row, which has only occurred nine times in the last five years. Such episodes have tended to be short-term bullish..
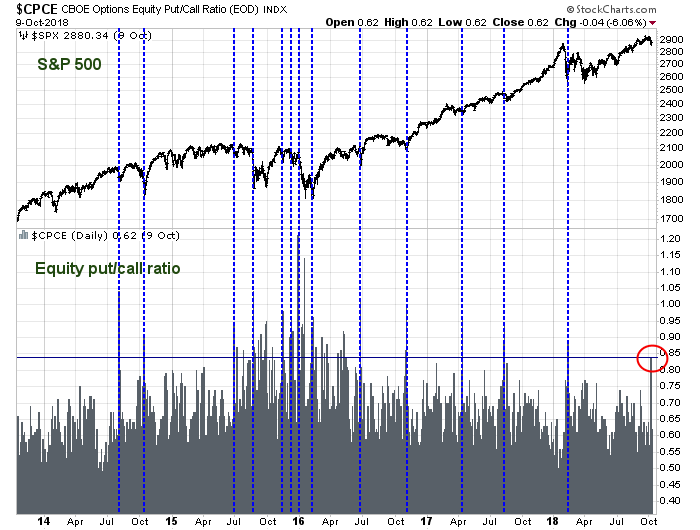
Some signs of panic are starting to appear. The equity only put/call ratio spiked to 0.84 last Friday, October 6, 2018. If history is any guide, such readings have been consistent with near-term market bottoms.
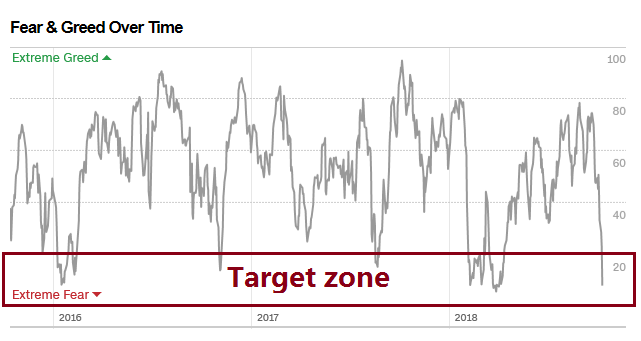
The Fear and Greed Index has plunged to 8, which is at levels seen in past market bottoms.
Breadth and momentum sell signals have reached their initial downside target. I am indebted to Urban Carmel, who pointed out that whenever NYSI has turned negative, the market has suffered minimum drawdowns of 5%. Peak-to-trough decline reached 5% today.

These readings suggest that the market is ripe for an oversold rally. On the other hand, there are a number of other indicators that point to a deeper correction.
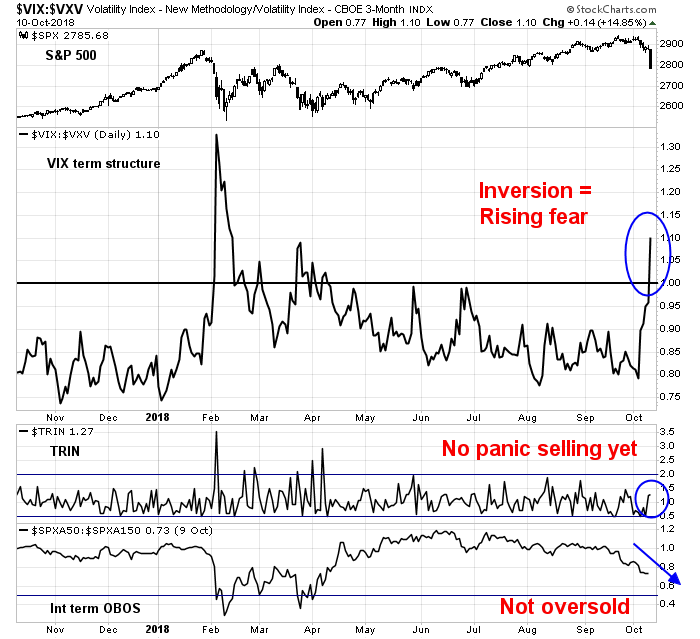
One of the nagging doubts leading to the conclusion that a short-term bottom is in is the lack of investor capitulation. Only one of the three components of my Trifecta Bottom Spotting Model is flashing a bullish signal. The term structure of the VIX Index only inverted today, indicating that fear is only started to creep into traders’ psychology. On the other hand, TRIN has not spiked above 2 during the latest pullback. A closing TRIN reading above 2 is typically a sign of price insensitive selling, which are signs of a “margin clerk” or “risk manager” market where participants are forced to liquidate long positions. As well, the intermediate term overbought/oversold model is not in oversold territory yet.
Adding insult to injury, Business Insider report that it has been the stocks with the greatest hedge fund ownership that have fallen the most.
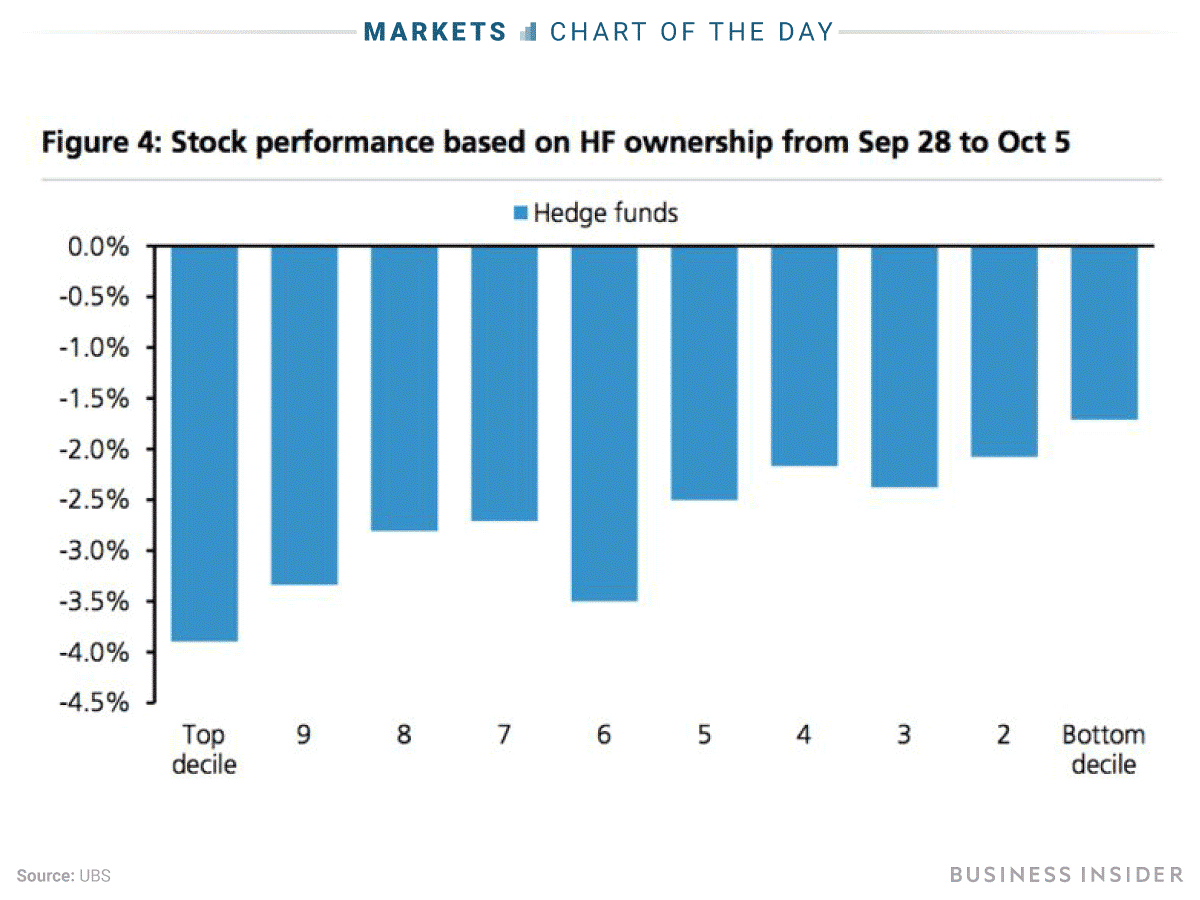
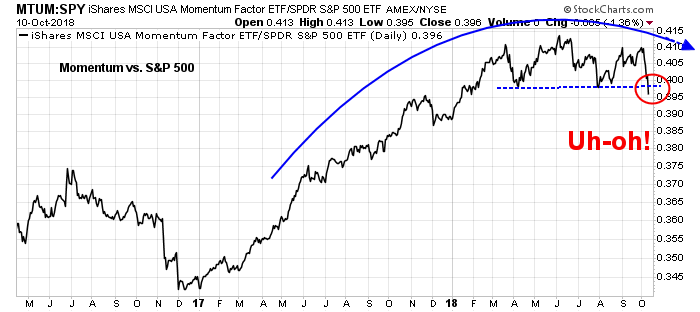
If fast money drove this decline, then it is consistent with my past observation of the poor relative performance of the price momentum factor. Moreover, the relative breakdown of the price momentum inflicted too much technical damage that can be papered over with just an oversold rally.
The selling may not be over. Zero Hedge (bless their bearish hearts) reported that equity market weakness has prompted trend following CTAs to liquidate their long positions and go short.
Last week, just before the stock market tumbled on the heels of sharply higher rates, we noted that one of the key culprits behind and indiscriminate selloff, systematic CTA funds, were not yet present. Specifically, as Nomura’s Charlie McElligott said the bank’s latest CTA model showed that systematic-trend funds were “at- or near- deleveraging “triggers” however not quite there yet.
That’s no longer the case.
According to the latest update from Nomura’s cross-asset quant, CTA deleveraging (as 2w and 1m window short-term models flip “short”) has finally kicked in, creating -$66B of SPX for sale as “Long” position goes from +97% to +77% and then ultimately to +57% on the break below below 2895 (assuming futures levels “hold lower” at the close), a threat then can “self-fulfill” with front-run flows.
If the bulls were to have any chance of regaining control of the tape, price momentum has to at least show some signs of stabilization before a durable bottom can occur.
The biggest near-term fundamental challenge for stock prices is Q3 earnings season. The latest update from FactSet shows that forward 12-month EPS is still being revised upwards, but Q3 guidance is worse than the historical average.

I will be watching closely the guidance that companies give for Q4 and beyond. What will they say about tariffs, or labor costs and their effects on operating margins, especially in light of Amazon’s decision to raise their minimum wages to $15, and Starbucks offer of backup childcare for employees at only $1 per hour?
Q3 earnings report kick off this Friday with a number of major banks (C, JPM, WFC), and begin in earnest next week. Stay tuned. There is a risk that earnings disappoint, or the tone of the guidance negative. In that case, downside risk will be a lot higher than current market expectations.
On the other hand, technical conditions are sufficiently oversold to expect a short-term bounce. My inner trader is inclined to take partial profits in his short positions, and then wait for the rally to re-establish his full bearish positions.
From a risk control perspective, please be reminded that falling markets tend to exhibit above average volatility. Traders should therefore adjust their positions accordingly.
Disclosure: Long SPXU
As per my weekend post, the global market environment is much like 2015 with global ex-US markets close to or already in bear markets and important industries in America in recession (housing and autos). Note in the charts above the cluster of oversold readings in August 2015. Also note that this was a deep dive, not a minor pull back.
When will the markets recover their bullish mojo? When the macro reading of the cause of the current problems turn around. That is riding interest rates and trade war. Both are a long way from changing. That tells me to err on the cautious side for the foreseeable future.
Expect the pain of higher interest rates to intensify in real estate and auto and spread to other consumer sectors. Banking stocks are also already getting hurt. Expect the pessimism from these sectors to spread to the high flying technology and internet stocks that likely got very overvalued.
Cam had turned more cautious with his longer term portion of his portfolio at what looks like an excellent point.
Sorry to be so glum. Long term readers know I’m not a perma-bear. In early 2016 I was as vocally bullish when most others were bearish as I’m the opposite today.
Looks like an Exacta bottom spotter signal did trigger at the close today. Does that change your inner trader positioning?
This suggests that we are getting close to a bottom. The only question is whether it will be V shaped or W shaped.
Best guess (and only a guess) is a W. We bounce and then come back and test support while exhibiting positive divergence.
Hi Cam, why would your guess be W-shaped and not V-shaped?
To get a V-shaped recovery, you need panic. So far, we have seen what has been mostly an orderly retreat with oversold conditions, which suggests a short-term bounce. Under those conditions, the market needs to decline again in order to achieve a sentiment washout.
I have trust issues, so I tend to focus on conspiracies and manipulation. So I’m wondering if this is a bear trap. Trade with China agreement coming? Somebody knows? As we approach the elections…the timing is right.
We could see an October Surprise (that’s why they are called surprises), but it’s highly unlikely that we are going to see any US-China deal happening anytime soon. First, both sides aren’t even really talking.
Second, the Bloomberg story about the motherboard chip hack, which was vehemently denied by Apple and Amazon, and whose denial was supported by DHS and the UK, have the smell of a clumsy US intelligence effort (talk about conspiracy theories) to discourage western companies from buying Chinese electronics. This looks like the start of a Cold War, not the start of warmer trade relations.
All of this makes me think of the scene in The Princess Bride where they are about to drink the poison wine. Do we ever know the real story?
Hi Cam, why would your guess be W-shaped and not V-shaped?
Sorry for duplicate post. Thank you for your reply above, which was “to get a V-shaped recovery you need panic.” What would be your metric/threshold for panic? Thank you.
Hey Cam, after today, did you see the trifecta trigger occur?
TRIN not above 2 yet. If we get forced selling, you usually see TRIN spike in the last hour as it is forced “margin clerk” selling.