Mid-week market update: The midterm election performed roughly as expected. The Democrats regained control of the House, and the Republicans held the Senate and even made some gains. Is this bullish or bearish for equities? It depends on your time frame.
Here is my outlook from a strictly chartist’s viewpoint, starting with the long-term to the short-term.
From a very long-term perspective, the negative monthly RSI divergence and MACD sell signal is too worrisome to be ignored. These conditions suggest that the market is making a broad-based top.

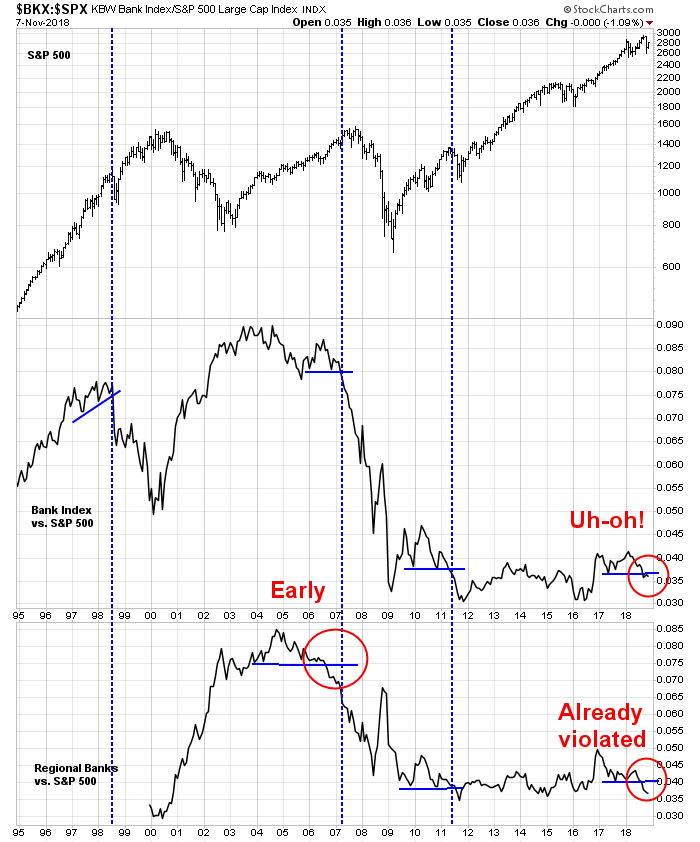
The latest MACD sell signal is unlikely to be resolved with a minor 2015 style correction. The technical breach of the relative performance of bank stocks, which was accompanied by a similar relative support violation of the regional banks, is another warning that a major decline is under way.
That said, nothing goes up or down in a straight line.
Prepare for the year-end rally
However, intermediate-term indicators are sufficiently oversold to expect a relief rally into year-end. The normalized equity-only put/call ratio was highly stretched and it has begun to mean revert, which is a classic buy signal.

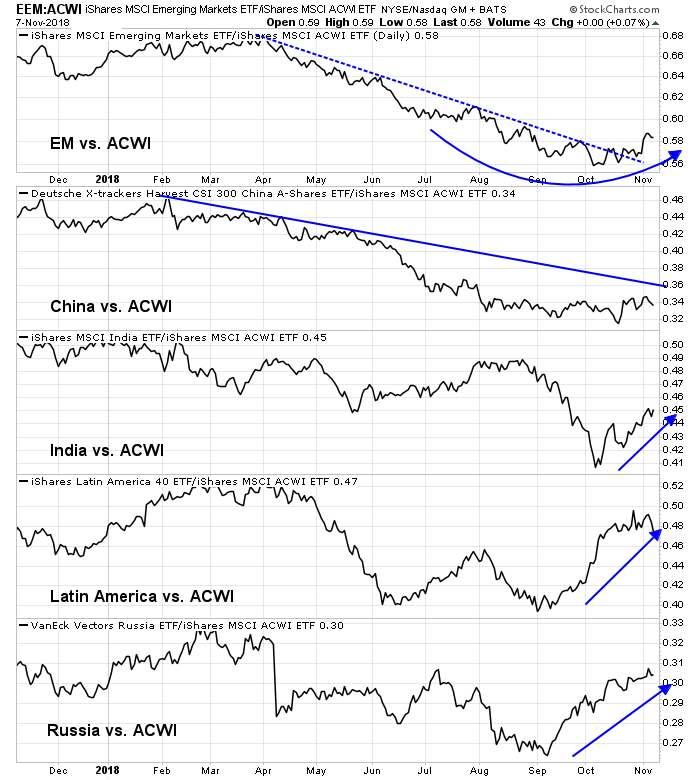
There are other signs that risk appetite is recovering. Emerging market stocks, which have been badly beaten up in the latest downturn, have begun to show some signs of life. EM equities (EEM) compared to the MSCI All-Country World Index (ACWI) have rallied through a relative downtrend. The performance of the other major components show that all regions, except for China, are showing signs of relative strength.
There is much evidence that stock prices perform well after midterm elections. Here is one example of the historical pattern from CNBC.

However, I would temper those expectations by pointing out that there are many ways of analyzing the historical data. The same CNBC report showed that Fundstrat found equities perform well only when House control remains unchanged, which is not the case in 2018.

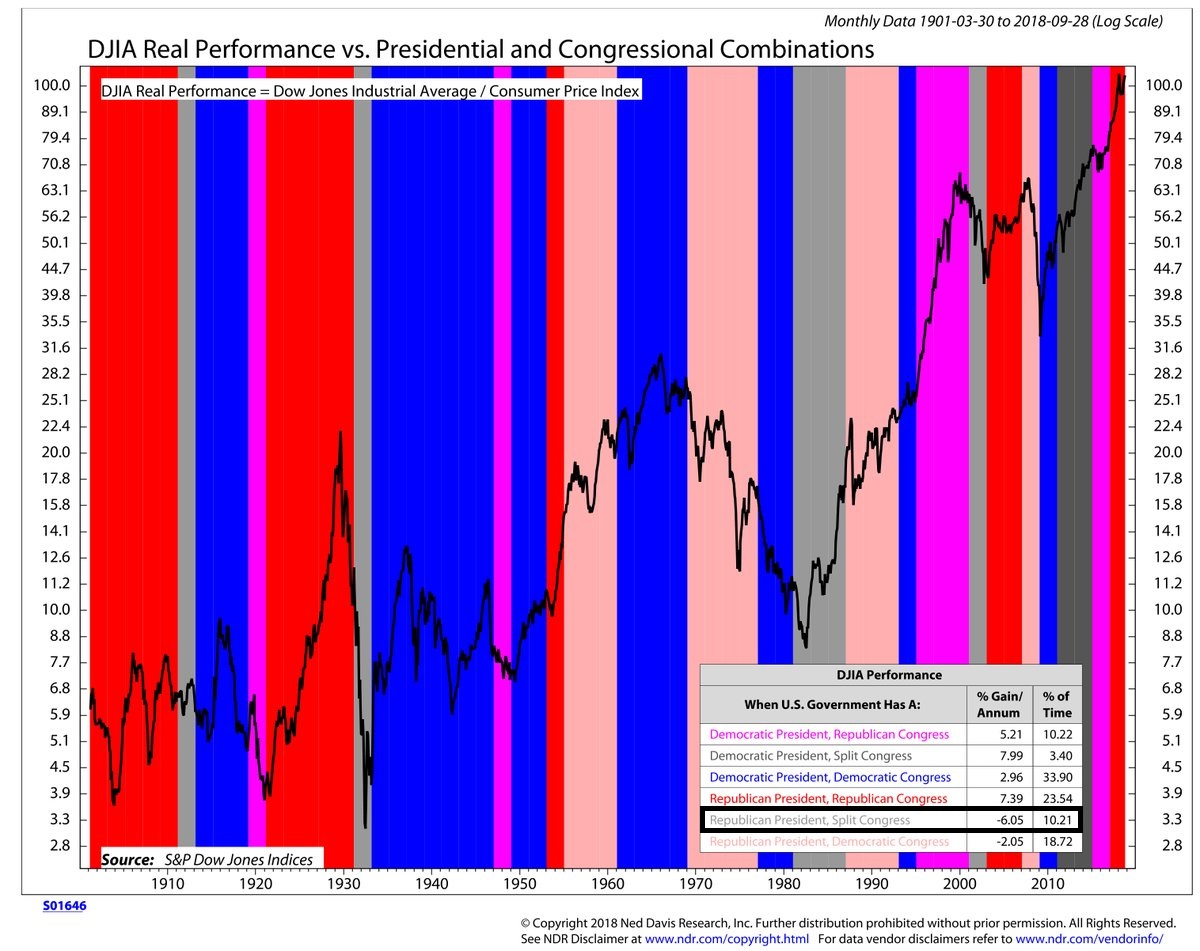
In the last 100 years, Ned Davis Research found that the combination of a Republican president and a split Congress occurs about 10% of the time, and the DJIA’s annualized return is -6.1% during those instances.
Short-term overbought
In the very short-term, the market was already at overbought extremes as it approached election night Tuesday. Conditions are going to be even more extended after Wednesday’s rally.

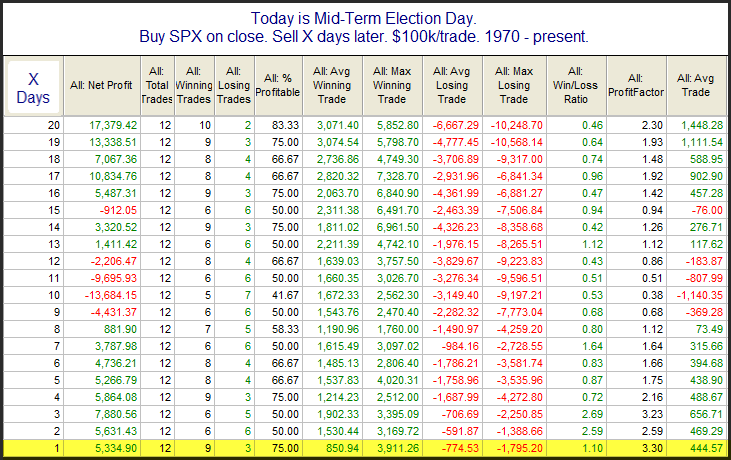
Rob Hanna at Quantifiable Edges did not find a short-term trading edge after the midterm elections, except for a one-day rally after the election.
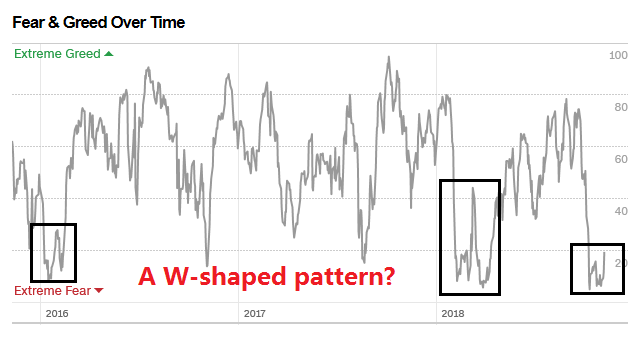
The most likely short-term scenario for the market is it chops around a bit more, as the Fear and Greed Index did during past W-shaped bottoms.
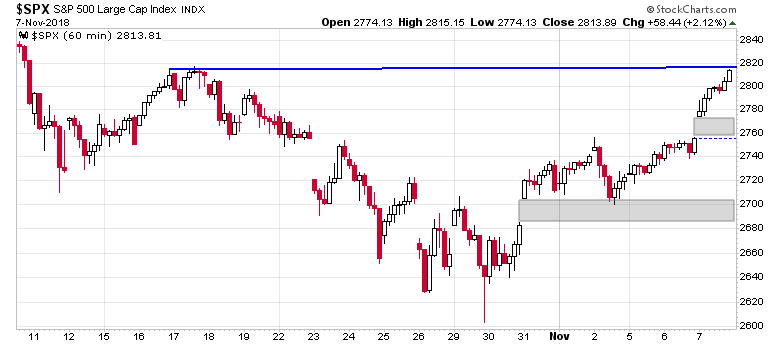
In conclusion, how you should behave is a function of your time horizon. The stock market appears to be making a broad-based top, but it is also in the process of making an intermediate bottom, and a year-end rally is likely. Tactically, however, stock prices are highly overbought and will probably pull back and possibly test the recent lows. At a minimum, expect one or both of the gaps below to be filled first before the the market can mount a sustainable rally.
Disclosure: Long SPXU
Huge underperformance this week from lagging Europe especially leader Dax – which does not bode well for overall market. So far late 2018 price action follows 2007. If they manage to rally into Santa, January 2019 will be deadly.
Inner trader is short from Nov 2 right? Did you add to SPXU today?
No. I was at the doctor for most of the day so I didn’t have time to watch the market closely.
Hope all is well. The dip buying is suddenly back which is scary
Quantifiable Edges has a Twitter post noting that today was an IBD “follow through day”. Could this turn out to be a V Bottom? Seems like lots of trapped bears here… Do you have any resistance level above which your inner trader would cover the short and reverse long?
If you look at his analysis, the success rate of IBD FTDs is ok but nothing spectacular:
http://quantifiableedges.com/follow-through-days-quantified/
Cam – I am a doctor if ever need advice…
Thank you for the offer. It was just my annual physical.
We are due for a dip, and my guess is we grind up higher eventually, but that’s the problem with short term stuff, so much noise.The low in late October was on lower volume than the low 2 weeks before, so will the late October low hold for now?
Seems you’re short term bullish, long term bearish.
With most bullish months of yr here, why not be long now, or flat, and wait for better time to sell?
Depends on you time horizon. If you are building a portfolio with a greater than a decade horizon, a pull back of say 25% may be a good opportunity to buy. A further 25% pull back may be an opportunity to back up the truck and buy as much possible.
If you are within five (or even ten) years of your target retirement, prudence dictates cutting back stock market exposure. What is in the back drop is a looming possibility of a US recession because of Fed policy mistake and trade tariffs. Both are starting to show up in stock market earnings.
Can anyone comment on how much pull back is likely without a US recession?
If there is no recession, I doubt if there is much downside risk. S&P 500 is trading at 16x forward earnings, which is between the 5 and 10 year averages. Valuation looks ok, and insiders are buying.