Preface: Explaining our market timing models
We maintain several market timing models, each with differing time horizons. The “Ultimate Market Timing Model” is a long-term market timing model based on the research outlined in our post, Building the ultimate market timing model. This model tends to generate only a handful of signals each decade.
The Trend Model is an asset allocation model which applies trend following principles based on the inputs of global stock and commodity price. This model has a shorter time horizon and tends to turn over about 4-6 times a year. In essence, it seeks to answer the question, “Is the trend in the global economy expansion (bullish) or contraction (bearish)?”
My inner trader uses the trading component of the Trend Model to look for changes in the direction of the main Trend Model signal. A bullish Trend Model signal that gets less bullish is a trading “sell” signal. Conversely, a bearish Trend Model signal that gets less bearish is a trading “buy” signal. The history of actual out-of-sample (not backtested) signals of the trading model are shown by the arrows in the chart below. The turnover rate of the trading model is high, and it has varied between 150% to 200% per month.
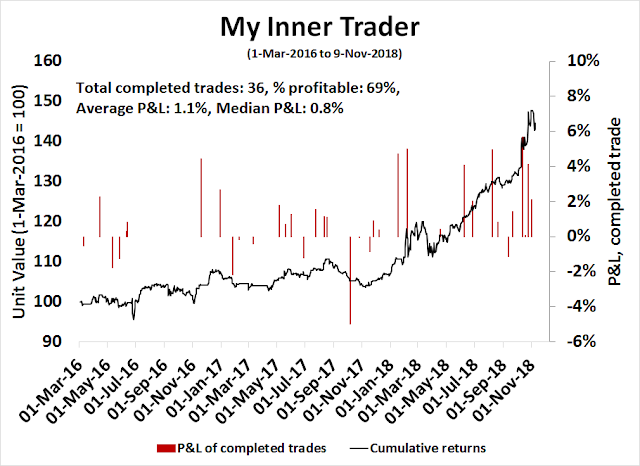
Subscribers receive real-time alerts of model changes, and a hypothetical trading record of the those email alerts are updated weekly here. The hypothetical trading record of the trading model of the real-time alerts that began in March 2016 is shown below.
The latest signals of each model are as follows:
- Ultimate market timing model: Buy equities
- Trend Model signal: Bearish
- Trading model: Bearish
Update schedule: I generally update model readings on my site on weekends and tweet mid-week observations at @humblestudent. Subscribers receive real-time alerts of trading model changes, and a hypothetical trading record of the those email alerts is shown here.
Insiders are buying
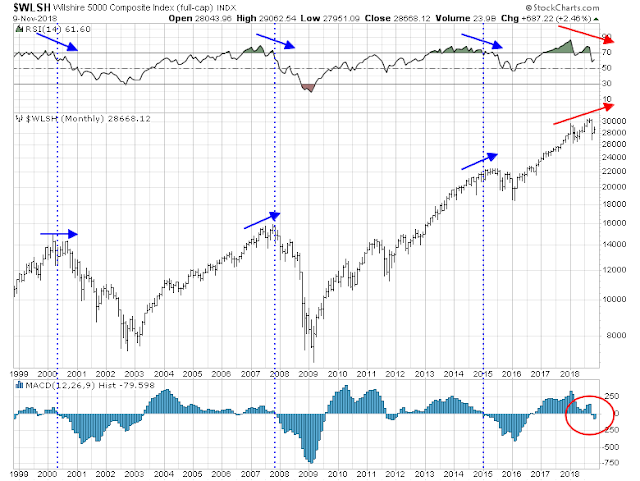
Regular readers will know that I have been sounding cautionary technical warnings because of a negative monthly RSI divergence and a MACD sell signal for US equities. This combination has been uncanny in the past at warning of major market tops.
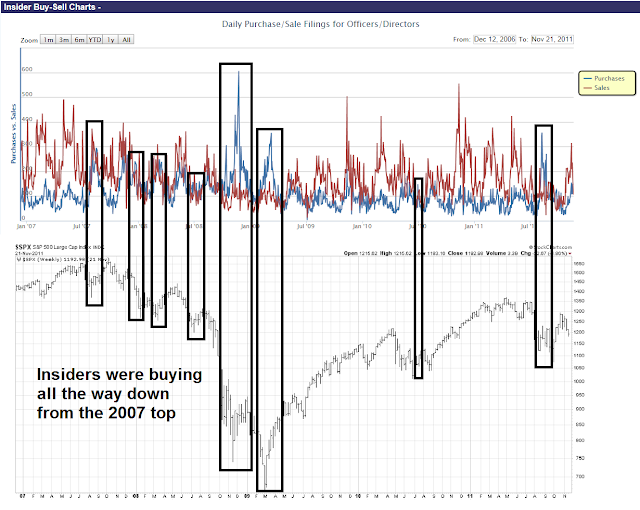
On the other hand, the latest report from Open Insider shows that corporate insiders, who are known as “smart investors”, have been buying the latest dip. Historically, sales (red line) exceed buys (blue line) by a significant margin. A funny thing happened during the latest correction. Sales dried up, and buys exceeded sales, which is an indication that insiders are showing confidence in the share price outlook of their own companies.
How can we square the circle of these two contradictory signals? Should investors be buying or selling equities?
The valuation bull case
Here is how corporate insiders are probably seeing the market. Simply put, valuations are attractive. The latest update from FactSet shows that the market is trading an undemanding forward P/E ratio of 16.0, which is below the 5-year average of 16.5, and above the 10-year average of 14.5.
From that point of view, the recent price dip was a gift from the market gods. Stock prices just went on sale. Why shouldn’t insiders be buying?
What are the risks?
As a group, insiders are generally known to have better knowledge about their companies and the industry conditions their companies operate in, they are not always prescient about the future. As an example, we saw several clusters of insider buying on dips after the market top in 2007. In fact, insiders were buying all the way down to the 2009 bottom.
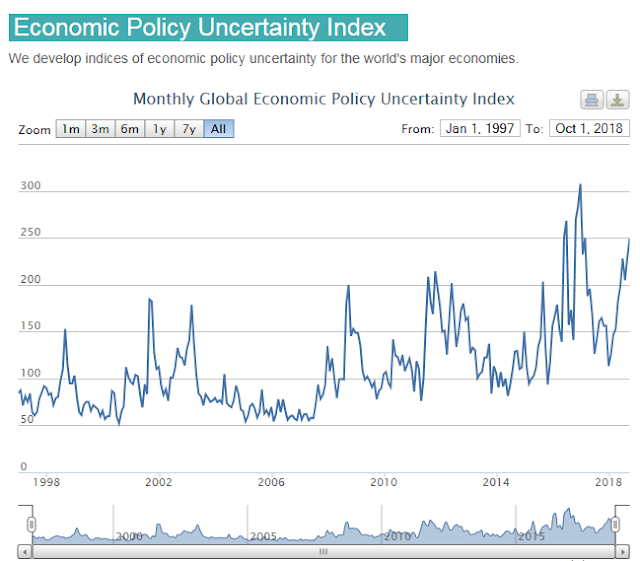
I believe that the bullish signal from insider buying should be offset by the risks of rising economic policy uncertainty.
The bear case
Here is the bear case to the valuation thesis. What if conditions changed sufficiently that tanked earnings? I offer two possible scenarios.
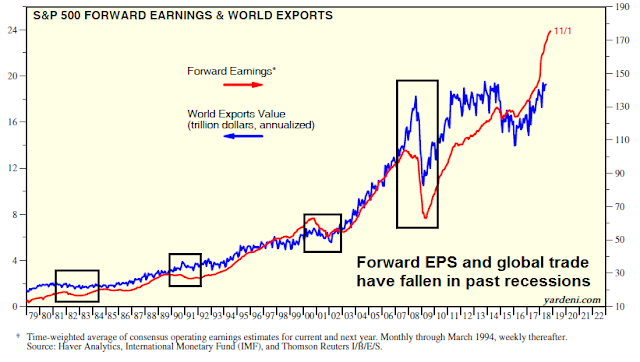
First, the US and China appear to be headed towards a full-blown trade war. In the past, recessions have caused world exports to fall. Could the tail wag the dog this time? Could falling global trade cause a recession, and a decline in earnings expectations?
The IMF has estimated that a full-blown trade war would reduce US real GDP growth by about 1%. China’s GDP would fall by 1.6%, and the rest of Asia would also get sideswiped by trade tensions.
The latest FOMC Summary of Economic Projections (SEP) shows that the median estimate of real GDP growth is 2.5% in 2019 and 2.0% in 2020. If IMF projections are correct, then we could see those figures fall to 1.5% and 1.0% respectively.
Indeed, the Fed is projecting already a significant slowdown in 2021, as the unemployment rate rises 0.2% from 3.5% in 2020 to 3.7% in 2121. The 0.2% rise in unemployment is very close to the recession threshold outlined by the (then) New York Fed president Bill Dudley who observed that the economy fell into recession whenever the unemployment rate rose more than 0.3% to 0.4%,
A particular risk of late and fast is that the unemployment rate could significantly undershoot the level consistent with price stability. If this occurred, then inflation would likely rise above our objective. At that point, history shows it is very difficult to push the unemployment rate back up just a little bit in order to contain inflation pressures. Looking at the post-war period, whenever the unemployment rate has increased by more than 0.3 to 0.4 percentage points, the economy has always ended up in a full-blown recession with the unemployment rate rising by at least 1.9 percentage points.
What’s the downside risk under such a scenario? Supposing we were to pencil in a 10-20% fall in EPS estimates from a trade war. In the past, forward P/E ratios have experienced compression during economic slowdowns.
History shows the minimum forward P/E compression has been 2-3 points, and it has been considerably higher during more severe recessions. However, I don’t believe that P/E ratios are likely to fall very much, as institutional investors have largely already de-risked their portfolios. Assuming that forward P/E ratios fall by 2-3 points, and estimates decline by 10-20%, equity downside risk is 20-30%.
What if matters were to get worse? The Fed has made it clear that it is embarked on a slow but steady rate normalization policy. There has been no discussion of when it might pause its rate hikes, and many analysts have concluded that the Fed will continue to raise until something breaks. What if the Fed were to make such a policy mistake and react too slowly to signs of a slowdown?
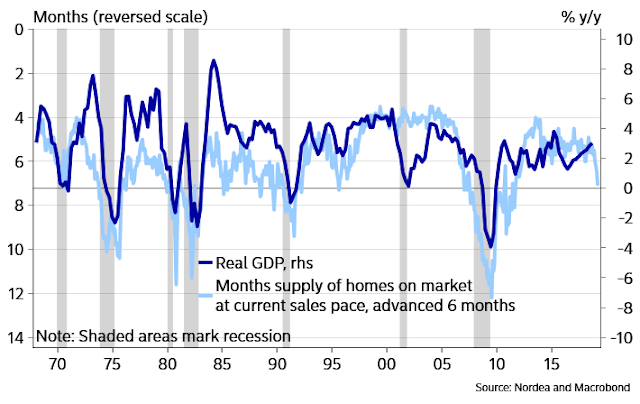
Since the effects of monetary policy operate with a lag, the 2020 SEP median GDP growth rate of 1.0% under the IMF’s trade war scenario is at risk of turning negative. Already, cyclically sensitive industries such as housing appears to be peaking out. In the past, growth has slowed whenever housing inventory has spiked. Will the current episode tip the economy into recession?
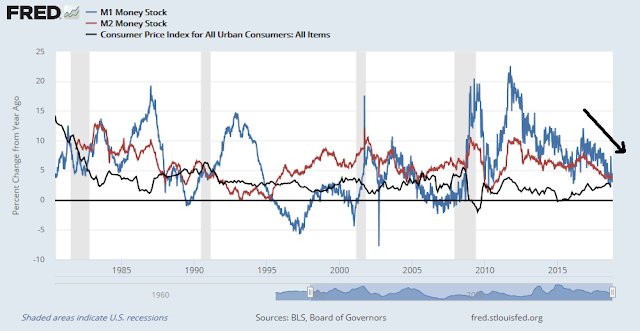
Monetary indicators, such as real money growth, are decelerating and on the verge of turning negative, which would represent another recession warning.
The price downside risk for equities under the conditions of a double whammy of a Fed policy error and full-blown trade war would be considerably more than 20-30%.
Resolving the macro and technical outlook
So how can we resolve the apparent bullish outlook shown by corporate insiders and the poor technical outlook shown by the charts? Here is what the market is saying.
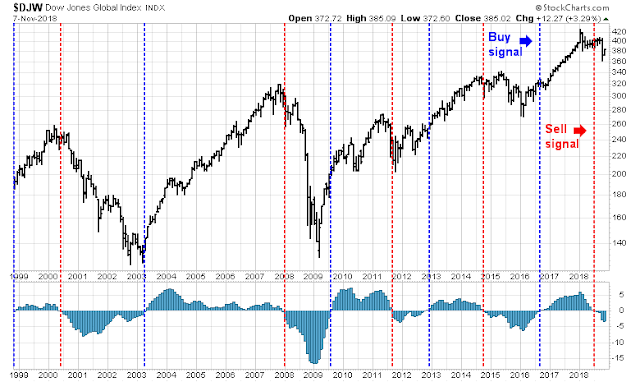
The monthly MACD sell signal for US equities is actually late. World equities already flashed a MACD sell signal in July. Non-US stock markets have been discounting a global slowdown for several months.
The message from the market is, “We are worried about policy risk.”
Here is what I would watch for. I recently wrote about the rise of recession risk (see A recession in 2020?). While my long leading indicators are not flashing red, they are flickering. Investors need to monitor the evolution of recession risk.
In conjunction with conventional macroeconomic analysis, we also need to pay attention to global growth risks posed by rising trade tensions. Should the US impose a further round of tariffs on Chinese imports in January, the anticipated effects will be far more consequential to US growth than the previous round because the new tariffs will be on intermediate goods, which are production inputs into American products. A new IMF paper, Macroeconomic Effects of Tariffs, shows the negative effects on economic output and productivity if tariffs are imposed on inputs (top panels) compared to outputs (bottom panels).
In addition to any progress between the scheduled Xi-Trump talks at the G20 meeting in late November, investors may be well-served to monitor any changes in the Trump administration during the post-election period. Cabinet secretaries and administration officials often turn over after the midterms. For example, if Steve Mnuchin at Treasury or Wilbur Ross at Commerce were to leave, but the Peter Navarro and Robert Lightizer were to stay, it would signal a more protectionist turn in American policy. In a late breaking development, CNBC reported Friday that Trump is considering replacing Wilbur Ross with former WWE executive Linda McMahon as Commerce Secretary by the end of the year.
As I pointed out in the past (see Was the market swoon made in China?), the effects of the Trump tariffs are just starting to show up in Q4. If there is no further progress in the trade talks, more sanctions will hit the Chinese economy starting January 1, 2019.
In conclusion, while corporate insider buying presents a possible opportunity to buy stocks, the valuation appeal of stocks is offset by the risks of macro policy uncertainty. Investors should assess recession risk, and the evolution of the Sino-American trade policy risk before following the risk-on policy adopted by corporate insiders.
The week ahead: Waiting for clarity
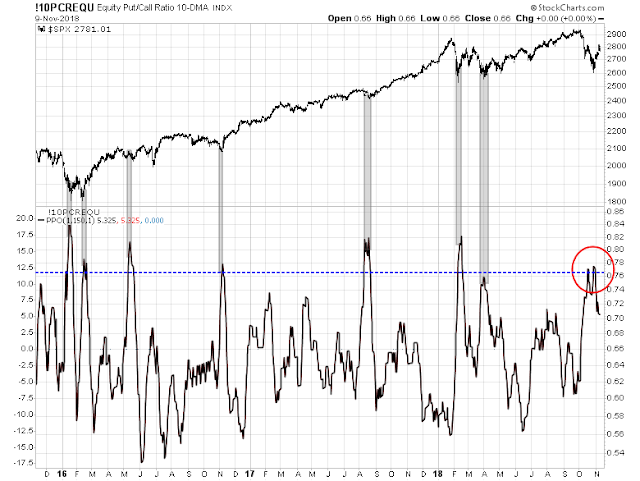
In my last post (see Bullish or bearish? What’s your time horizon?), I wrote that the market appears to be undergoing a bottoming pattern. However, it is unclear whether a final bottom has been made. We should get more clarity in the week ahead. Intermediate sentiment such as the normalized equity-only put/call ratio indicates a market that is poised to rally.
Mark Hulbert also pointed out that his survey of market timers are more bearish than they were at the February bottom, which is contrarian bullish.
As well, an examination of the 4-8 week market reaction to insider buying clusters during the 2007 top shows that the market has tended to rally after such episodes. Even if you believe that the top is in, you should still expect a reflex rally.
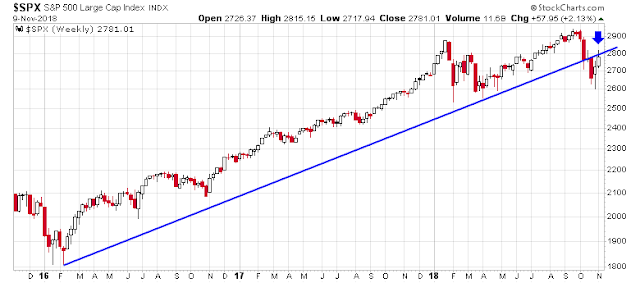
If the stock market were to strengthen, the challenge facing the bulls is to break uptrend resistance after its violation.
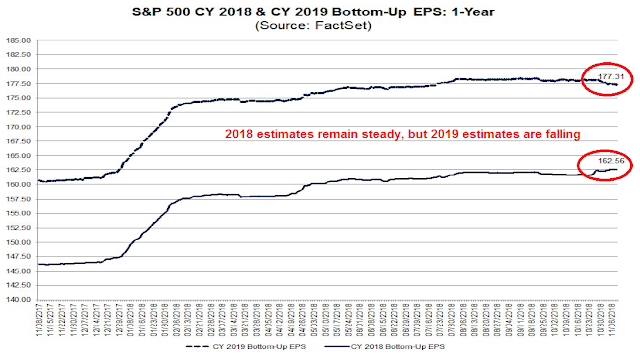
However, a number of indicators suggest that stocks may have to decline first before prices can rally in a sustainable manner. The latest update from FactSet was somewhat disturbing. Despite the above average results from Q3 earnings season, forward 12-month EPS fell last week. As forward EPS estimates are coincidental with stock prices, it is unclear whether this is just a data blip or something more concerning.
Further analysis shows that the decline in forward EPS was attributable to cuts to 2019 earnings. 2018 EPS estimates remain steady. If this trend of 2019 downgrades continues into next week, the market may be spooked by the outlook for next year.
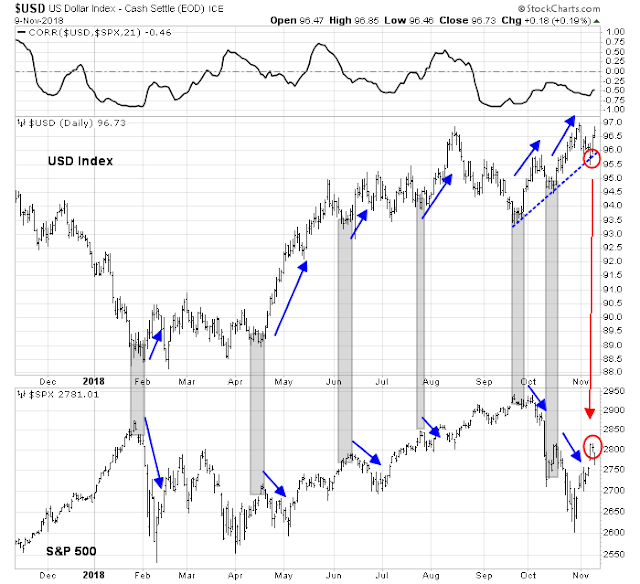
Traders should also watch the USD. While this is not a perfect relationship, USD rallies in the past year have coincided with stock market weakness. The USD Index bounced off trend line support last week and it is advancing. If recent history is any guide, this should translate into further equity weakness.
The post-election rally last Wednesday qualified as an Investors Business Daily Follow Through Day (FTD), which is evidence of a breadth thrust. Such breadth thrusts are interpreted to be bullish, but Rob Hanna`s study of FTD found only a success rate of 55% after such episodes. As a reference, the market tends to rise 56% of the time on a weekly time frame, and 61% of the time monthly. Therefore a 55% success rate is nothing to get overly excited about.
Last week’s SPX rally stalled at a key Fibonacci retracement level, and ended the week with two unfilled gaps below. Whether the gaps get filled is an open question. What is constructive is the index closed about its 200 day moving average (dma). However, the equal-weighted SPX was unable to rally above its 200 dma, which represents a minor negative breadth divergence.
Short-term breadth market indicators is retreating from an overbought reading, which is a classic sell signal for traders. I am inclined to wait for this indicator to fall to at least a mild oversold condition before reversing to the long side.
My inner investor has de-risked his portfolio and he is at his minimum equity weight. My inner trader was caught short during last week’s rally, but he remains short in anticipation of lower prices next week. He will re-evaluate his positioning once he gets greater clarity from next week’s market action.
Disclosure: Long SPXU







Lakshman Achuthan of Economic Cycle Research Institute was interviewed by Michael Santoli of CNBC last week. He pointed out that while the economic headlines look great (unemployment rate, GDP growth, etc.) the underlying rate of change is decelerating indicating future economic weakness. I’m wondering what you think of Achuthan’s work.
I agree with the deceleration, as I am seeing the same in my long leading indicators. That said, ECRI had an impeccable forecasting record until their false recession signal a few years ago.
ECRI has generally been pretty stellar in their calls.
I agree. They just had that unfortunate call that they were stubborn and wouldn’t reverse. We all make mistakes.
Cam, on your Inner Trader chart, it might be more intuitive for readers if you make profitable trades green and drawdowns as red. Cheers.
Seasonality tends to favor a rally for the next two months. That said, the bear market in 2007 started in December 2007, circa 15th December, ahead of Santa Claus rally (the rule of thumb failed). Tactically, one could cut equity exposure on 1 January 2019, allowing one full year to pay taxes on capital gains, if the rule holds, and the assumption that we are seeing a major market peak holds true, as Cam has made a cogent argument.
If November closes below 200 DMA, all bets are off (October closed below 200 DMA, a second back to back month close below 200 DMA would be pretty bearish).
For longer term buy and hold portfolios, with longer than a decade to retirement, a 30% pull back in equities (see above) would be good time to buy. For portfolios closer to retirement, de risking as Cam has suggested may be prescient.
I feel that Trump &Xi will signal progress in trade talks later this month. Both politicians realiz
e that it is not in their interest to have the economy falter. Trump is not as crazy as most people think..he likes to play games ®ardless the outcome of trade talks he will declare victory, ala NAFTA.
Possible right shoulder of inverted Head and Shoulders bottom today?
Anything is possible but don’t get ahead of yourself. A H&S formation can’t be confirmed until the neckline breaks, and we are a long way from that.
Cam, just saw alert on SPXL, are you looking at 2800 again for holidays? What about IWM – can this test 200D before rolling over?