Preface: Explaining our market timing models
We maintain several market timing models, each with differing time horizons. The “Ultimate Market Timing Model” is a long-term market timing model based on the research outlined in our post, Building the ultimate market timing model. This model tends to generate only a handful of signals each decade.
The Trend Model is an asset allocation model which applies trend following principles based on the inputs of global stock and commodity price. This model has a shorter time horizon and tends to turn over about 4-6 times a year. In essence, it seeks to answer the question, “Is the trend in the global economy expansion (bullish) or contraction (bearish)?”
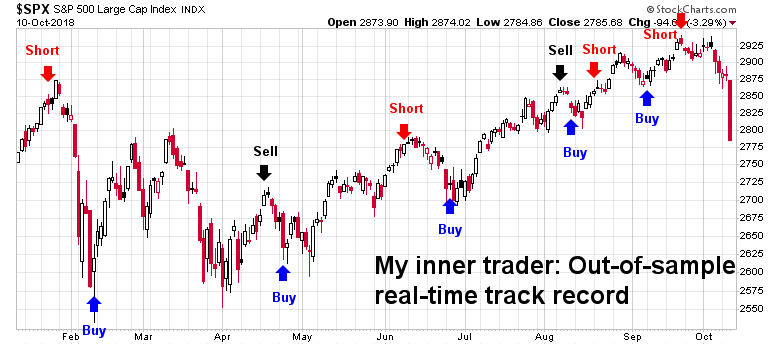
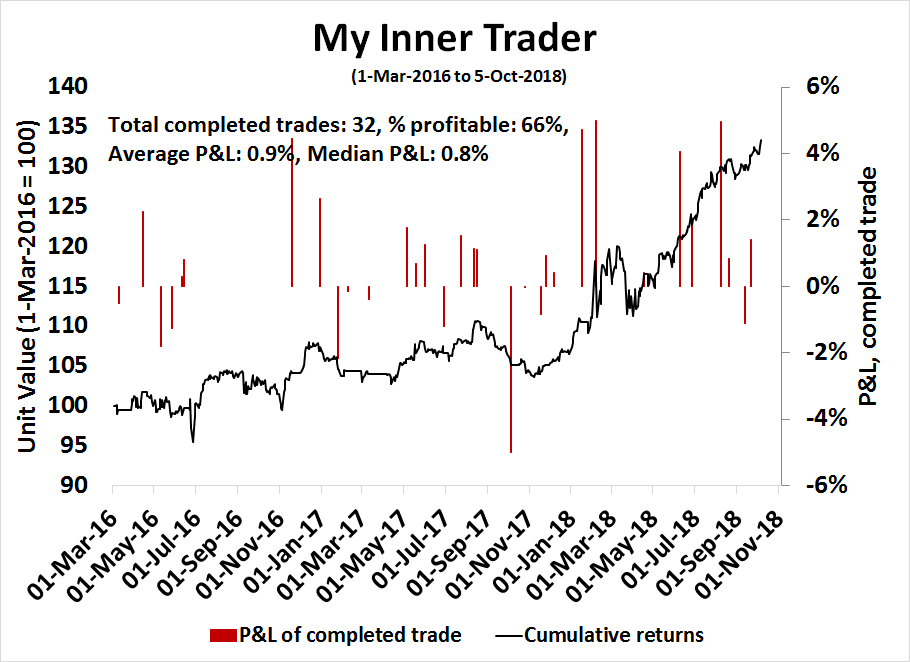
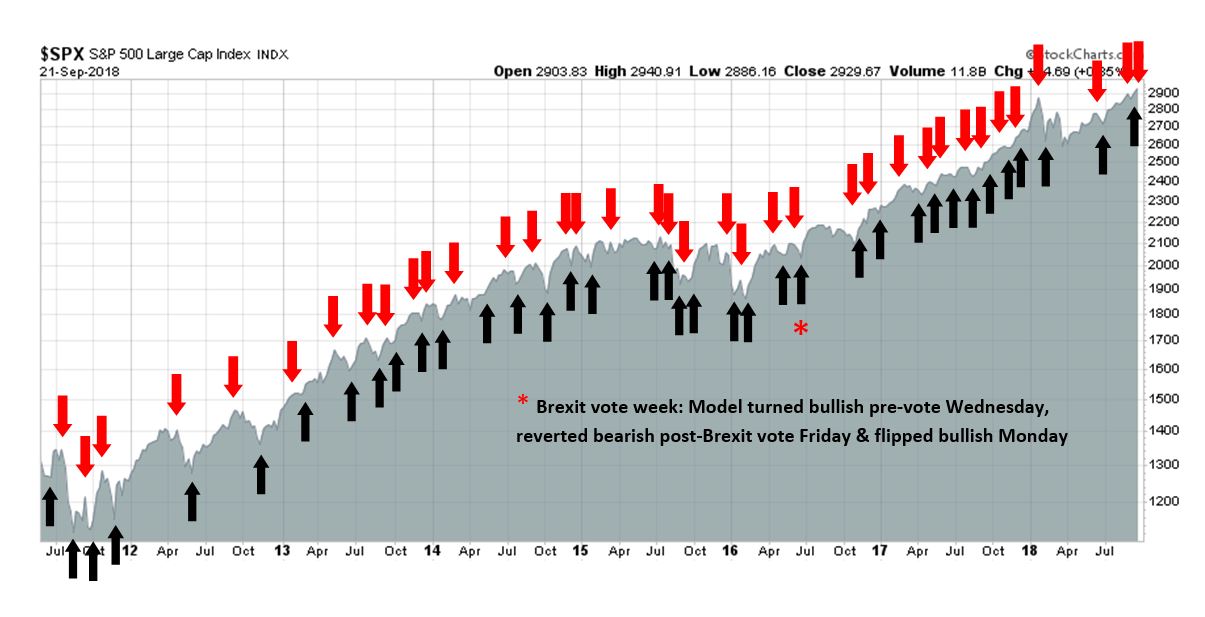
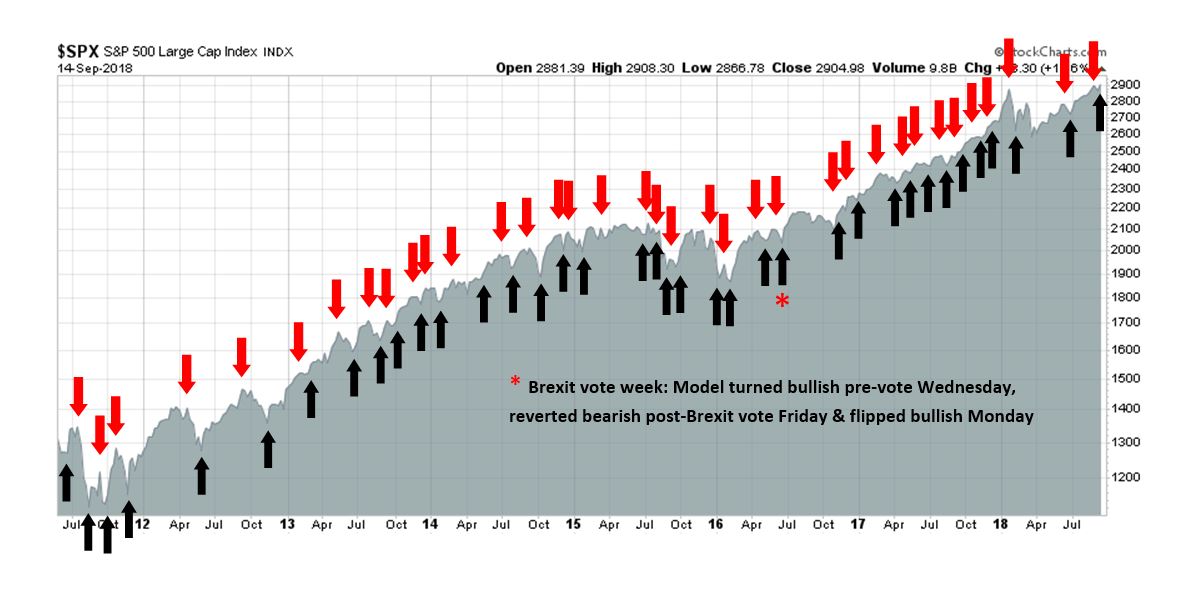
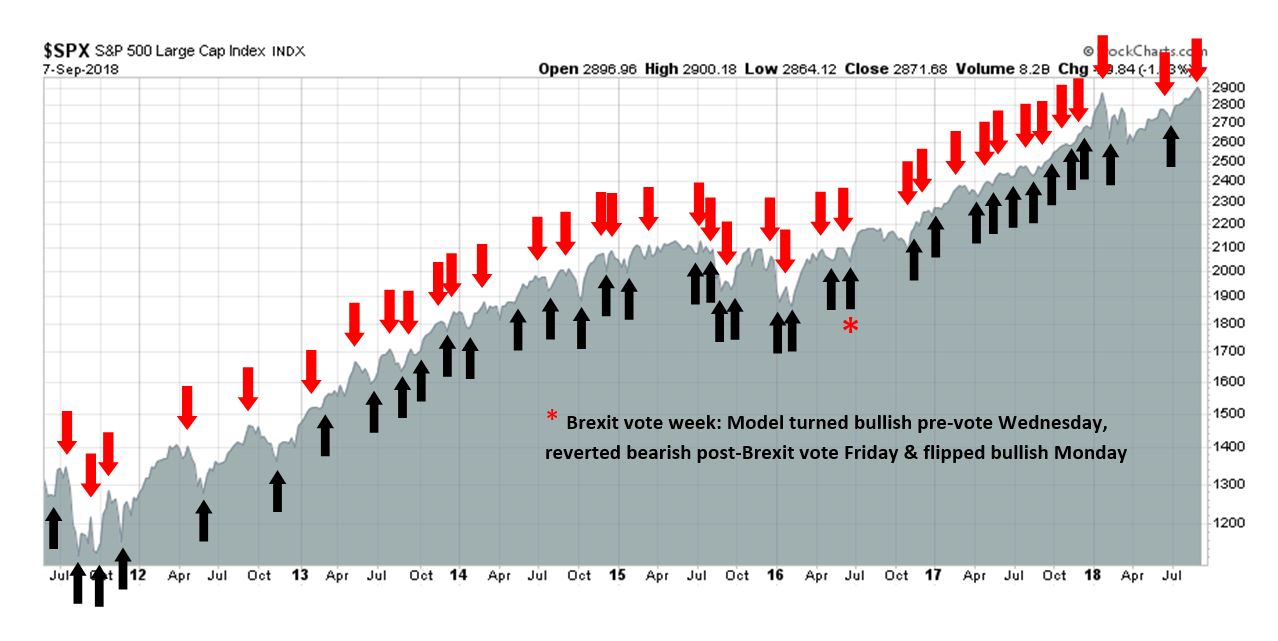
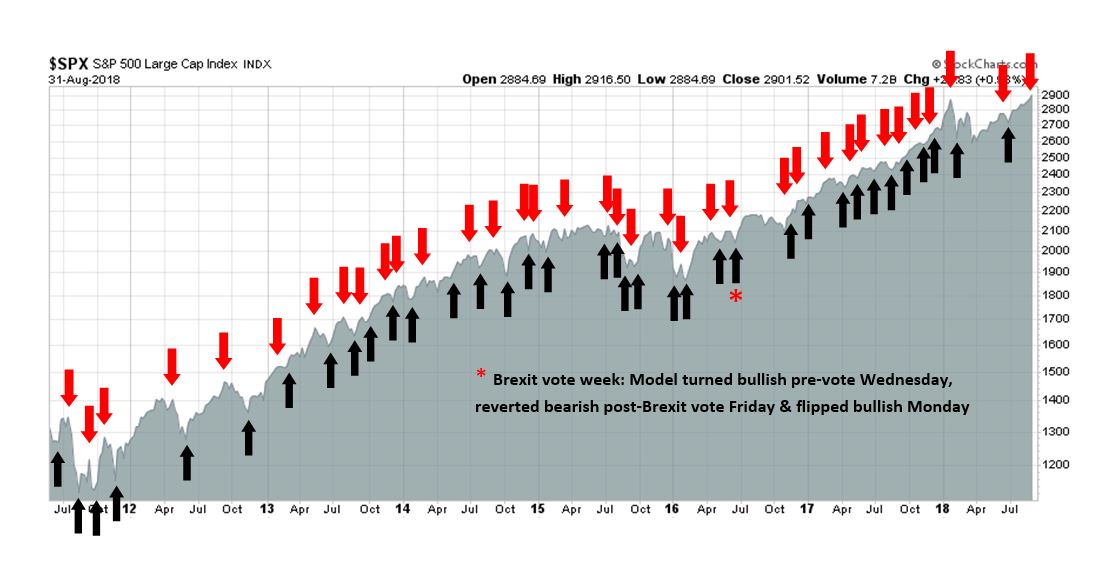
My inner trader uses the trading component of the Trend Model to look for changes in the direction of the main Trend Model signal. A bullish Trend Model signal that gets less bullish is a trading “sell” signal. Conversely, a bearish Trend Model signal that gets less bearish is a trading “buy” signal. The history of actual out-of-sample (not backtested) signals of the trading model are shown by the arrows in the chart below. The turnover rate of the trading model is high, and it has varied between 150% to 200% per month.
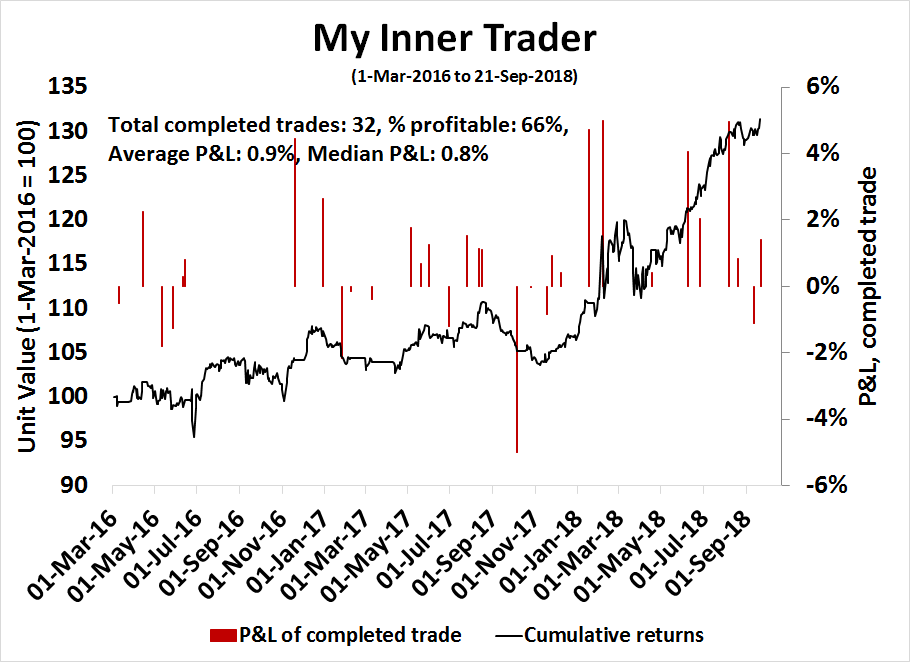
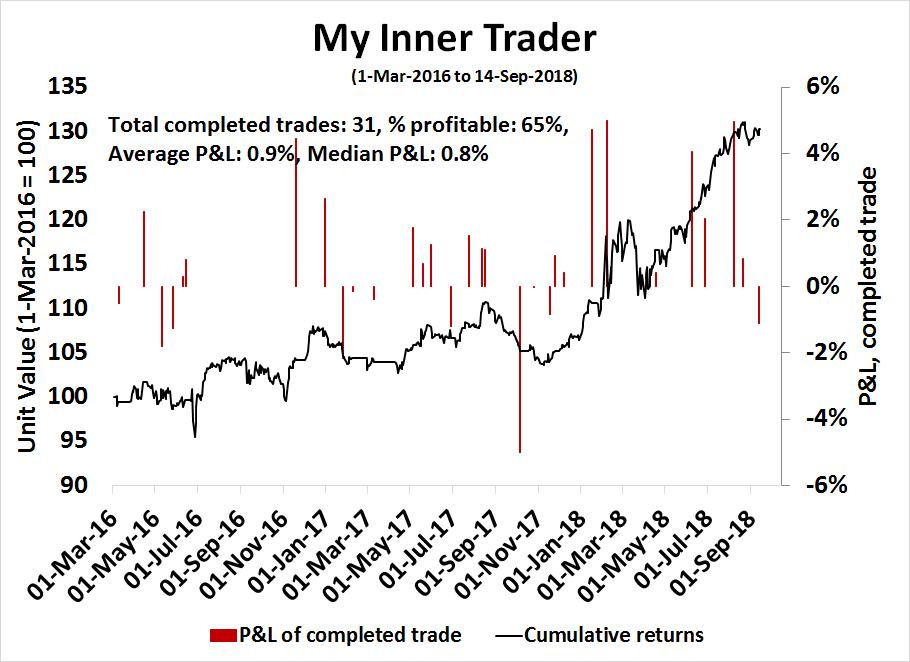
Subscribers receive real-time alerts of model changes, and a hypothetical trading record of the those email alerts are updated weekly here. The hypothetical trading record of the trading model of the real-time alerts that began in March 2016 is shown below.
The latest signals of each model are as follows:
- Ultimate market timing model: Buy equities
- Trend Model signal: Neutral
- Trading model: Bullish
Update schedule: I generally update model readings on my site on weekends and tweet mid-week observations at @humblestudent. Subscribers receive real-time alerts of trading model changes, and a hypothetical trading record of the those email alerts is shown here.
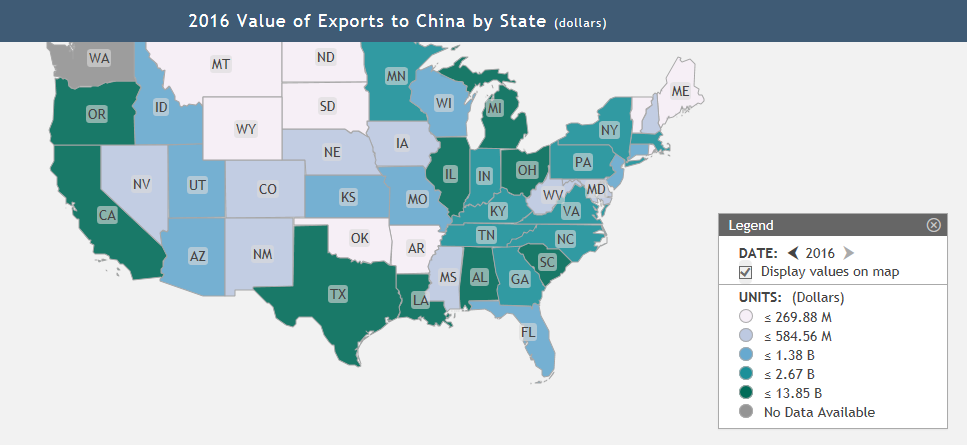
How much runway is left in China’s long landing?
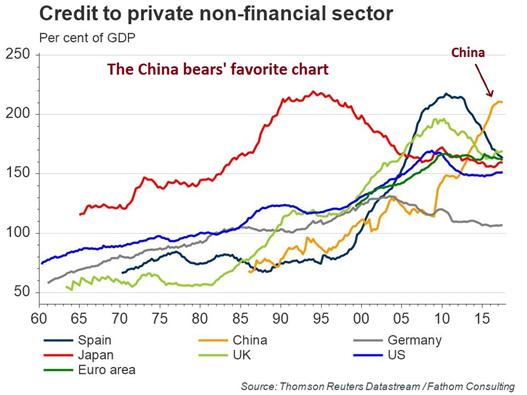
The bears have been warning about China’s unsustainable debt for years. So far, it has been a “this will not end well” investment story, with no obvious bearish trigger and no time frame for a crisis.
Michael Pettis is one of the few China watchers who has established a time frame for China to resolve its problems. He outlined a scenario four years ago where China would not crash, but experience a “long landing” where growth gradually decelerates. Pettis elaborated on his best case scenario in an email to me (see Michael Pettis on the risks of the long landing scenario):
My “best-case” rebalancing scenario, as I think you know, consists of an upper limit to average GDP growth of 3-4% over the presumed decade of President Xi’s administration (2013-23), driven by growth in household income of 5-7% and commensurate growth in household consumption. Although when it comes to China I have been the big, bad bear for so long that perhaps I tend to want to understate my pessimism, I nonetheless always try to remind my clients, sometimes not very loudly if I am in a public forum, that this is not my expected “most likely outcome”.
He went on to elaborate that his best guess is the current pace of credit growth was only sustainable until 2017-2018:
My guess (and it is only a guess), is that China can continue the current pace of credit growth for another 3-4 years at most, after which it cannot grow credit fast enough both to roll over what Hyman Minsky suggested was likely to be exponential growth in unrecognized bad debt (and WMP and other shadow banking assets will almost certainly be absorbed into the formal banks), and to provide enough new lending to fund further economic activity. If there is less time, as I think Anne Stevenson might argue, or if Beijing cannot get credit and rebalancing under control before then, I think we can probably assume my “orderly long landing” scenario is less likely.
Here we are, four years later. How is China managing its long landing?
Hitting the debt wall
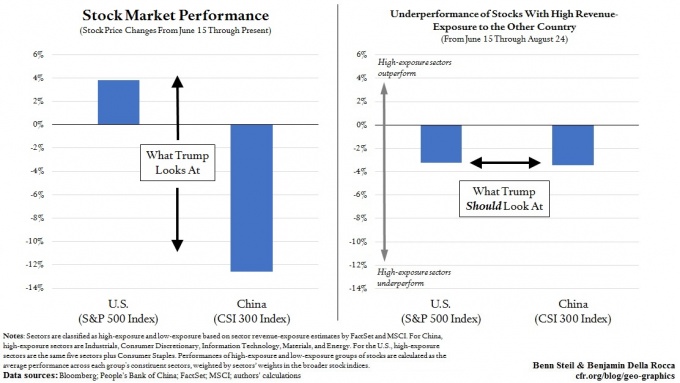
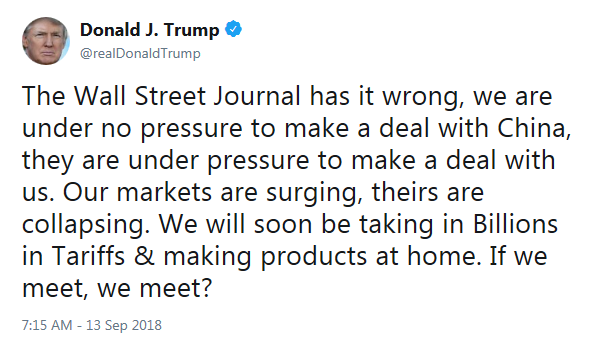
As Pettis had predicted, the cracks are appearing in China’s credit driven growth engine. Remember how Chinese stock prices are tanking? Benn Steil at the Council on Foreign Relations found that the cause is not the trade war.
Instead, he attributed stock market weakness to Beijing’s deleveraging policy to reduce credit growth.
The cracks are appearing at both the local government and corporate levels. The WSJ reported that a Chinese city was so financially squeezed that it forced parents to send students to private schools:
LEIYANG, China—Long before parents clashed with police and officials over school overcrowding, this southern Chinese city was telegraphing its fiscal squeeze—and exemplifying China’s deep-seated local debt woes.
After the area’s backbone coal-mining industry entered a slump mid-decade, the Leiyang government’s revenue began to slide. By February, the government warned the legislature of challenges in providing education, health care and other social services. Then in May, civil servants went unpaid for more than a week, until emergency funds arrived. Weeks later, a city-owned company that finances construction missed a loan repayment to a nonbank lender.
Problems spilled out into the streets both nights this weekend. The city’s plans to deal with overcrowded public-school classrooms by sending students to more expensive, often inferior private schools drove hundreds of parents and others to protest. On Saturday, some threw bottles, bricks and firecrackers at local officials and police, who, by official accounts, then dispersed the crowds, detaining 46 people.
The SCMP reported that private businesses have trouble getting loans even when the government directed banks to lend to SMEs [emphasis added]:
The Chinese government campaign to get more funding into the hands of small business owners is struggling.
And a solution to the problem is being more urgent as the trade war with the United States starts to weigh on the economy.
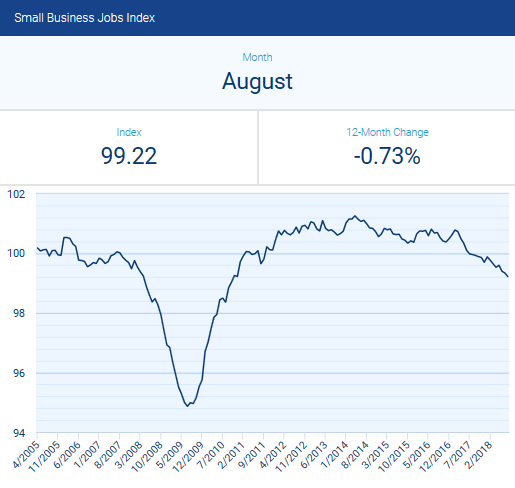
Small and medium-sized business (SMEs) account for most jobs in the country – up to 80 per cent by some measures. Each produces a single or a small range of products or services and operates on small profit margins that are far less resilient to economic disruptions than those at larger firms.
The government has pumped money into the banking system to spur lending to smaller business and has recently stepped up its verbal intervention demanding action. Anecdotal evidence suggests the situation has improved, but only modestly.
That is because the push to get banks to lend more to small firms is in direct conflict with the government’s effort to reduce risk in the financial system.
The results of the focus on SME loan growth have been mixed at best:
But, so far, the process is falling short of expectations. At the end of the second quarter, loans to micro and small businesses accounted for 32.3 per cent of the total outstanding corporate loans, 0.4 percentage point lower than at the end of March, according to data from the People’s Bank of China, the central bank.
In the first half of this year, new loans for micro and small businesses made up mere 20.9 per cent of new corporate loans, the lowest rate since the data was first published in 2012.
Small businesses face enormous hurdles in obtaining credit:
Jiang Pengming, chairman of a tech entrepreneurs association in Beijing, said small firms, at least in the green industry, still face egregious requirements to get a bank loan. Banks sometimes demand collateral that not only includes company assets, but also managers’ personal assets.
“Entrepreneurs, their spouses and children over 18 all have to sign loan agreements, businessmen over 60 even need to do psychiatric examinations on the same day of signing,” he told the Post. “Still, firms cannot ensure that they will get a loan by doing so.”
He said that financing difficulties only scratch the surface of the problems facing small businesses in China. Freeing up more money for lending will not resolve these problems facing SMEs, most of which are private enterprises.
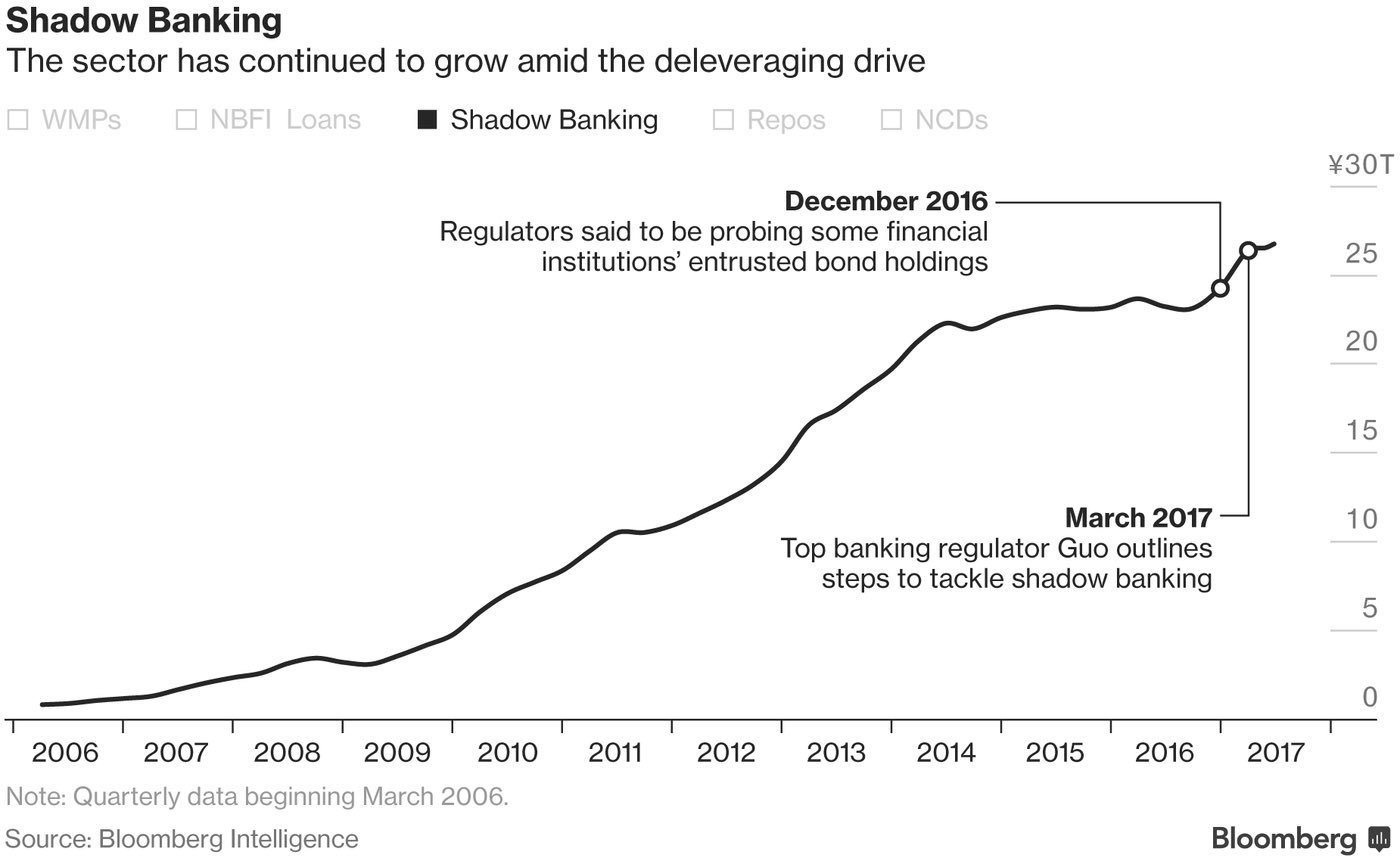
Instead, SMEs have been turning to the more expensive shadow banking lenders for credit, which is a sector that the authorities are desperately trying to rein in:
In the past, the shortage of affordable bank credit forced small businesses to turn to other avenues for financing, particularly shadow bank lending. Peer-to-peer (P2P) lending to SMEs soared to 872.3 billion yuan (US$128 billion) in 2017, more than 70 times the 12.4 billion yuan in 2013, according to a report from WDZJ.com, an information platform for the online lending industry, in December last year.
Chinese SMEs, which accounted for more than 60 per cent of the country’s gross domestic product last year, have been underserved by the traditional banking system for years, so the government’s programme to reduce financial leverage and debt by underregulated shadow banking institutions has made their situation worse.
What’s more, the shadow banking sector continues to grow despite Beijing’s efforts.
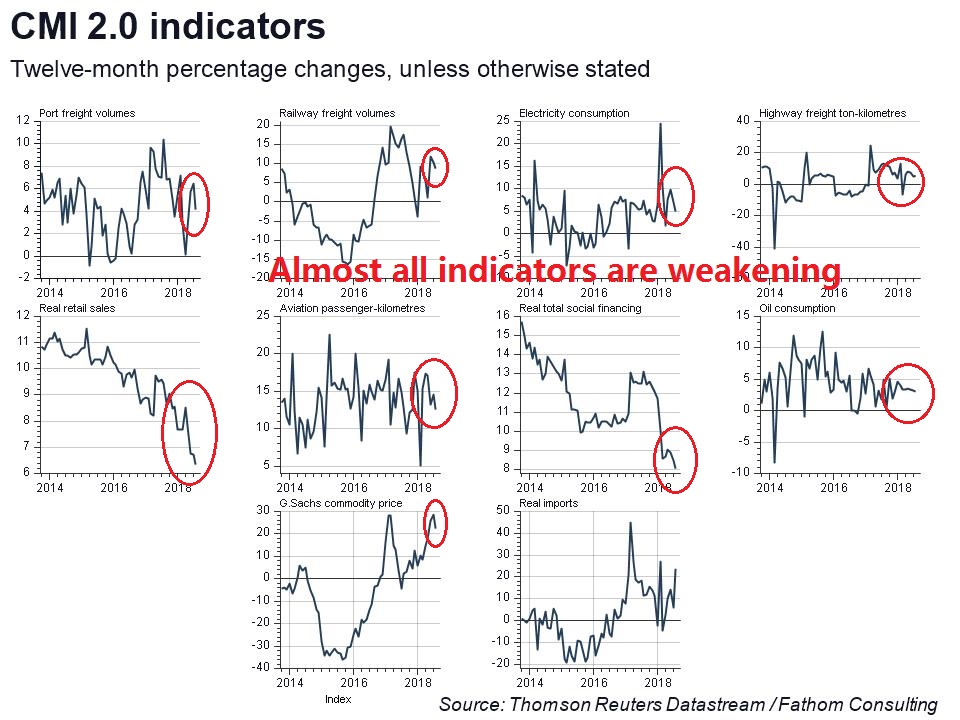
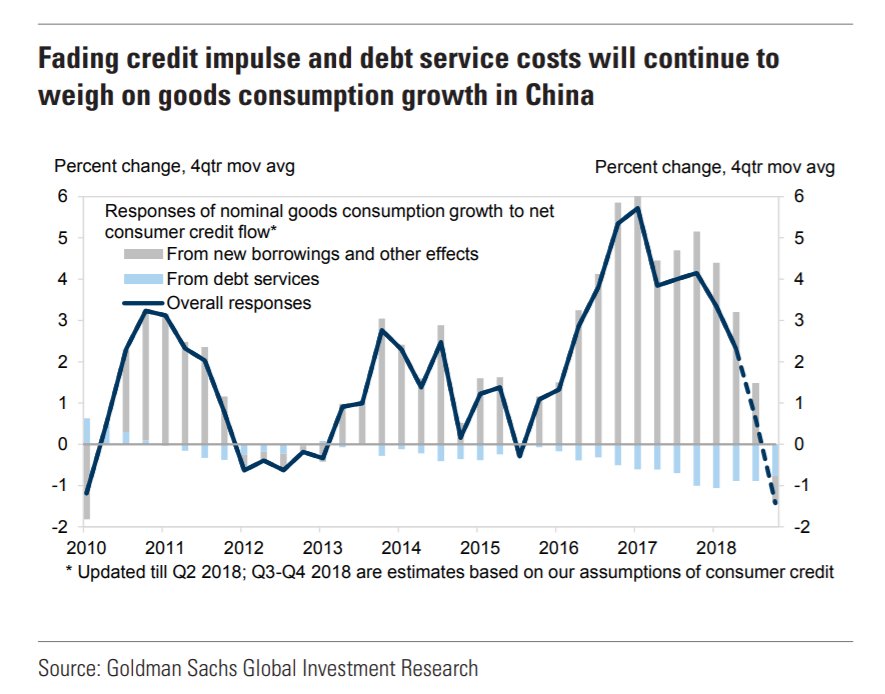
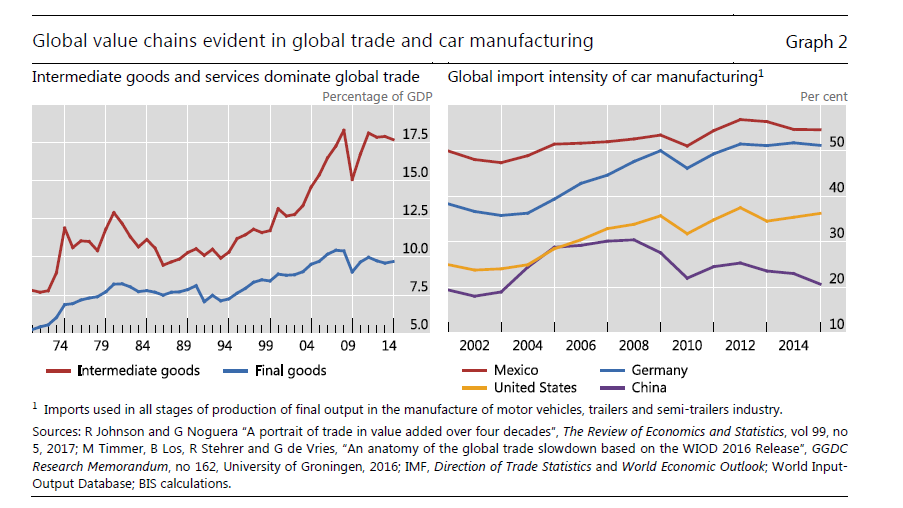
Moreover, Chinese good consumption is in a downward trajectory because of the effects of the government’s deleveraging policy on the economy.
Four years after Pettis’ made his guesstimate, it appears that China is beginning to hit a debt wall.
China’s difficult policy choices
Indeed, Pettis acknowledged in his latest commentary that China is coming to the end of its debt runway. Still, he believes that China is unlikely to crash, but it is likely to trade the heart attack for a chronic disease:
China’s debt problems have emerged so much more rapidly and severely this year than in the past that, combined with swirling rumors about the country’s leadership, a growing number of analysts believe that this may be the year that China’s economy breaks. As always, I am agnostic. There is no question that China will have a difficult adjustment, but it is likely to take the form of a long process rather than a sudden crisis.
What if there is a trade war, or a global recession?
If the global trade environment forces a contraction in China’s current account surplus, I argue, by definition it also forces a contraction in the gap between Chinese savings and Chinese investment. This means that either the country’s investment share of GDP must rise or the savings share must decline (or some combination of the two). There are literally only four ways that either of these outcomes can happen. Consequently, there are also only four ways that Beijing can respond, each of which would drive the economy to one of the four possible outcomes (or some combination of them):
- Raise investment. Beijing can engineer an increase in public-sector investment. In theory, private-sector investment can also be expanded, but in practice Chinese private-sector actors have been reluctant to increase investment, and it is hard to imagine that they would do so now in response to a forced contraction in China’s current account surplus.
- Reduce savings by letting unemployment rise. Given that the contraction in China’s current account surplus is likely to be driven by a drop in exports, Beijing can allow unemployment to rise, which would automatically reduce the country’s savings rate.
- Reduce savings by allowing debt to rise. Beijing can increase consumption by engineering a surge in consumer debt. A rising consumption share, of course, would mean a declining savings share.
- Reduce savings by boosting Chinese household consumption. Beijing can boost the consumption share by increasing the share of GDP retained by ordinary Chinese households, those most likely to consume a large share of their increased income. Obviously, this would mean reducing the share of some low-consuming group—the rich, private businesses, state-owned enterprises (SOEs), or central or local governments.
Notice that all four paths either raise investment or reduce savings, thereby reducing the country’s excess of savings over investment. This is what is meant by a contraction in the current account surplus.
In other words, there are only three realistic policy choices: unemployment, debt, or wealth transfers. While the wealth transfer option appears to be the most logical from a policy viewpoint, Beijing will face the opposition of entrenched and powerful interests of the rich tycoons, the party cadres in the SOEs. Pettis concluded:
For the rest of 2018, I expect that we will see different groups in Beijing try to reconcile the need for slower credit growth with greater growth in economic activity. But because these two things cannot be reconciled, one group or the other must win. So far it isn’t clear whether we will see growth in economic activity continue to slow or credit growth pick up.
While Pettis did not try to forecast specific policy choices, Houze Song at Macro Polo believes that China will continue to prioritize minimizing financial risk through deleveraging at the expense of slower growth. Contrary to market expectations, Beijing will not be panicked into another round of credit-driven investment binge as long as SOE and local government finances are solid:
As US-China trade tensions have escalated, the general consensus has overwhelmingly shifted toward the view that “Beijing is returning to stimulus mode again,” implying that Chinese policymakers are ready to postpone or even reverse its ongoing deleveraging effort. In light of the State Council’s recent dovish signals, such a view has only gained more traction.
But those State Council signals are at odds with the core message of the July 31 Politburo meeting that President Xi Jinping chaired. What came out of that meeting is clear: the overall direction of deleveraging and financial tightening will remain unchanged.
- The recent Politburo meeting on July 31 reaffirmed Beijing’s priority of containing China’s debt, focusing on state sector and local government deleveraging.
- Beijing will primarily use administrative measures, and to a lesser extent financial regulation, to contain financial risk for the rest of 2018.
- While monetary policy will continue to be modestly accommodative, the deleveraging agenda—that is, curtailing shadow banking and local off-budget borrowing—will remain intact and continue to put a drag on growth in the medium term.
- As long as state firms’ and local governments’ finances are solid, Beijing will hold back on stimulus, stay the course on deleveraging, and accept lower growth.
We don’t know how this story ends. but it sounds like China will undergo some difficult adjustments in the near future, and there are some very obvious bearish triggers ahead.
President Xi, Meet Jay Powell
While the market has focused on Trump’s trade policy as China’s biggest economic threat, I beg to differ. The biggest threat is the Federal Reserve, which appears intent on engineering a recession.
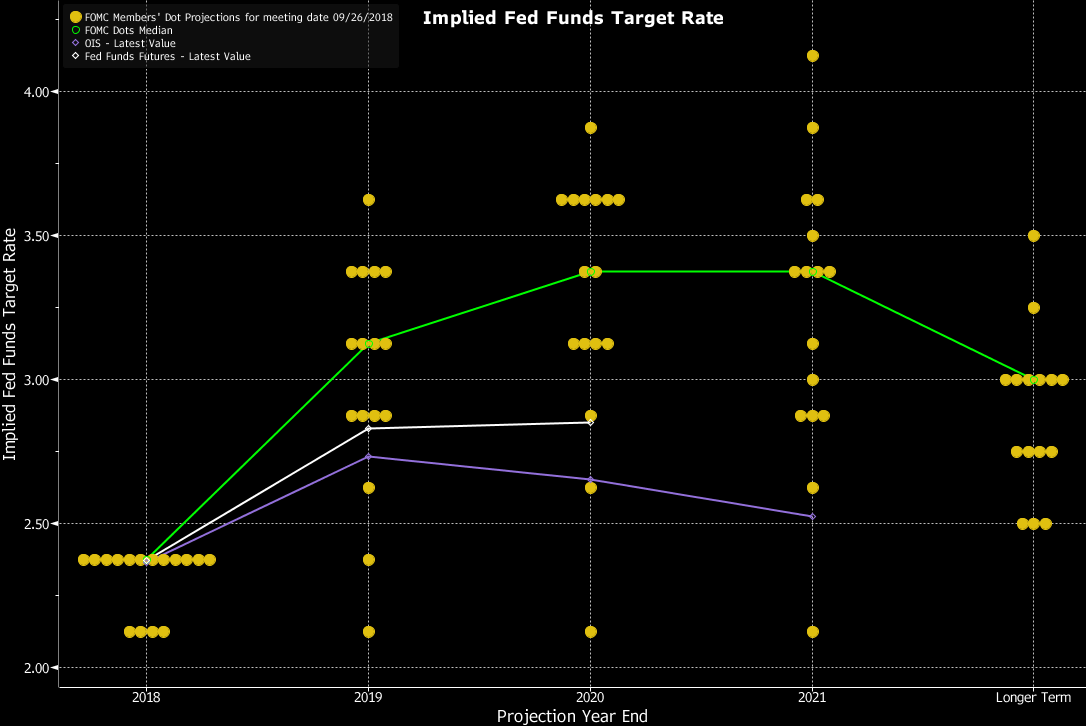
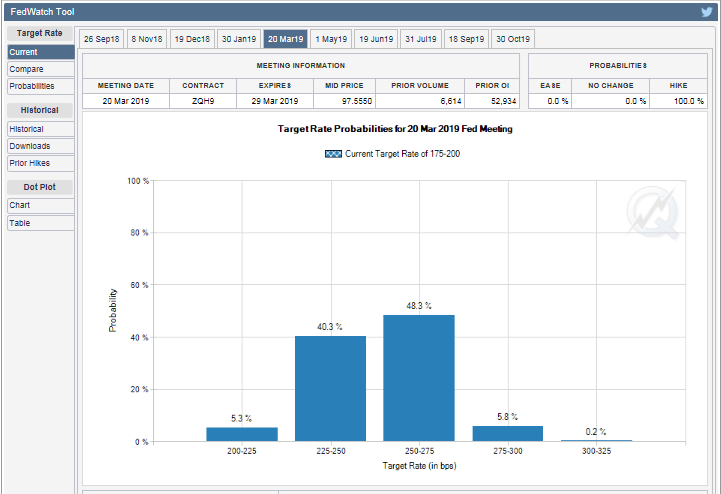
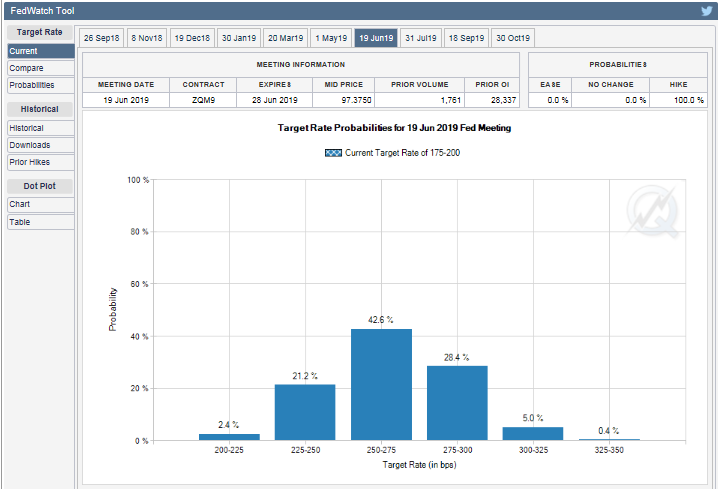
While the market has priced in two more quarter-point rate hikes for the rest of 2018, analysts are starting to focus on when the Fed might pause its rate normalization policy as interest rates near the neutral rate. Unfortunately, the answer is no, it will not pause.
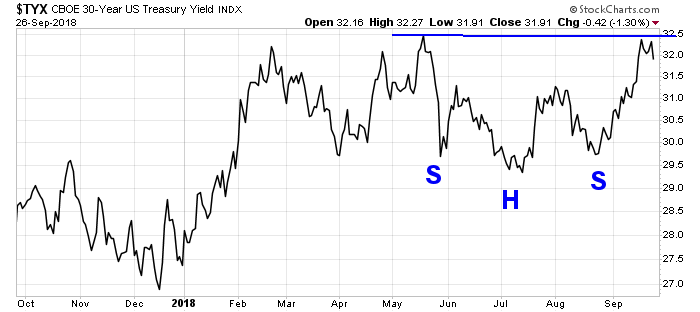
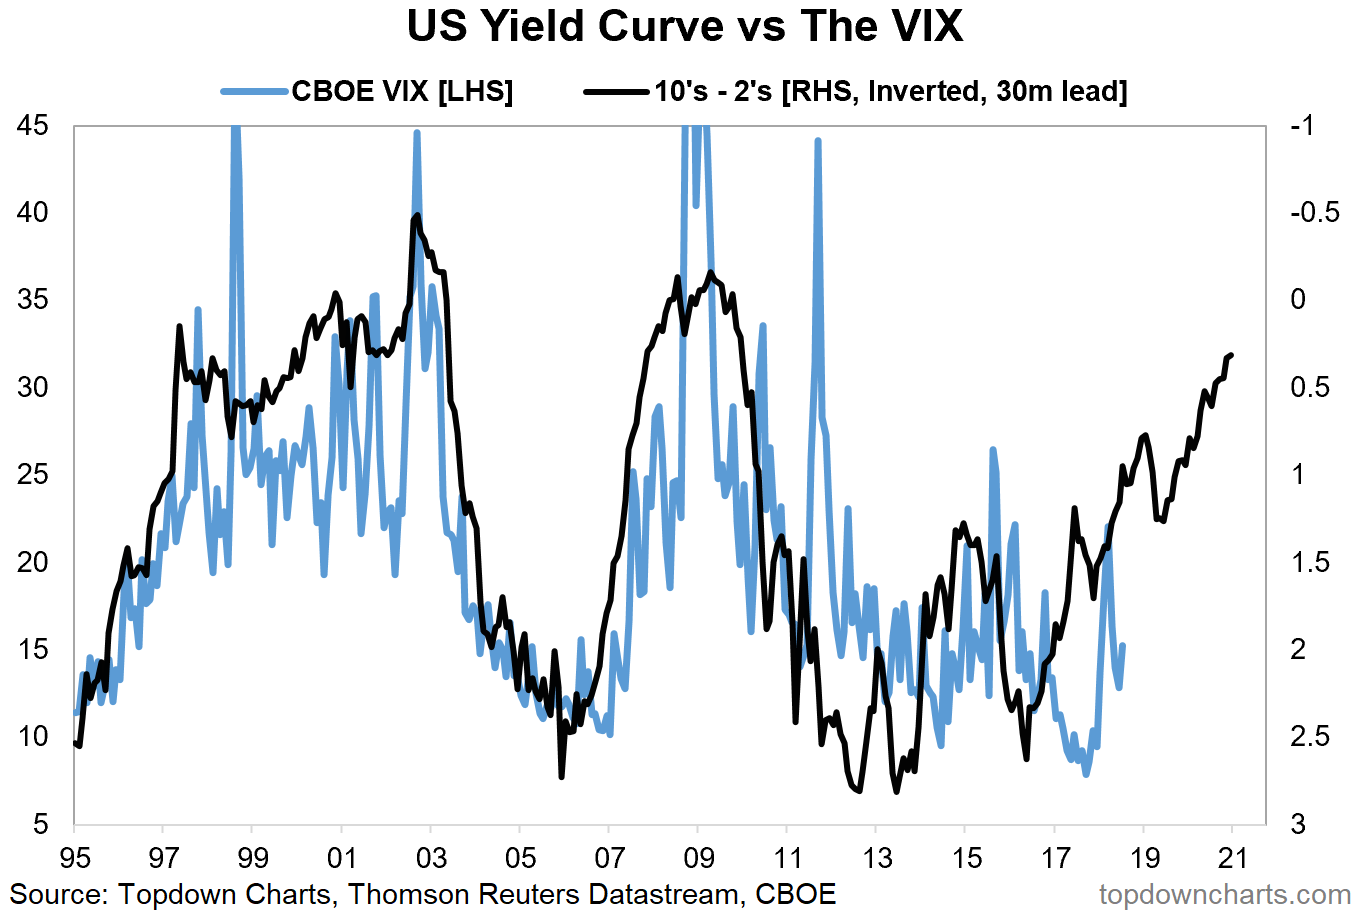
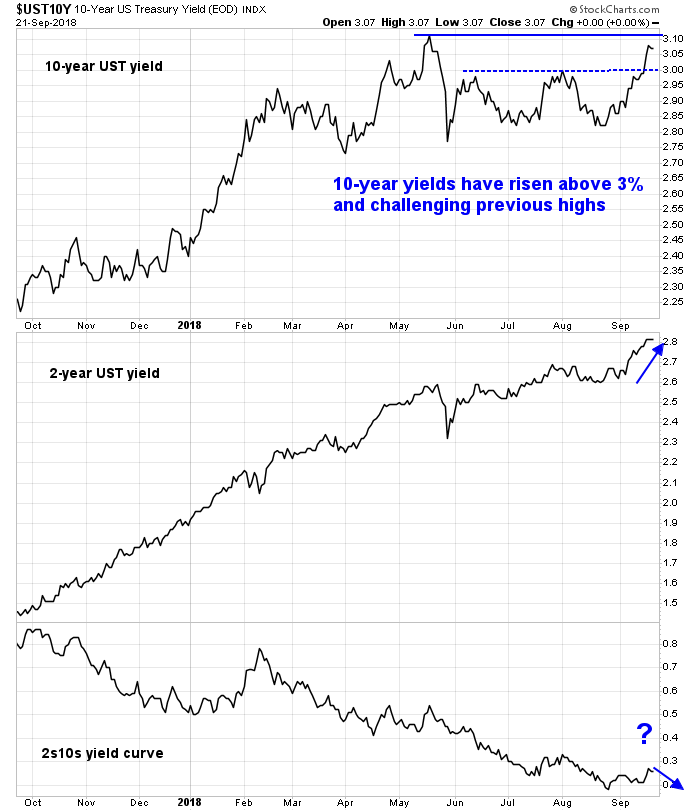
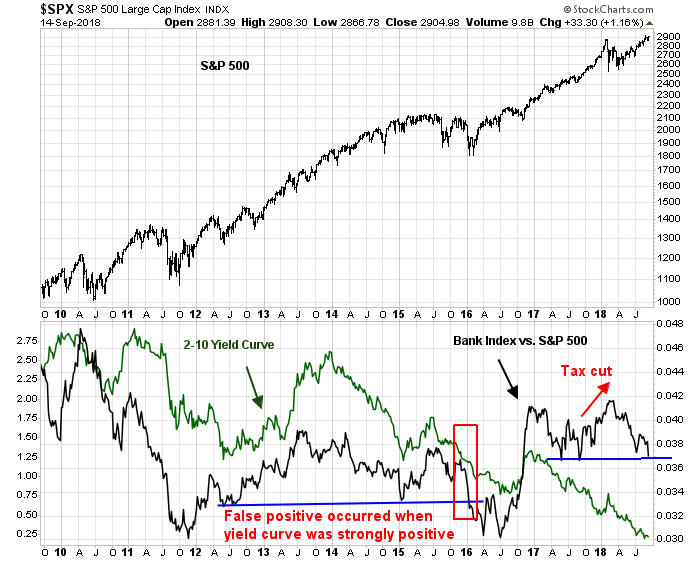
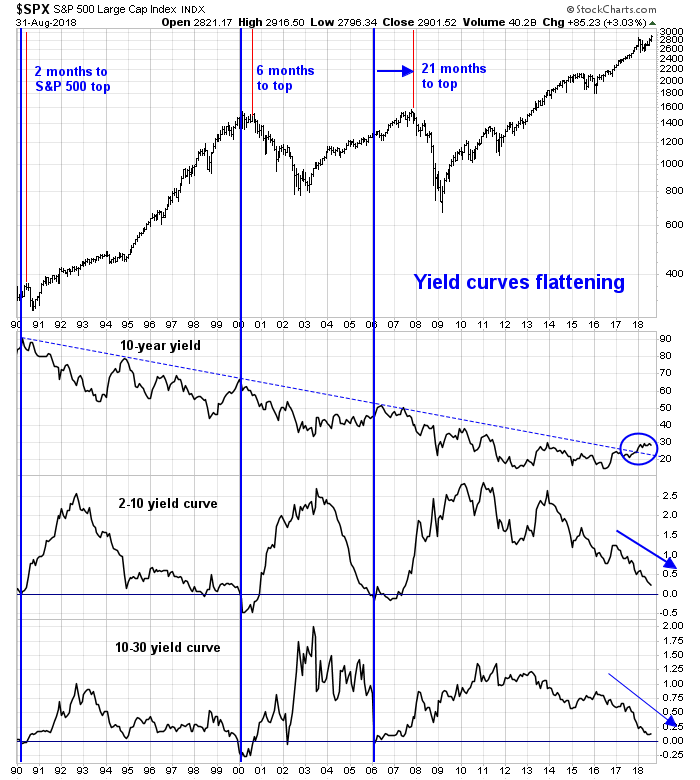
Much has been made of the objection by a number of regional Fed presidents about the prospect of inverting the yield curve. If the Fed were to maintain its current tightening path, the 2-10 yield curve is likely to invert either in late 2018 or early 2019. However, investors have to understand the voting dynamics of the Fed’s monetary policy. The people who really matter (and have the staff to create studies to support their conclusions) are the permanent voters on the FOMC, namely the Fed governors, and the President of the New York Fed.
Indeed, these “important” people have spoken. Fed chair Jay Powell stated in so many words in his Jackson Hole speech that the Fed is on course to keep raising until something breaks (see Why the Powell speech was less dovish than the market thinks). As well, the WSJ reported that New York Fed President John Williams is not afraid of inverting the yield curve:
Federal Reserve Bank of New York leader John Williams said Thursday the prospect of a yield-curve inversion by itself wouldn’t be enough to stop him from supporting further rate rises if he thought the economy called for them.
“I think we need to make the right decisions based on our analysis of where the economy is and where it’s heading,” Mr. Williams told reporters after a speech in Buffalo. “If that were to require us to move interest rates up to the point where the yield curve was flat or inverted, that would not be something I find worrisome on its own.”
Last week, Fed governor Lael Brainard chimed in with an important speech entitled “What Do We Mean by Neutral and What Role Does It Play in Monetary Policy?“. She intimated that the Fed is likely to keep hiking even past neutral by distinguishing between the long-term neutral rate, which is specified in the Summary of Economic Projections (SEP), and the short-term neutral rate, which varies. Fed policy should focus on the short-term neutral rate, which is a function of economic data [emphasis added]:
Focusing first on the “shorter-run” neutral rate, this does not stay fixed, but rather fluctuates along with important changes in economic conditions. For instance, legislation that increases the budget deficit through tax cuts and spending increases can be expected to generate tailwinds to domestic demand and thus to push up the shorter-run neutral interest rate. Heightened risk appetite among investors similarly can be expected to push up the shorter-run neutral rate. Conversely, many of the forces that contributed to the financial crisis–such as fear and uncertainty on the part of businesses and households–can be expected to lower the neutral rate of interest, as can declines in foreign demand for U.S. exports.
In many circumstances, monetary policy can help keep the economy on its sustainable path at full employment by adjusting the policy rate to reflect movements in the shorter-run neutral rate. In this context, the appropriate reference for assessing the stance of monetary policy is the gap between the policy rate and the nominal shorter-run neutral rate.
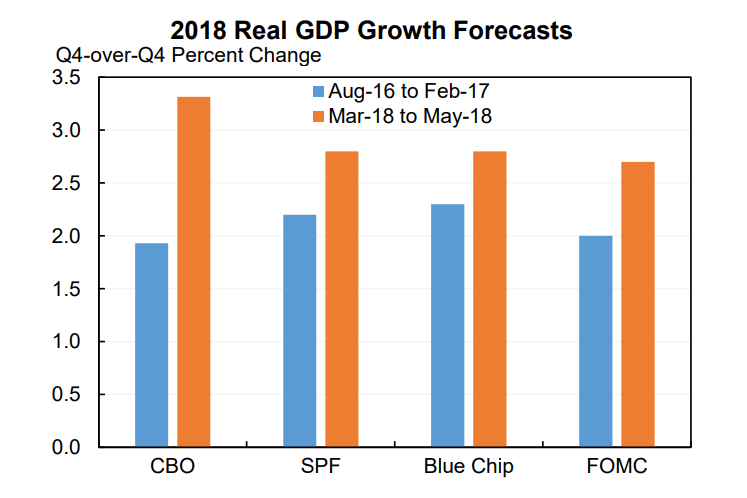
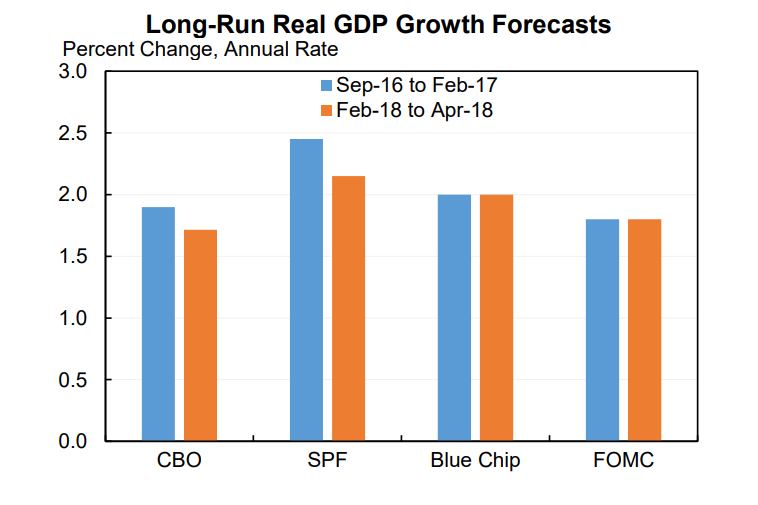
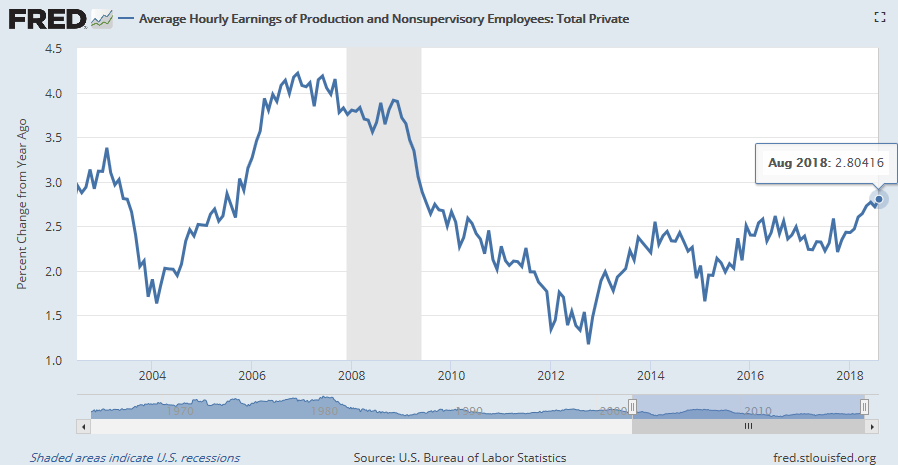
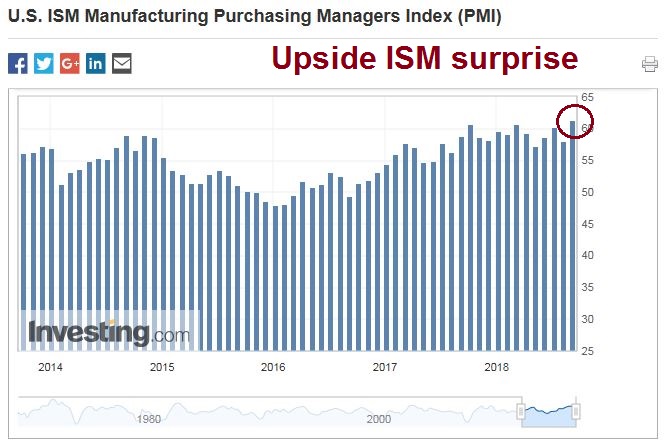
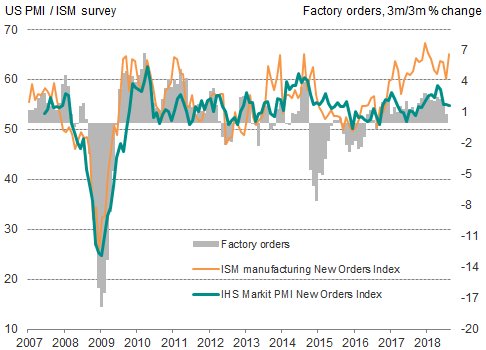
And the economy is running hot, which means the short-term neutral rate is above the long-term rate, which Brainard estimated at between 2.5% and 3.5%. The Atlanta Fed’s Q3 GDPNow stands at a sizzling 4.4%, the St. Louis Fed’s nowcast at 4.4%, and the New York Fed’s nowcast is the outlier at 2.2%.
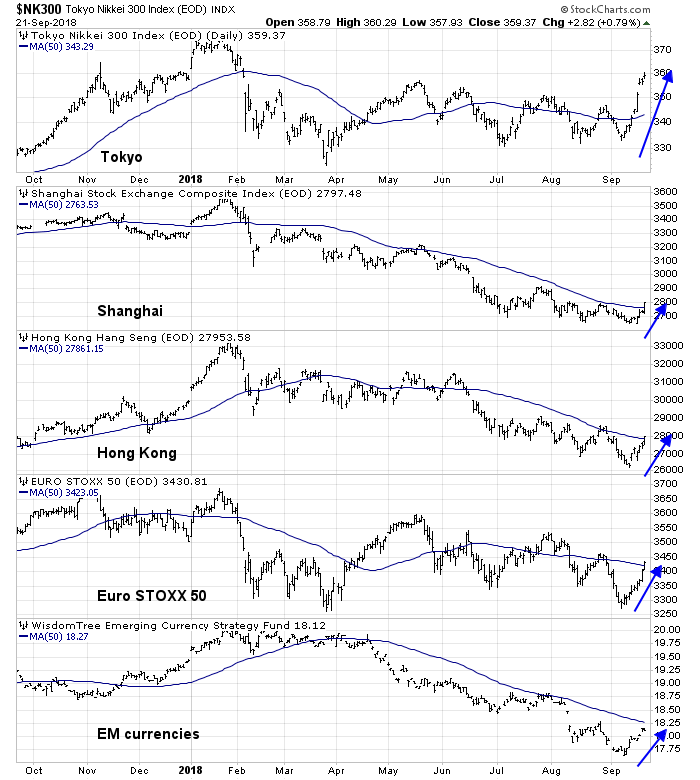
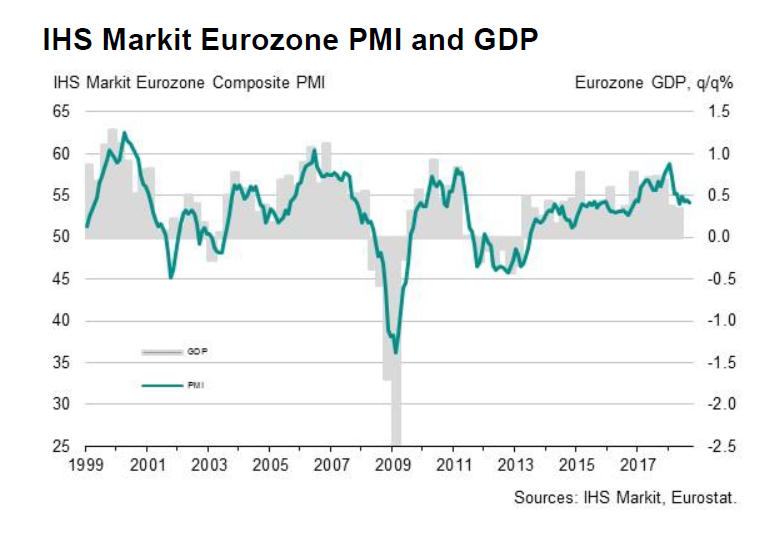
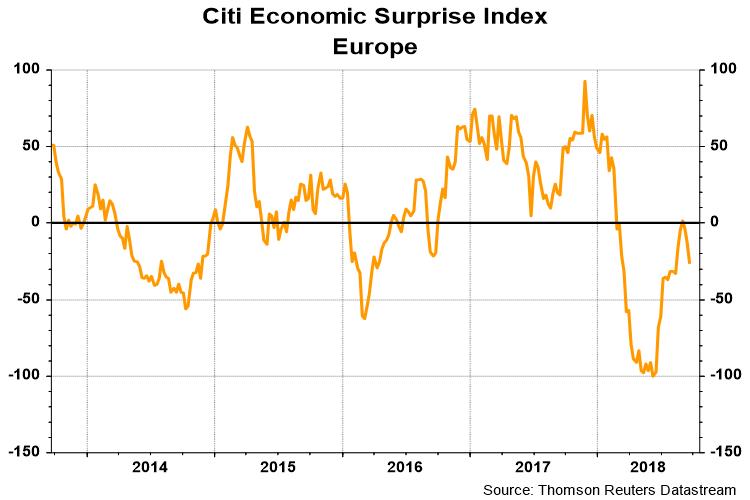
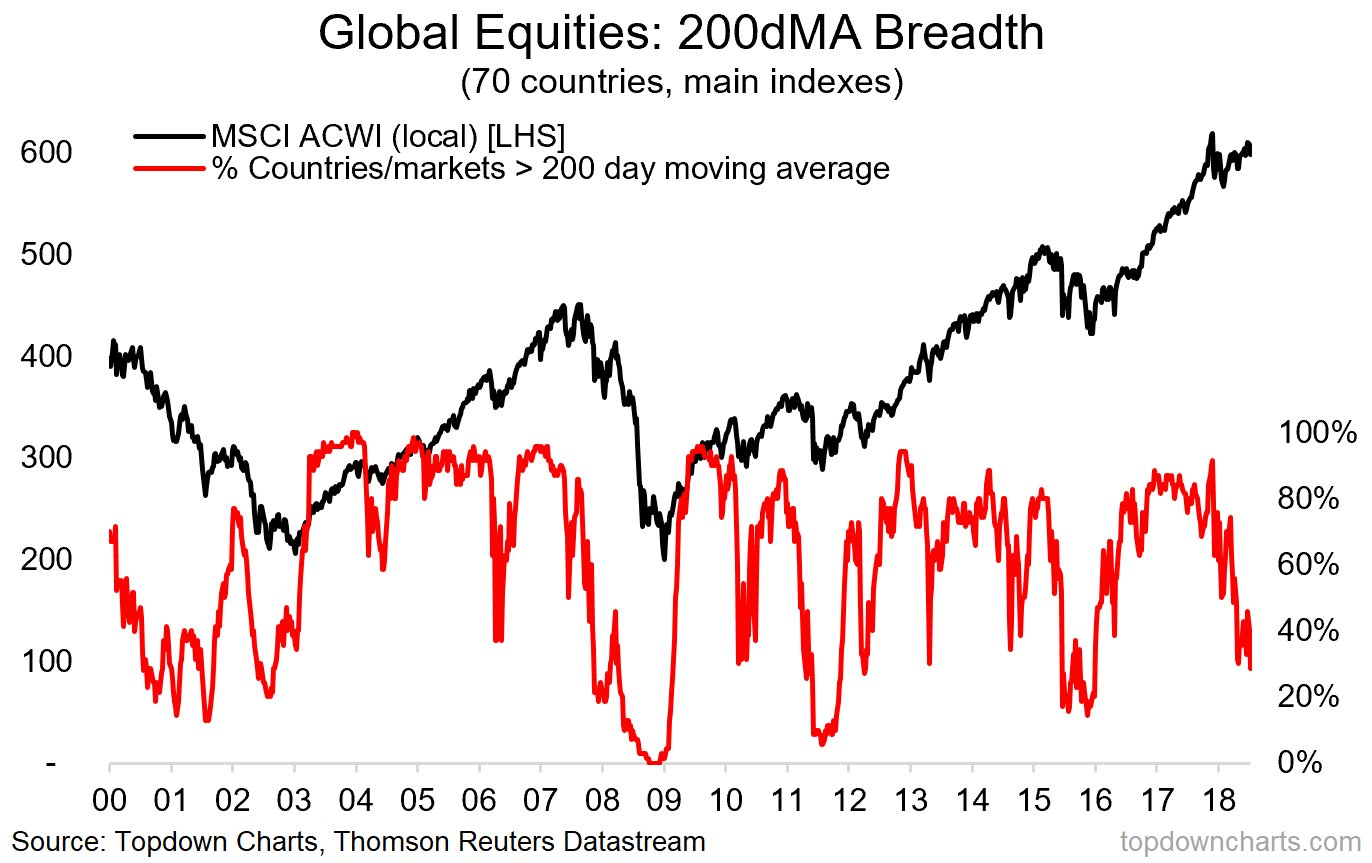
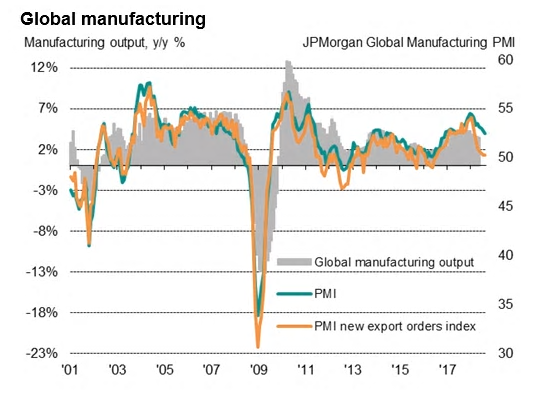
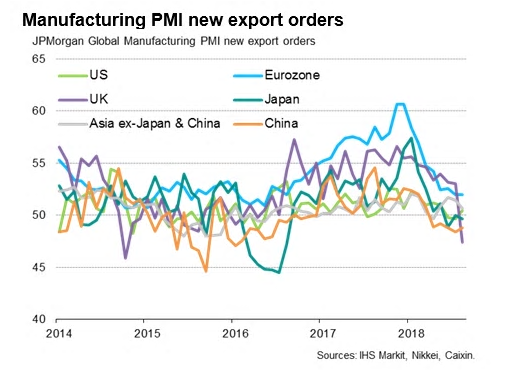
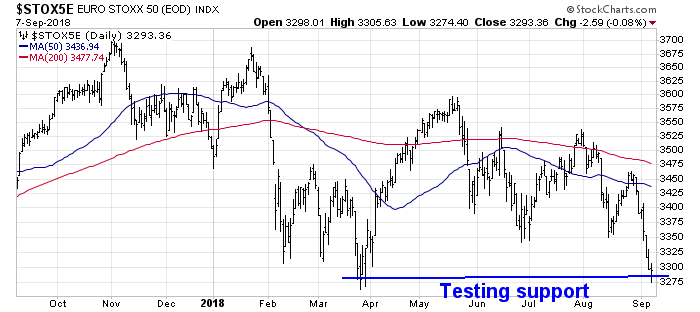
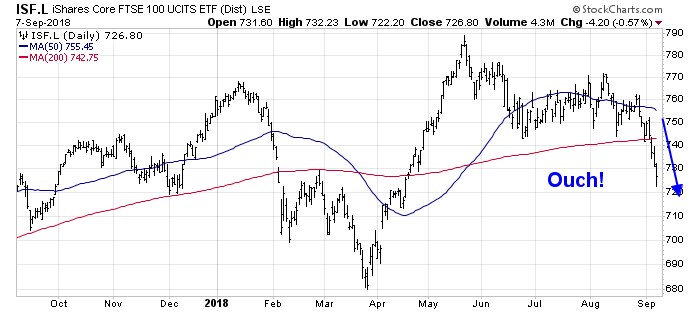
Even as the American economy displays signs of strength, the rest of the world is weakening as evidenced by the poor breadth shown by global equity markets.
This combination of decelerating non-US growth and a hawkish Federal Reserve is a recipe for a global slowdown of unknown magnitude.
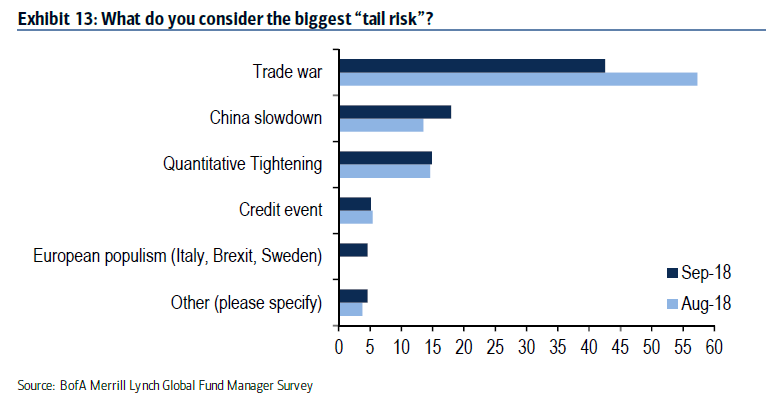
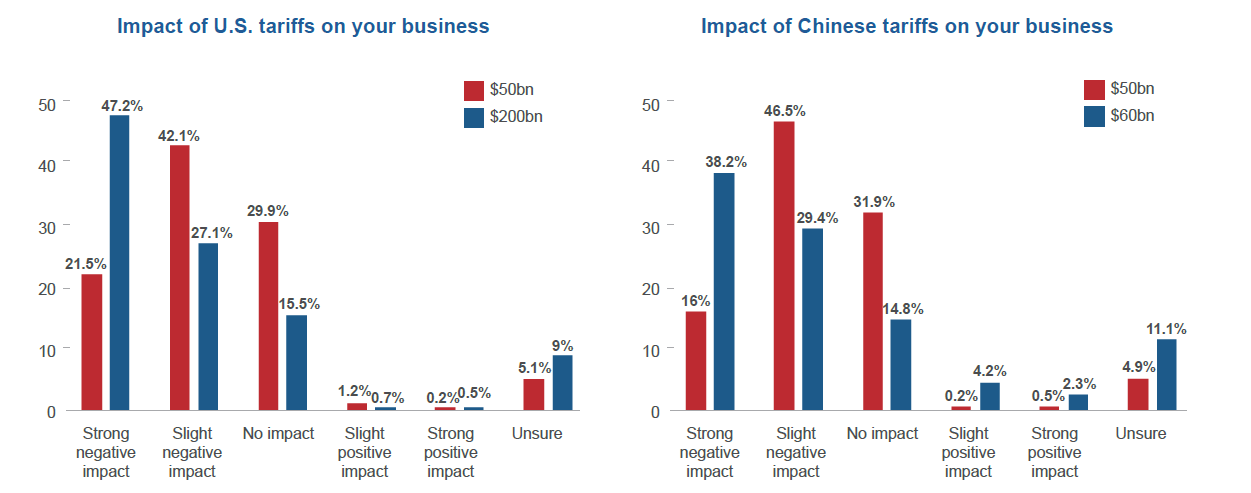
Trade war starting to bite
On top of that, the trade war is starting to bite. AmCham Shanghai and AmCham China conducted a survey of the impact of the US-China tariffs, and the effects of the trade war are starting to bite.
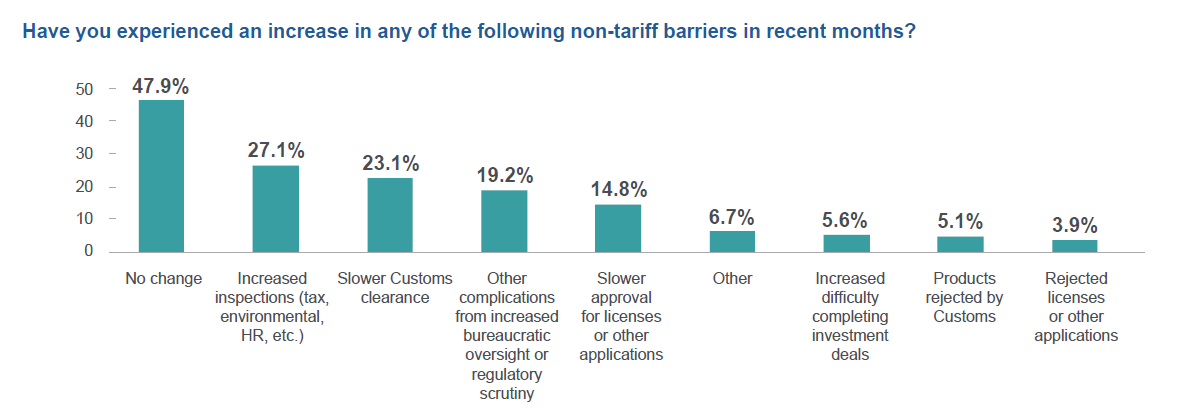
China isn’t just retaliating with additional tariffs, but evidence of non-tariff barriers are appearing.
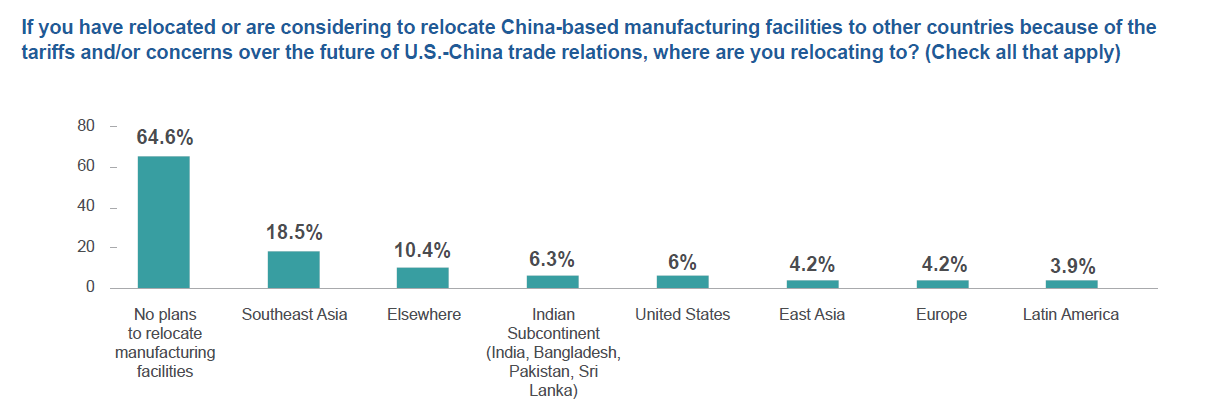
The intent of Trump’s trade policy is to force American companies to bring manufacturing back to the US. Instead, most multi-nationals are opting to move to other countries, and only 6% of the survey sample plan on building American facilities.
Despite Trump’s belligerent tone, there will be no winners in this trade war.
Moreover, there does not seem to be any face saving off-ramps in this trade dispute for without one side enduring the embarrassment of a full capitulation.
The Chinese chickens come home to roost?
How will all this this affect China? Increasingly, there are calls for the Chinese chickens coming home to roost, in addition to Pettis’ analysis of Beijing’s unenviable policy choices. Arvind Subramanian and Joel Felman, writing at Project Syndicate, believes that the era of Chinese exceptionalism is about to end:
After decades of strong and steady growth, China has developed a reputation for economic resiliency, even as it piles up ever more domestic debt. But the prospect of declining exports, alongside a weakening currency, could derail its debt-defying trajectory.
Former UBS strategist George Magnus recently warned about the combination of the unsustainability of China’s debt, and its aging population:
Eventually, the government will have to stabilise and reduce the debt burden and excess leverage in the economy if it is to avoid a painful landing. This will show up in the form of a material reduction in China’s growth rate in coming years. The Yuan is very likely to weaken as a result over the medium-term, in spite of restrictions over capital moving overseas.
Rapid ageing – China is the fastest ageing country on Earth – will tend to both lower growth and sap some of the country’s dynamism. The abandonment of the one child policy in 2015, and the recent removal of the last government diktats over family size are unlikely to be any more successful in raising fertility than other measures have been elsewhere. China will need to find other ways to offset the predicted sharp rise in the old age dependency ratio, which will surpass that of the US in the next 25 years.
In conclusion, China faces both long and short term obstacles. In the long run, its growth is unsustainable and Beijing needs to make adjustments. In the short run, the Fed appears intent on engineering a US recession, which, combined with Trump’s trade war, are headwinds to Chinese growth and policy adjustment process. The risks are rising rapidly, and don’t count on China to sail through the next global downturn as smoothly as the last one.
The canaries in the Chinese coalmine
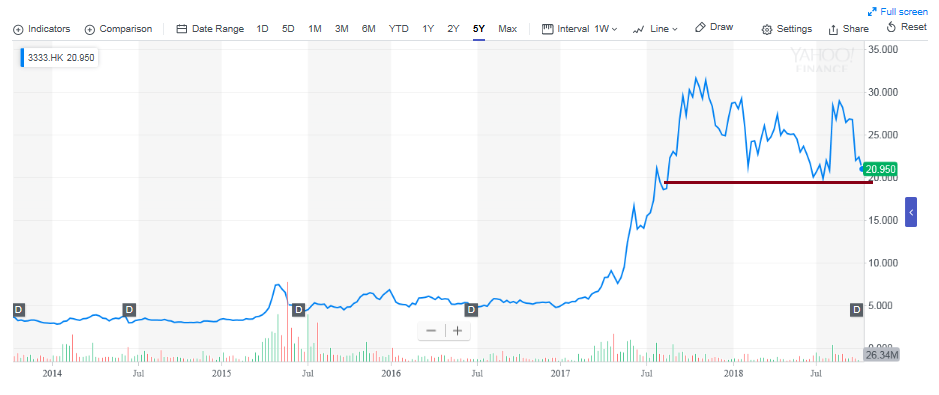
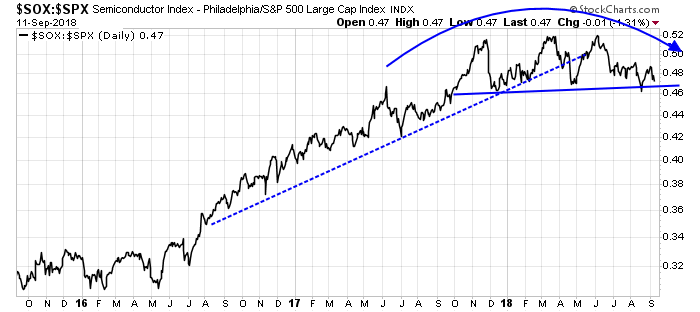
What should investors do? In light of the heightened risks, I suggest that investor monitor two key stocks as real-time indicators of the health of the Chinese economy.
The first is China Evergrande Group (3333.HK), which is China`s biggest property developer. Real estate firms like Evergrande are sitting on about 120 billion in offshore USD debt, nearly double 2016 levels. Reuters reported that “Morgan Stanley estimates that every 1 percent depreciation of the yuan could shave an average of about 3 percent off developers’ 2018 earnings per share.” Should the yuan weaken for any reason, the stresses are going to show up quickly in the property sector.
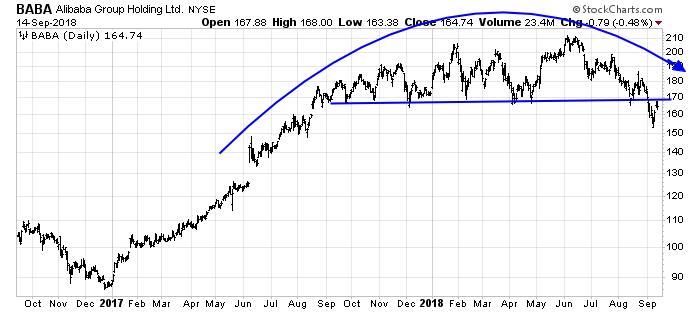
In addition, investors can also monitor Alibaba as a gauge of the health of the household sector.
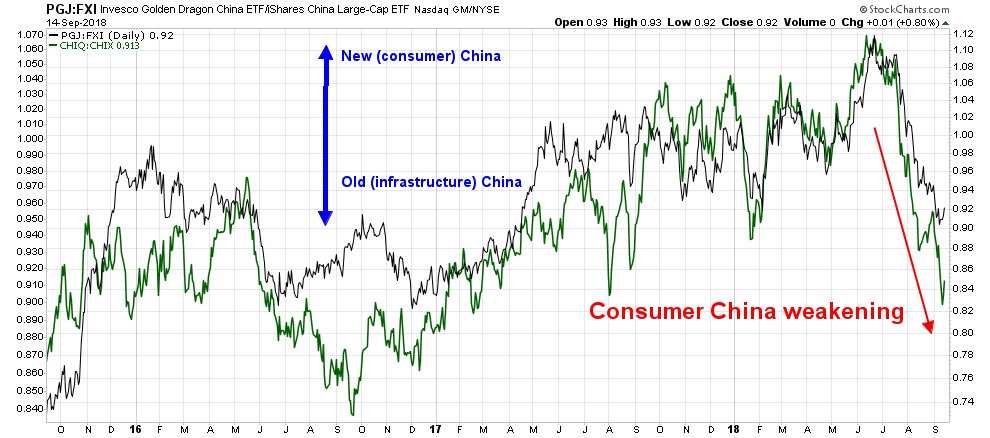
My New (consumer) China/Old (finance and infrastructure) China pair trades, which consist of long Golden Dragon China (PGJ)/short iShares China (FXI) and long Global X Consumer China ETF (CHIQ)/short Global X China Financials ETF (CHIX), are also showing similar levels of household sector stress.
Currently, the price of Evergrande has remained stable, while Alibaba has been rolling over, even before the announcement of CEO Jack Ma`s retirement. Bottom line, don`t panic just yet until both indicators really tank.
The week ahead: Don’t overstay the party
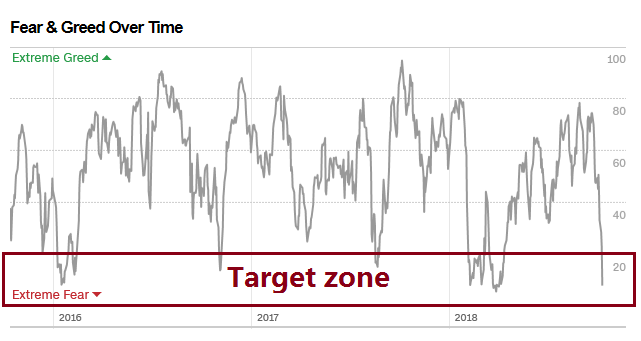
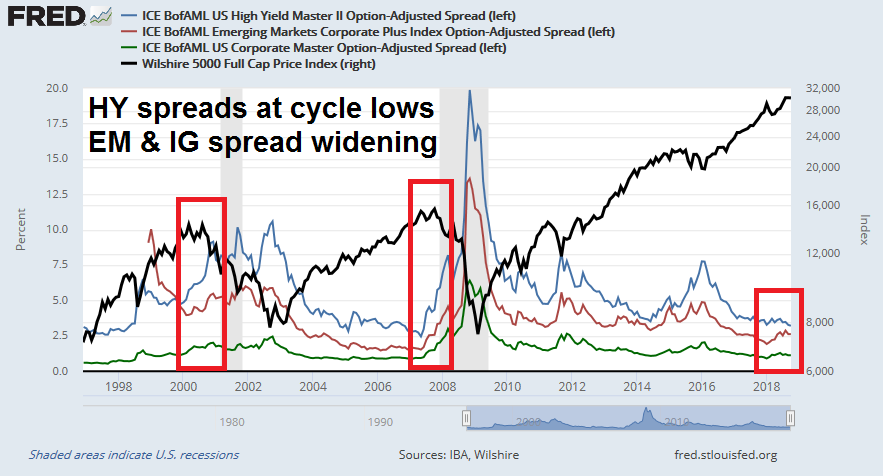
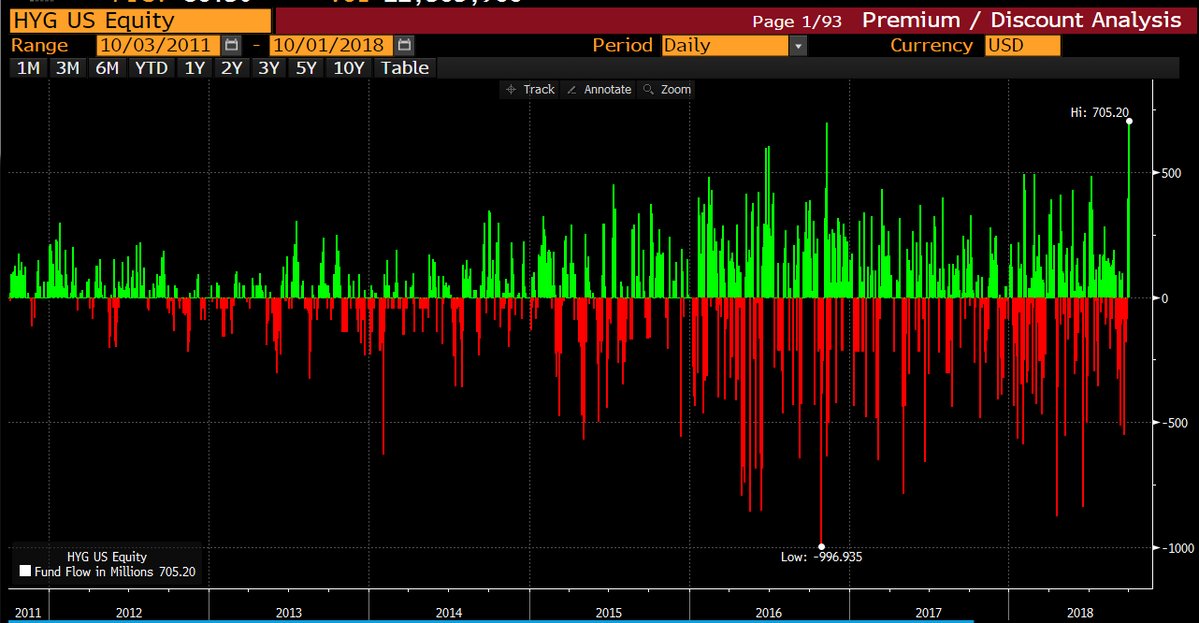
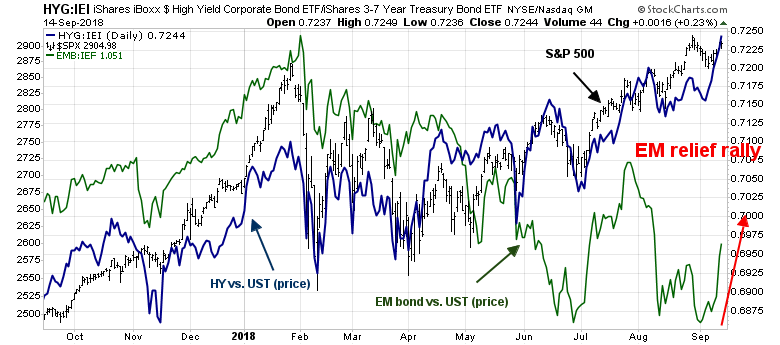
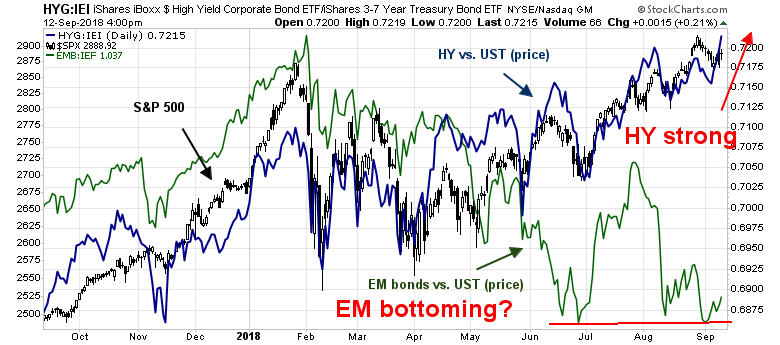
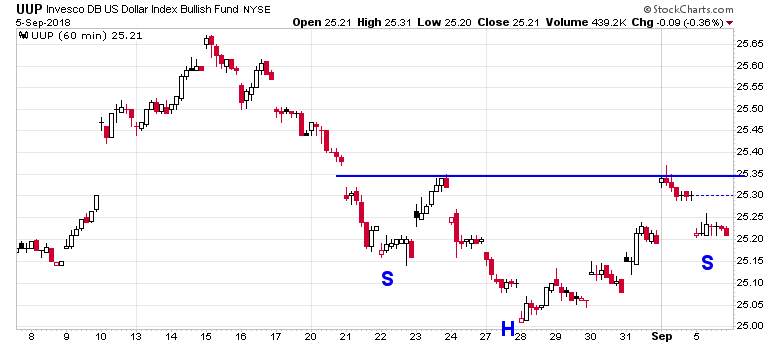
The bulls held a little get together for their friends last week, but don`t expect it to become a wild party. Much of the strength can be attributable to a relief rally as bearish sentiment got overdone. EM currencies rallied last week, including the beleaguered Turkish lira, and that was enough to spark an EM led risk-on relief rally. US high yield (HY) joined the party, as HY bond prices surged against equivalent duration Treasuries.
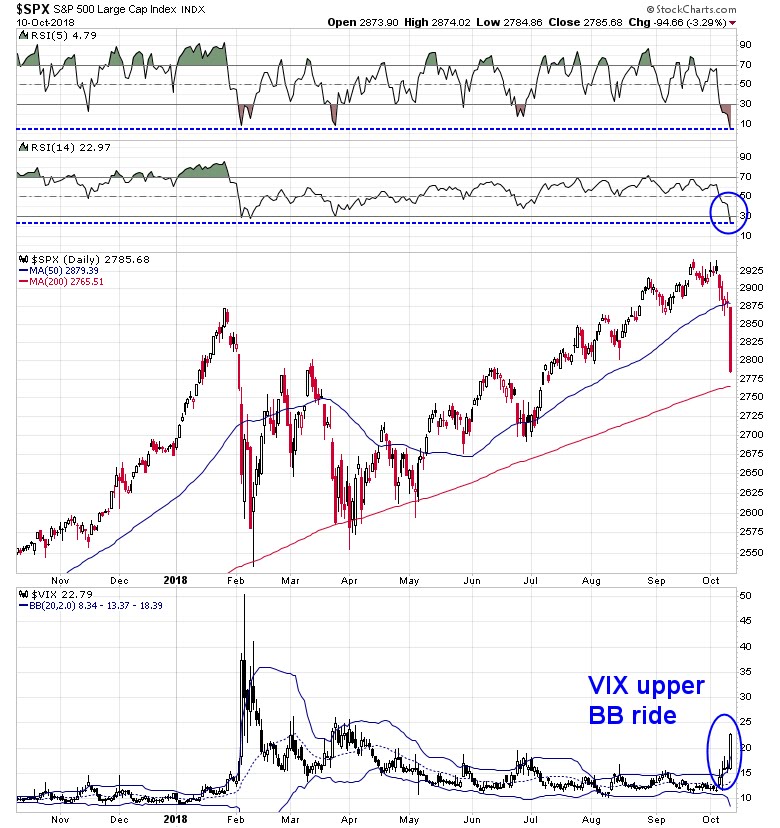
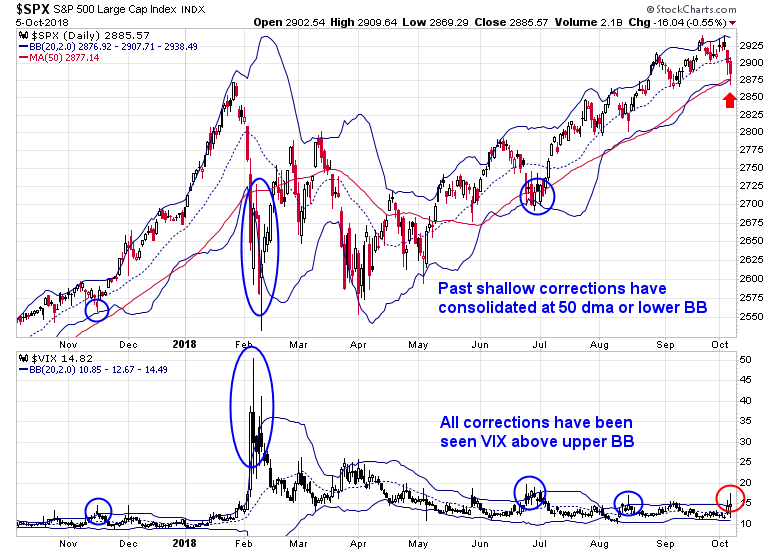
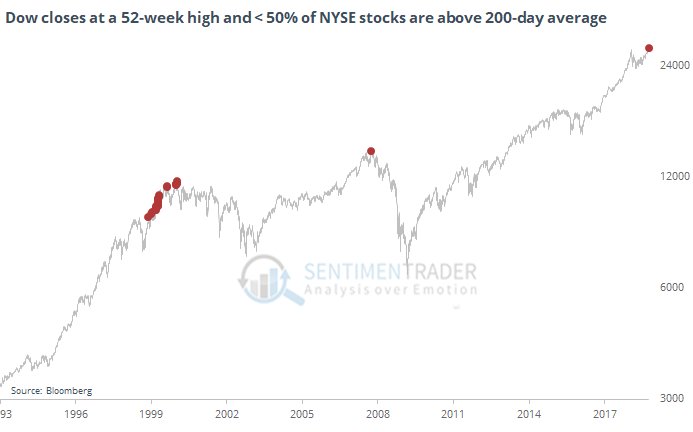
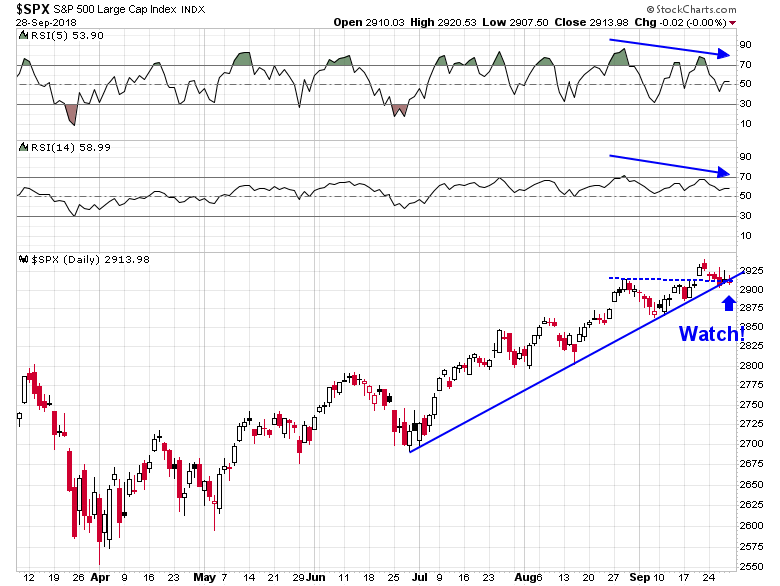
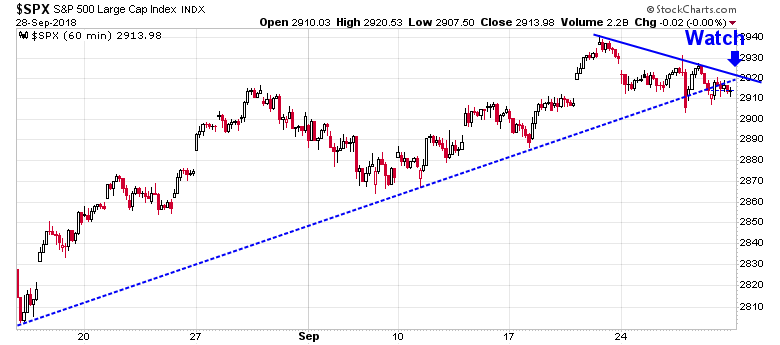
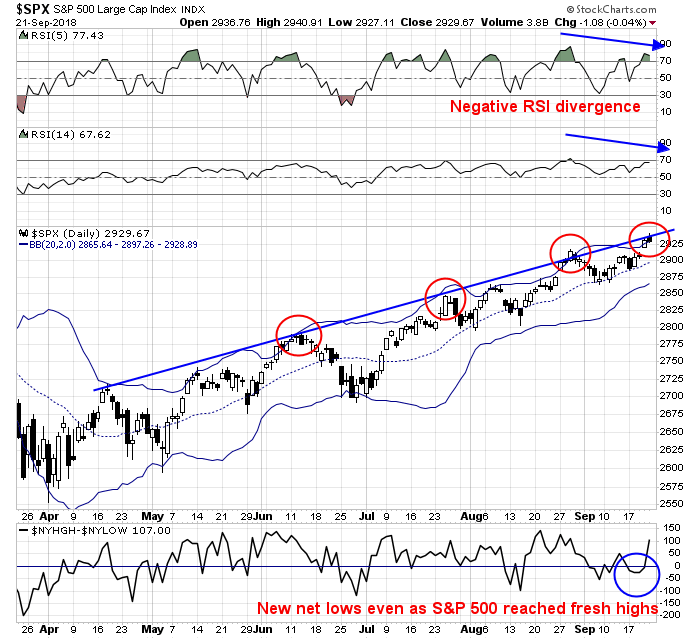
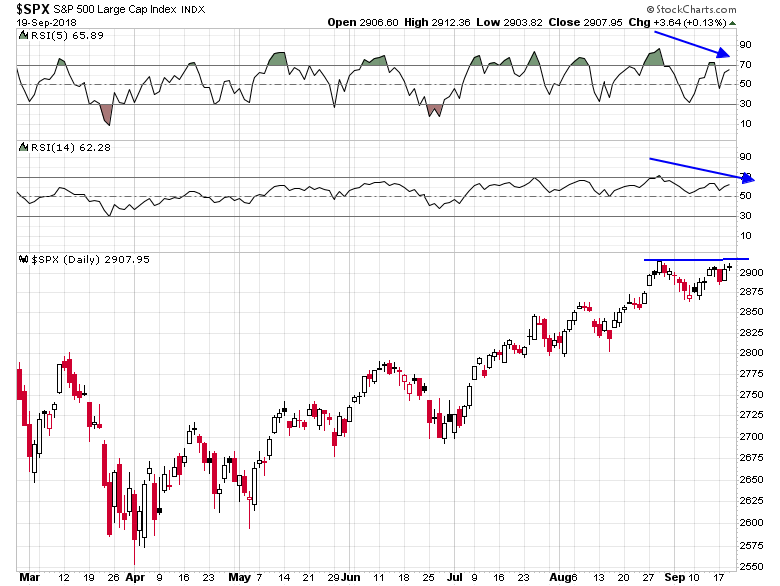
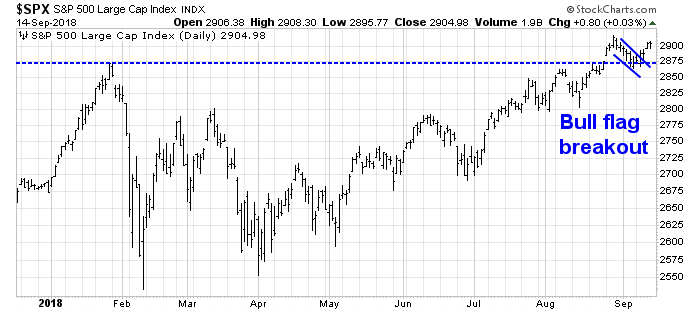
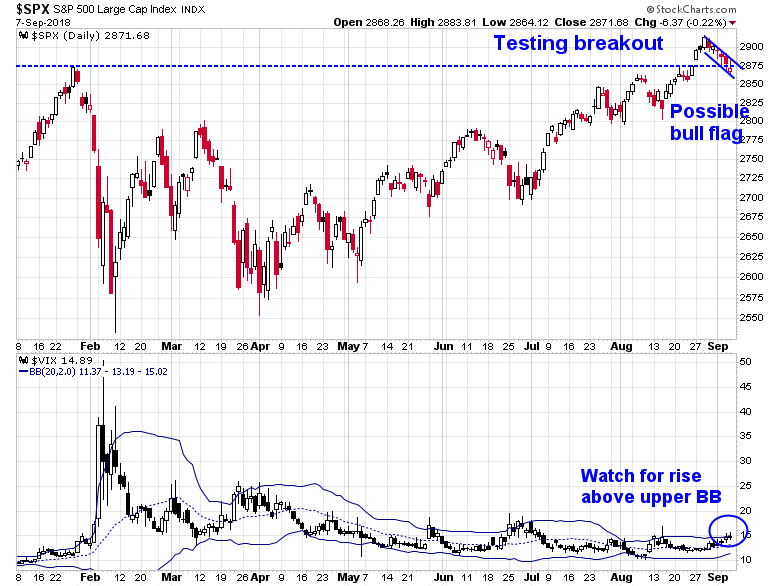
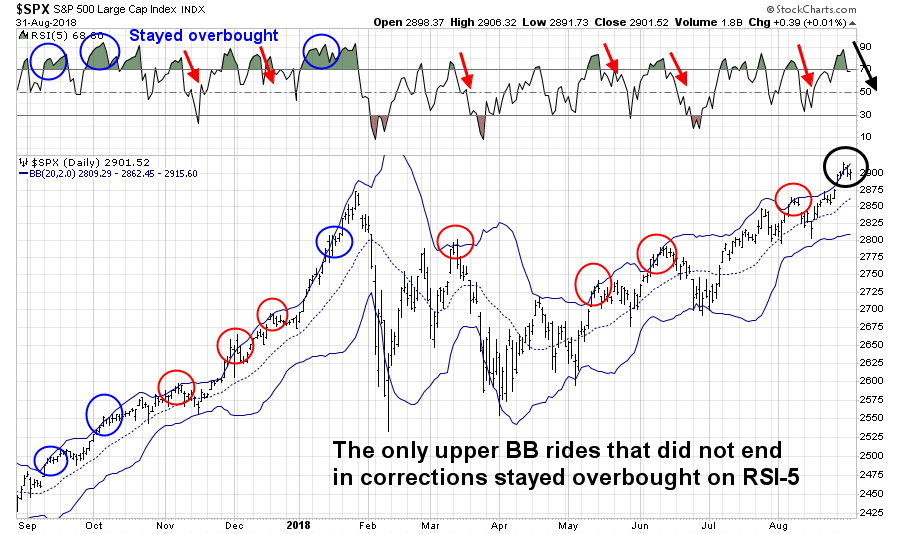
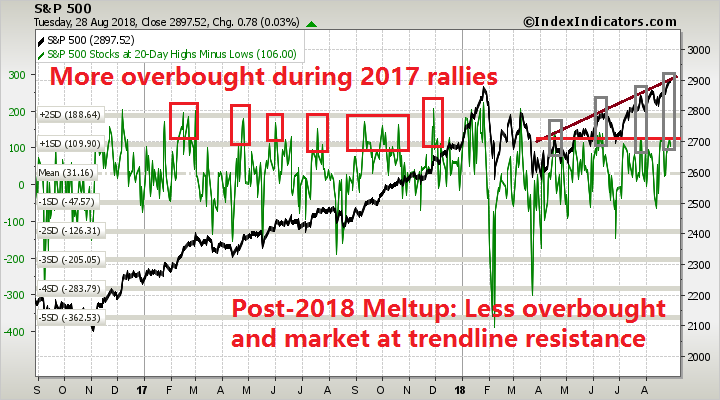
The S&P 500 pulled back and tested its breakout level. As well, the pullback formed a bull flag, which is a continuation pattern indicating higher prices. The index appears poised to test its previous highs, and possibly break out to another all-time high. Even then, an S&P 500 fresh high is still a sideshow compared to the market action of the DJIA.
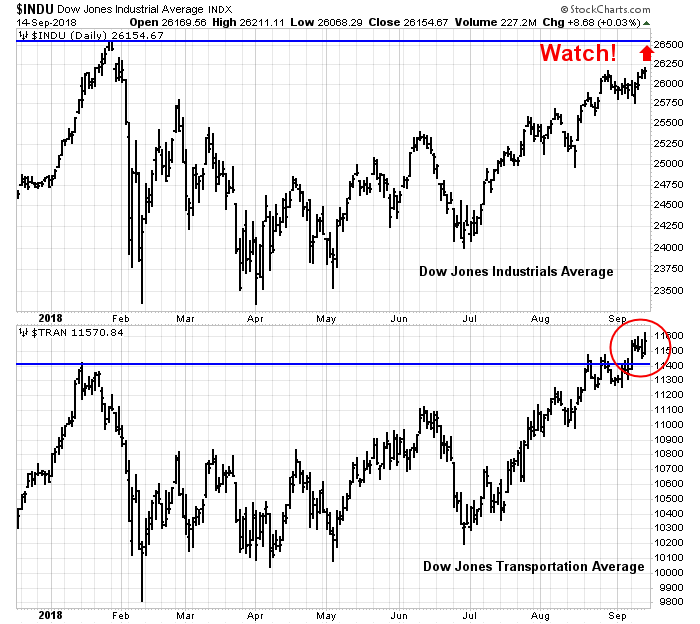
The major technical test is a key resistance level above the DJIA. The Transports has already made an all-time high. Should the DJIA stage an upside breakout, it would mark a Dow Theory buy signal.
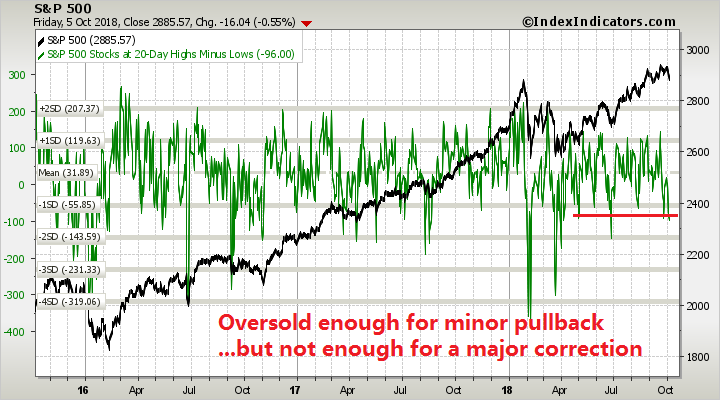
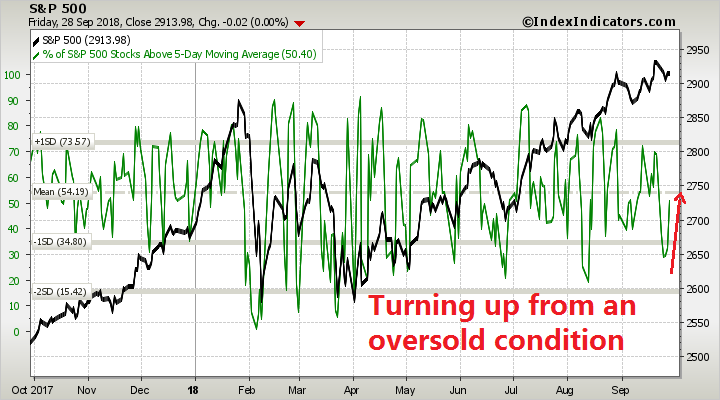
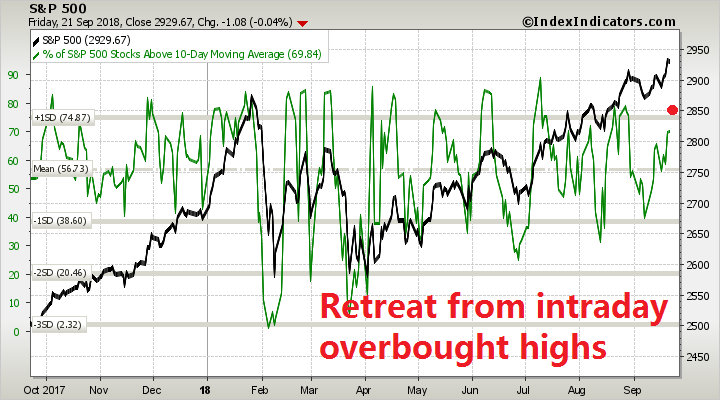
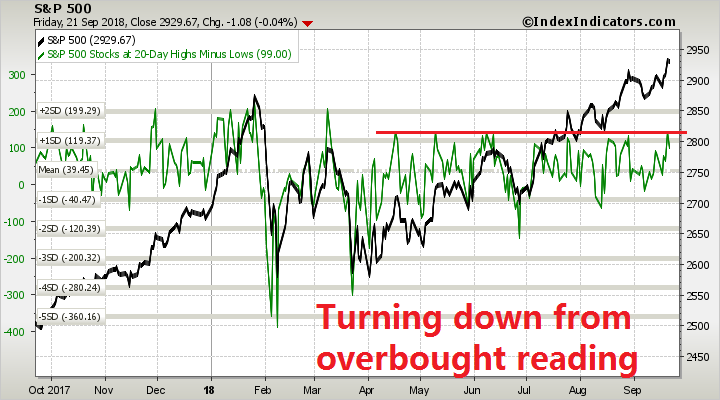
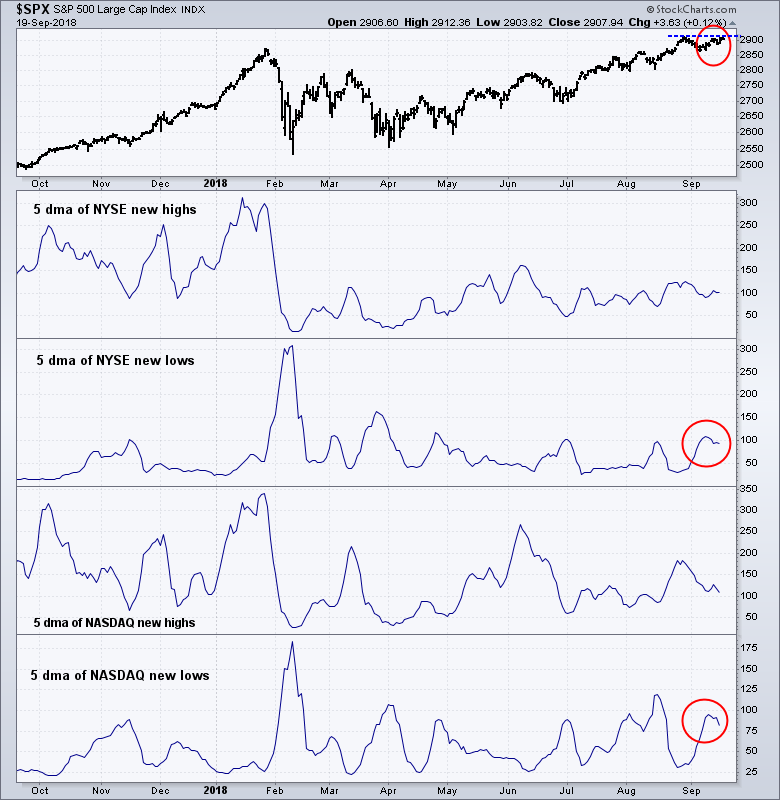
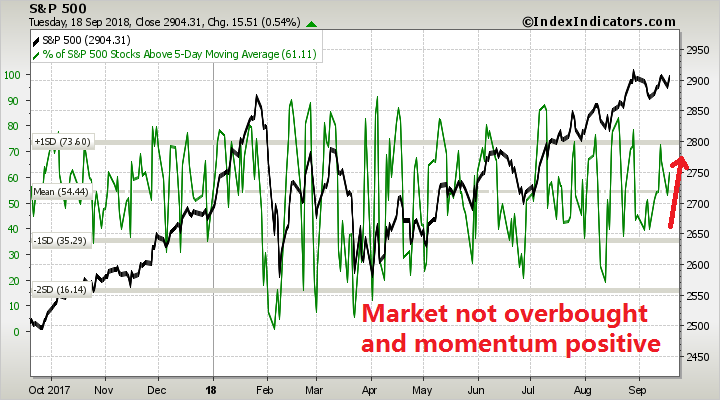
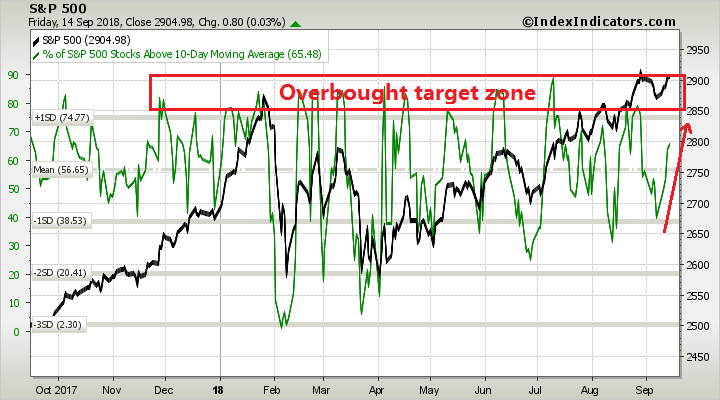
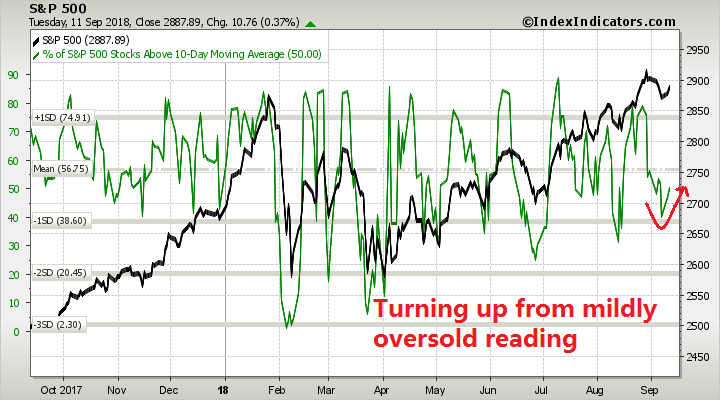
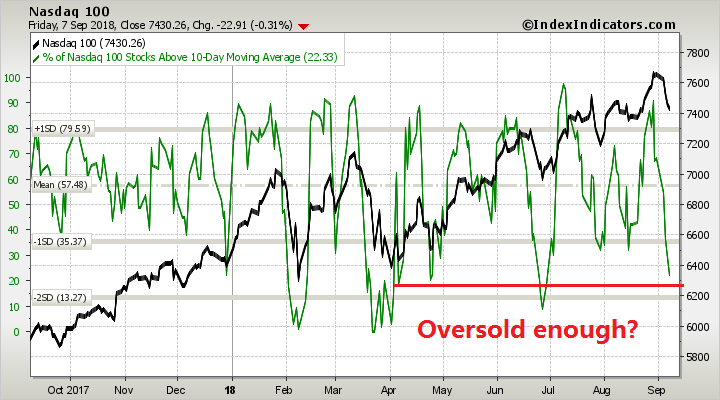
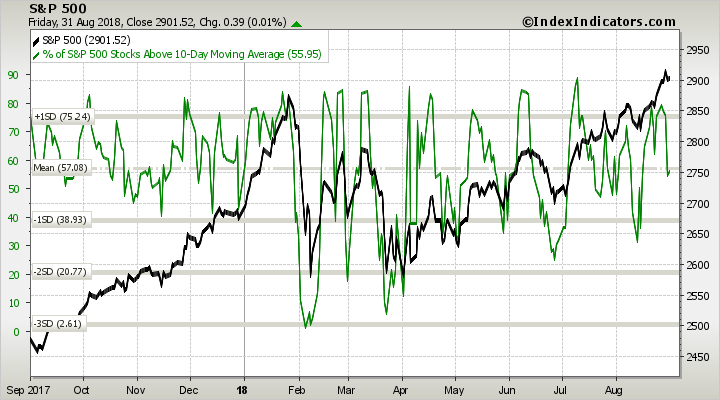
Short-term breadth indicators from Index Indicators show that readings are neutral, and the market is exhibiting positive price momentum. These conditions suggest that a short-term top is still ahead next week.
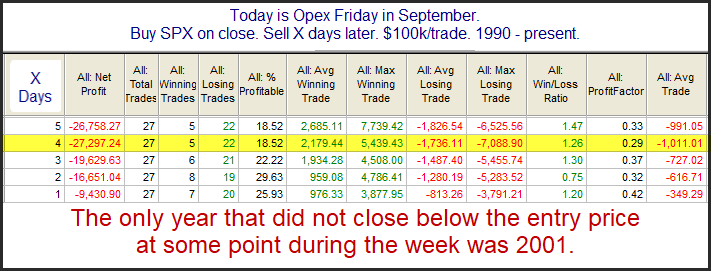
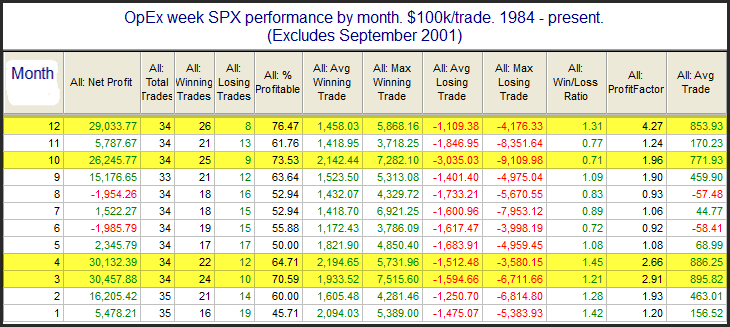
Next week is also option expiry week (OpEx). Rob Hanna at Quantifiable Edges found that September OpEx has tended to be bullish for equities.
However, I would not stay on the bullish bandwagon for too long. The FOMC meeting is scheduled for the following week. While a September raise is already baked-in, the market will be looking for hints of when the Fed might pause its pace of rate hikes. I don`t believe that the market has sufficiently discounted the hawkish tone from the likes of Powell, Williams, and Brainard. Their message is very clear. The Fed will keep raising rates until the economy shows signs of slowing.
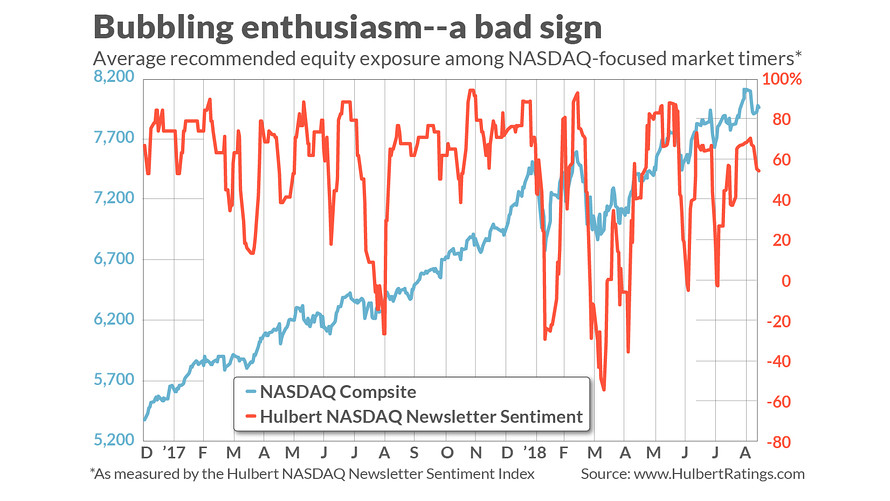
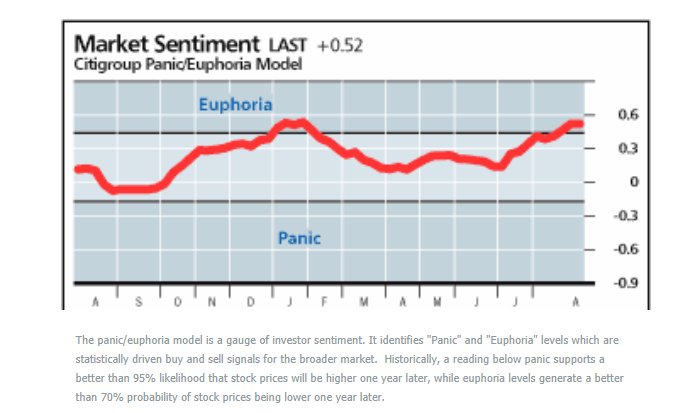
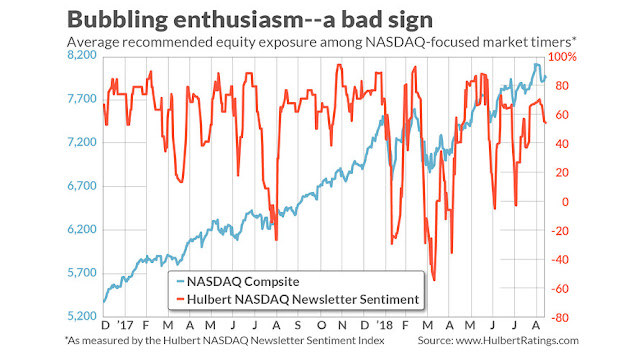
Mark Hulbert also pointed out that his sample of NASDAQ market timers are getting overly exuberant, which is contrarian bearish:
Consider the average recommended equity exposure among a subset of short-term market timers who focus on the Nasdaq market in particular (as measured by the Hulbert Nasdaq Newsletter Sentiment Index, or HNNSI). Since the Nasdaq responds especially quickly to changes in investor mood, and because those timers are themselves quick to shift their recommended exposure levels, the HNNSI is my most sensitive barometer of investor sentiment in the equity market.
This average currently stands at 64.9%, having risen in recent sessions to as high as 70.1%. On the occasion of my early-August column on stock market sentiment, in contrast, this average stood at minus 2.7%. This represents a significant shift towards irrational exuberance.
Accordingly, instead of the “wall of worry” that prevailed in early August, the current stock market mood is more akin to the “slope of hope” the market descends.
It’s interesting to note that this 70.1% recent reading is almost identical to the HNNSI level that prevailed on the day of the stock market’s late January high, when the HNNSI closed at 70.6%. The Nasdaq Composite fell almost 10% over the two weeks following its January high, and the S&P 500 lost even more.
My inner investor remains cautious. My inner trader is short-term bullish, but he recognizes that his positioning is only of a short-term nature.
Disclosure: Long SPXL