Preface: Explaining our market timing models
We maintain several market timing models, each with differing time horizons. The “Ultimate Market Timing Model” is a long-term market timing model based on the research outlined in our post, Building the ultimate market timing model. This model tends to generate only a handful of signals each decade.
The Trend Model is an asset allocation model which applies trend following principles based on the inputs of global stock and commodity price. This model has a shorter time horizon and tends to turn over about 4-6 times a year. In essence, it seeks to answer the question, “Is the trend in the global economy expansion (bullish) or contraction (bearish)?”
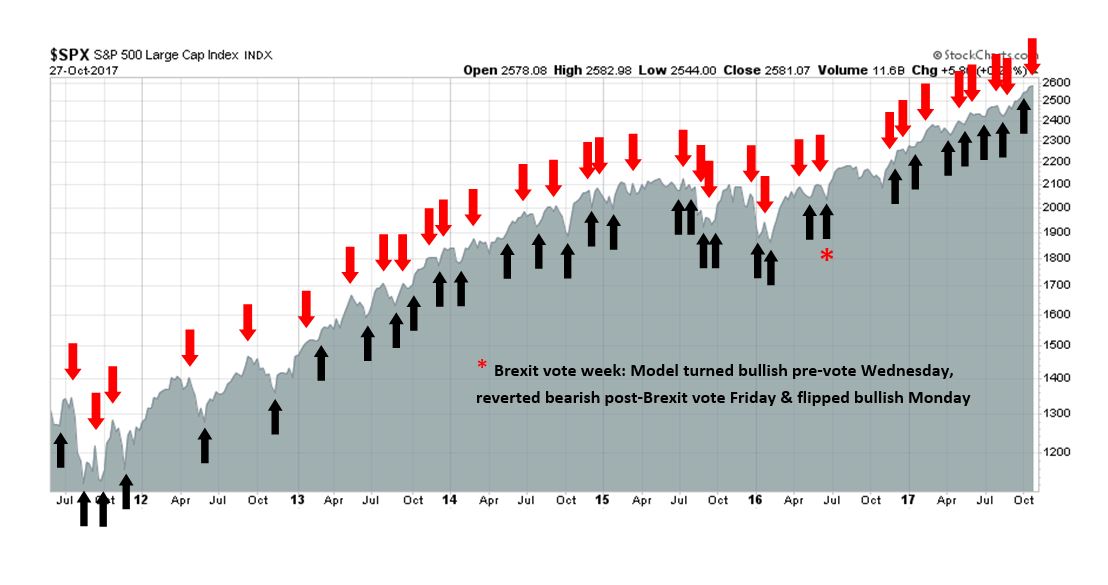
My inner trader uses the trading component of the Trend Model to look for changes in the direction of the main Trend Model signal. A bullish Trend Model signal that gets less bullish is a trading “sell” signal. Conversely, a bearish Trend Model signal that gets less bearish is a trading “buy” signal. The history of actual out-of-sample (not backtested) signals of the trading model are shown by the arrows in the chart below. Past trading of the trading model has shown turnover rates of about 200% per month.
The latest signals of each model are as follows:
- Ultimate market timing model: Buy equities
- Trend Model signal: Bullish
- Trading model: Bearish (downgrade)
Update schedule: I generally update model readings on my site on weekends and tweet mid-week observations at @humblestudent. Subscribers will also receive email notices of any changes in my trading portfolio.
Good news and bad news
We are about halfway through Q3 earnings season, and the market saw its share of ups and downs last week.
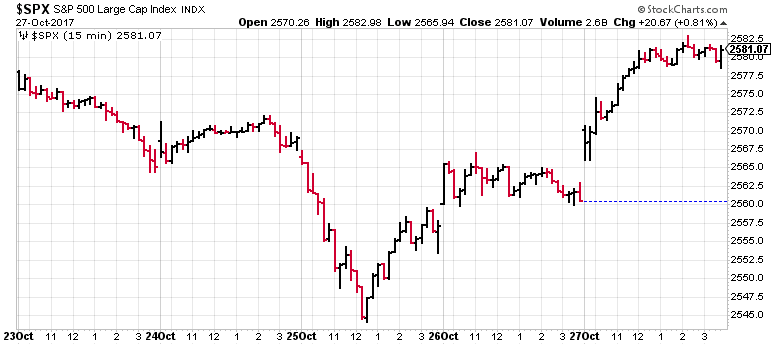
The market rallied to fresh highs on Friday, and leadership was provided by large cap FAANG stocks. Beneath the surface, there was a mixture of both good news and bad news for investors.
The good news
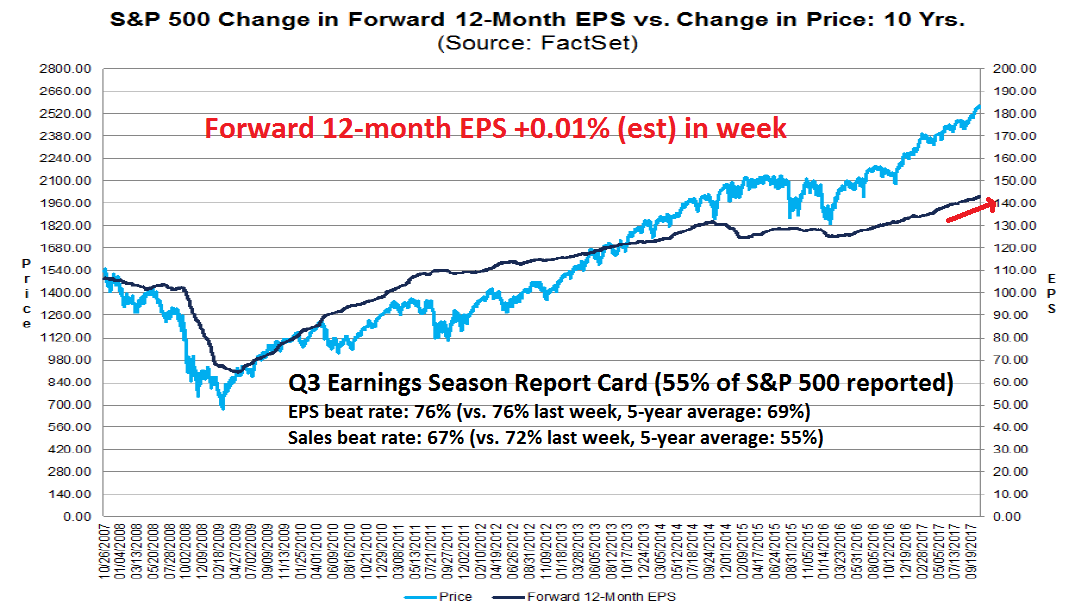
Let’s start with the good news. John Butters FactSet pointed out that, with 55% of the SPX having reported results, both the earnings and sales beat rates are well above historical average. As well, forward 12-month EPS continues to rise, which is reflective of positive fundamental momentum (all annotations are mine).
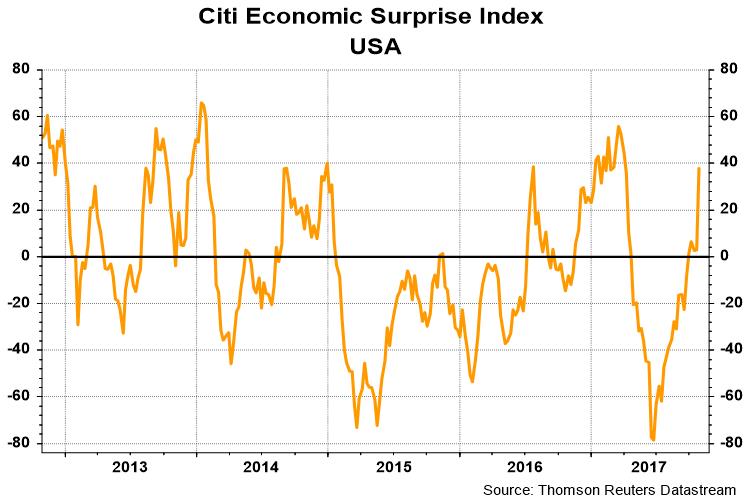
Q3 GDP grew at +3.0%, which beat expectations. This was a continuing series of positive macro-economic surprises that has lifted the Citigroup Economic Surprise Index to new recovery highs.
In addition, the latest update from Barron`s of insider trading activity is constructive and could be supportive of higher stock prices.
The bad news
Unfortunately, there is lot of bad news. Despite the positive headlines from FactSet`s analysis, the sales beat rate deteriorated from 72% last week to 67% this week, though the EPS beat rate remained steady at 76%. As well, forward 12-month EPS was up an anemic +0.01% in the week, which is hardly anything to get excited about.
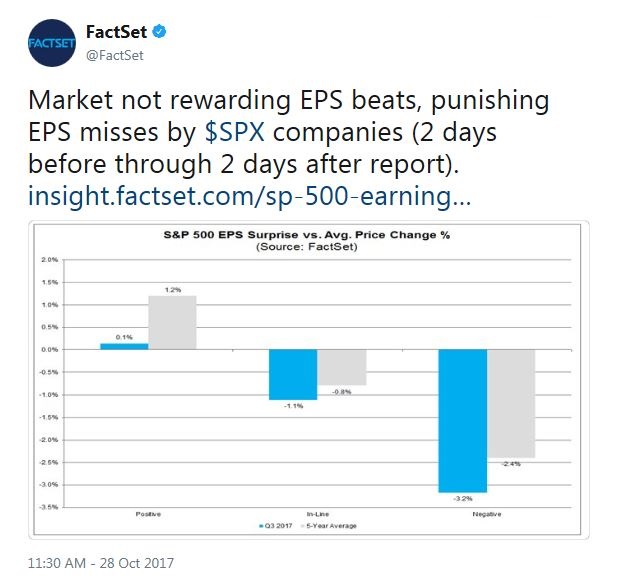
Another disappointment can be found in the market reaction to earnings results. FactSet observed that the market is barely rewarding earnings beats, but punishing misses.
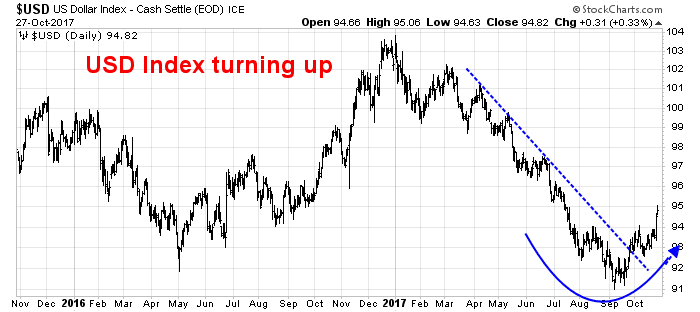
Another worrisome macro and fundamental headwind can be found in the strength of the USD. FactSet found that companies with greater foreign exposure tended to see better sales and earnings growth.
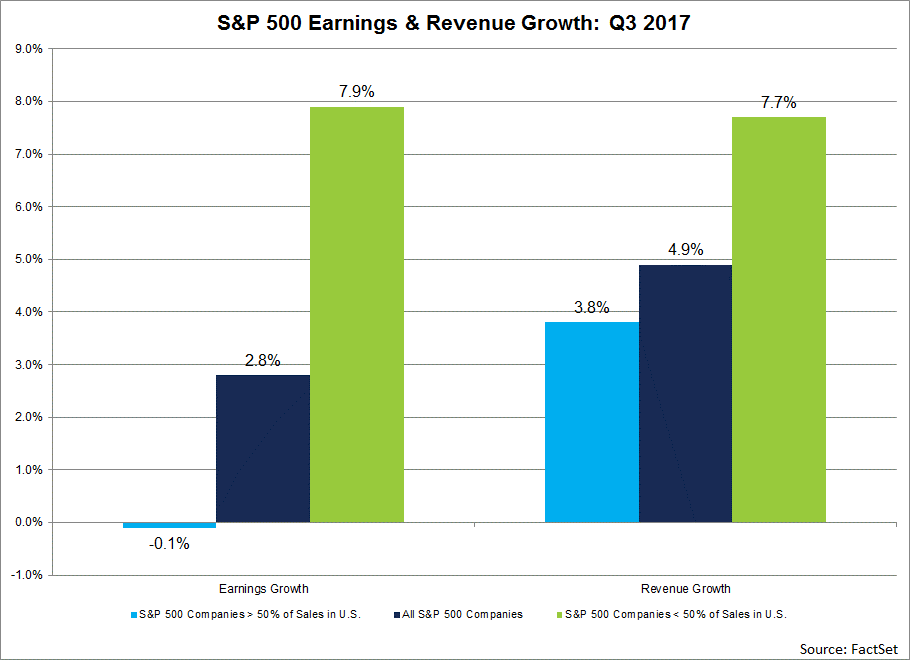
However, much of those Q3 EPS gains can be attributable to USD weakness. As the USD strengthens, large cap multi-national companies are likely to see a reversal of the currency effect. In other words, don’t expect the same pace of sales and earnings growth in Q4 as Q3.
Another ominous theme from earnings calls is rising inflation. Higher input costs, such as wages and materials, are squeezing operating margins as companies have been reluctant to raise prices (via Avondale Investment Management).
“There is some commodity inflation, but the biggest drag that we’re facing right now is related to the labor investments that are being made.” —McDonald’s (Restaurants)
“The labor market in the U.S. is extremely tight, hard to find people.” —Manpower (Temp Staffing)
“we’re now estimating about a $300 million profit hit from higher commodity costs.” —Procter and Gamble (CPG)
“scrap price has moved up and we were unable to move plate prices up with scrap prices. So we started to see a margin compression and that’s where we live now. We’re living in a margin-compressed world today.” —Nucor (Steel)
“we continue to have a positive view on domestic steel consumption…This will be a solid foundation for a strong pricing environment as the macro market drivers continue to be persuasive…These dynamics could create a tight market and lead to significant price appreciation as we saw at the end of last year…I just see it setting up a very, very positive pricing environment for the first quarter of 2018 and all the way through 2018.” —Steel Dynamics (Steel)
“we are seeing a little bit of resistance at the higher price points because of affordability and I think that’s a broader concern that affects the entire business.” —Pulte Home (Homebuilder)
There is widespread anecdotal evidence of tightening labor markets. We will get a more complete picture when the October Jobs Report is released this coming Friday.

The bottom-up signs of rising inflationary pressures are supportive of the Fed’s decision to continue with its rate normalization policy. Expect more a hawkish tilt from the Fed, regardless of who is nominated as the chair.
Dark clouds in GDP report
There were also a number of negatives in the upbeat Q3 GDP report that beat Street expectations. New Deal democrat pointed out that the two components of his leading indicators from the GDP report are showing signs of weakness.
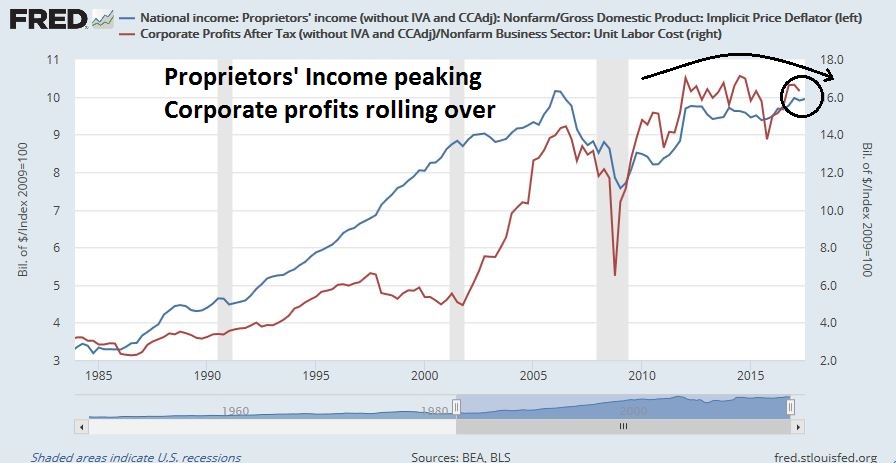
Proprietors’ Income, which is a data item that gets released before NIPA corporate profits, failed to achieve a cycle high for a second quarter in a row. Both proprietors` income and corporate profits appear to be rolling over, which is a negative sign for the economy.
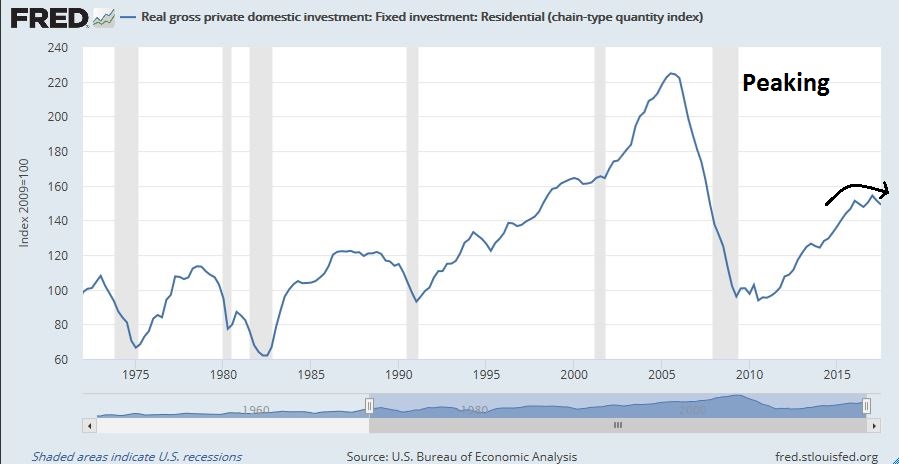
Real private residential investment is also showing signs of peaking.
These reports are consistent with NDD’s weekly analysis of high frequency economic indicators that “the present and near future economy looks strong than at any time during this expansion. The picture among long leading indicators deteriorated further this week…confirms a neutral outlook one year out.” Combined with the prospect of a hawkish Fed, the outlook for equities is becoming increasingly cloudy.
Negative divergences everywhere
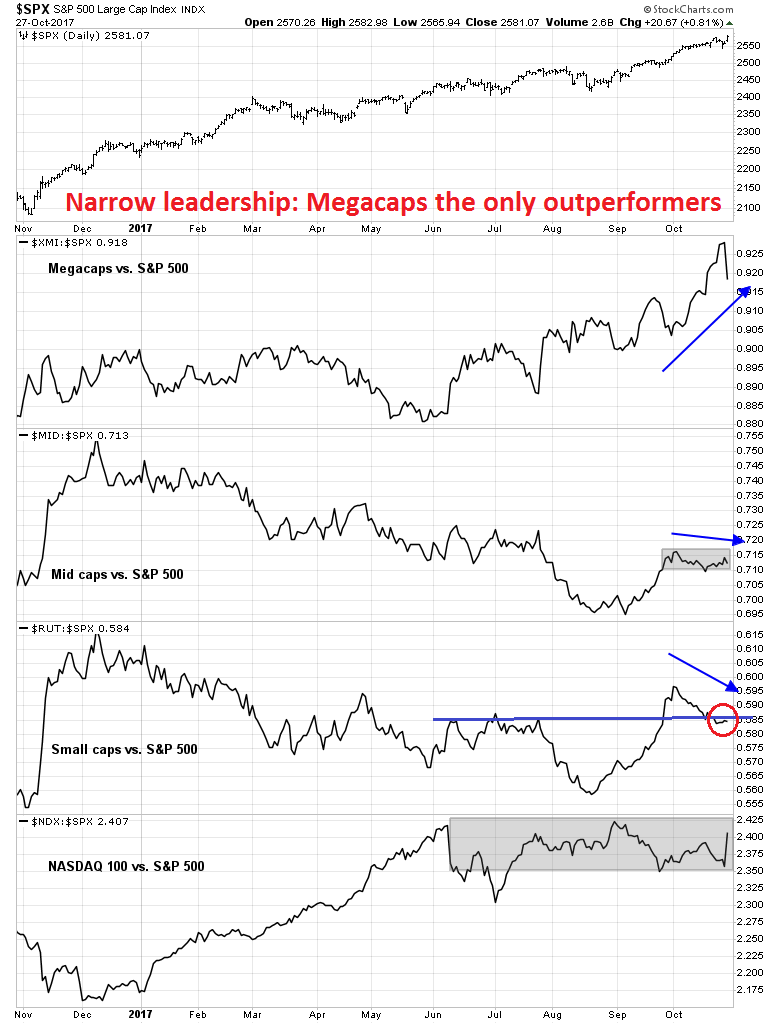
From a technical perspective, the equity outlook is equally fragile. Last week’s advance was accomplished with evidence of narrow breadth. Leadership was only provided by the megacap stocks. The mid caps, small caps, and even NASDAQ 100 stocks were either range bound or declining relative to the SPX.
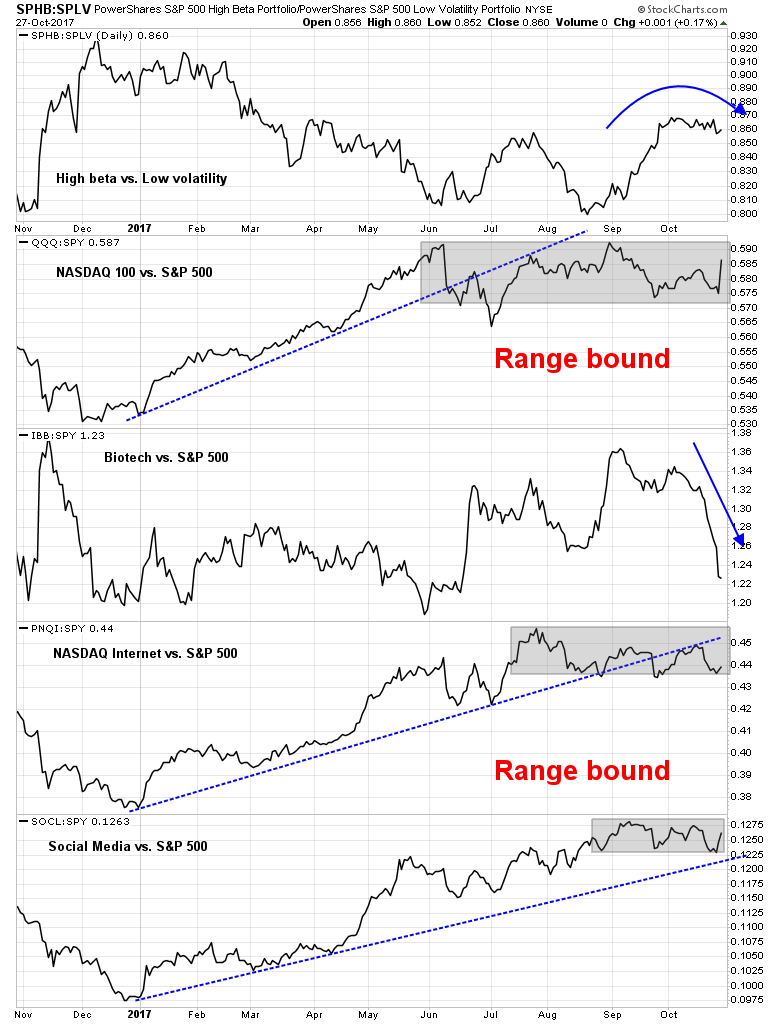
An analysis of the relative performance of high beta groups tells a similar story. The relative performance of the High beta ETF (SPHB) vs. the Low volatility ETF (SPLV) appears to be rolling over. Except for the Social Media stocks, which is dominated by FB, the relative performance of all other groups, namely Biotech, NASDAQ Internet, and NASDAQ 100, are either rolling over or range bound.
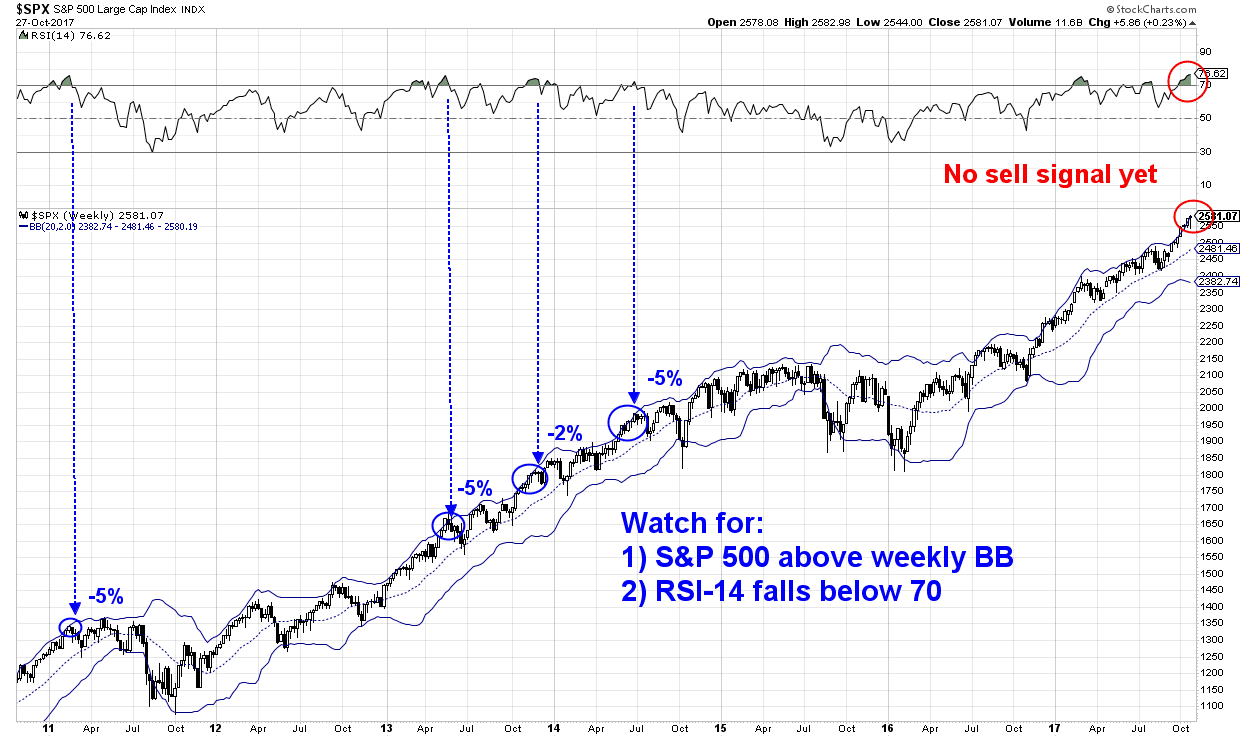
There are also signs of negative divergences everywhere. Even though the SPX staged a breakout to new all-time highs, the RSI-5, RSI-14, and net new highs-lows are not confirming the new highs.

To be sure, the weekly chart of the SPX remains above its upper Bollinger Band, and the weekly RSI Indicator has not flashed a sell signal yet. That is a positive sign for the bulls.
Brace for volatility
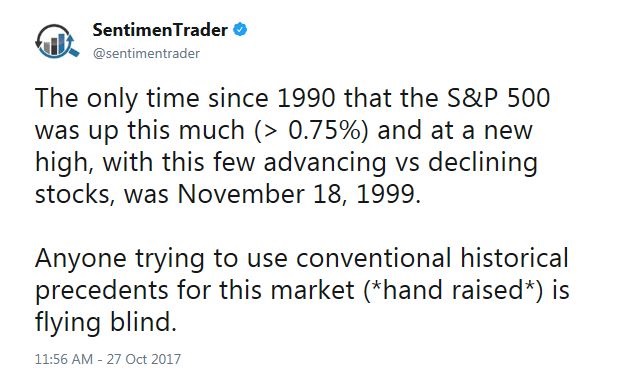
Do all-time highs normally look like this? Sentiment Trader observed that the market is in uncharted territory. Despite all of the warning signs, the market is undergoing a slow melt-up phase and anything can happen.
Next week, there are numerous sources of event driven volatility.
- The first charges from the Robert Mueller probe may be unsealed on Monday.
- The GOP is expected to unveil its tax plan Wednesday.
- The FOMC will conclude its meeting on Wednesday.
- Trump is expected to announce the nomination of a Fed chair some time next week.
- There will also be numerous key macro reports next week, including Core PCE (Monday), Personal Income (Monday), Employment Cost Index (Tuesday), ISM (Wednesday), and the Jobs Report (Friday).
My inner investors remains neutrally positioned, with his asset allocation at his investment policy target weight mandates. My inner trader initiated a small short position last week, and may add to it should the market rise further.
Disclosure: Long SPXU