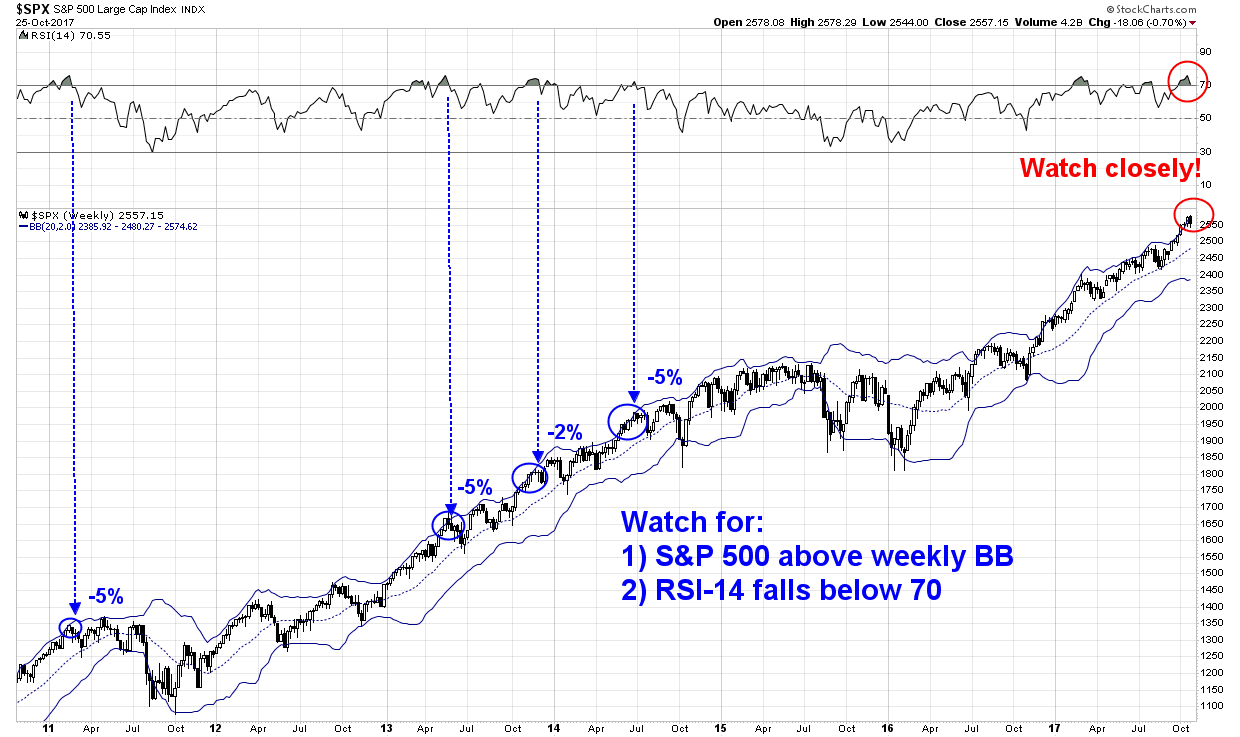
Mid-week market update: The SPX has been on an upper Bollinger Band (BB) ride on the weekly chart, and I have been waiting for a downside break on the weekly RSI-14 indicator as the signal that a correction is starting. Current readings show that the weekly RSI has not broken down below 70 tet.
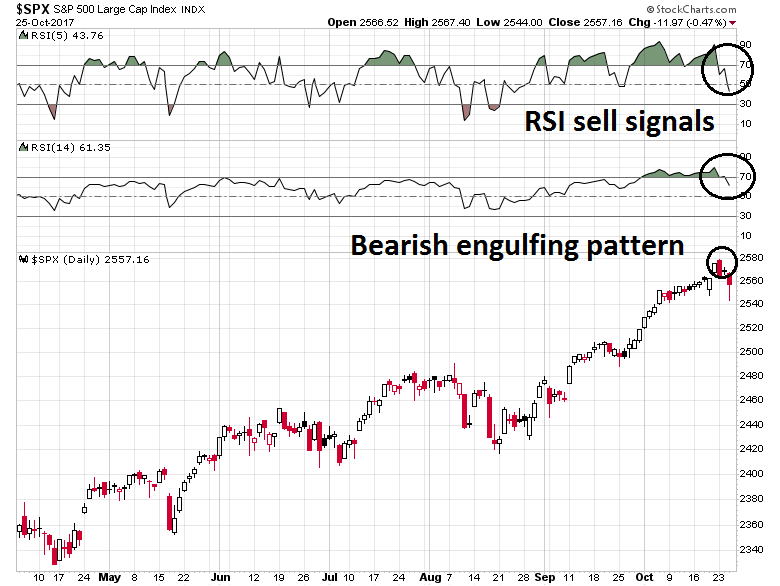
However, a downside break could also be seen on the daily chart. RSI-5 has broken down below 70, which is a short-term sell signal. RSI-14 has also followed suit, which is another bearish sign. The index also experienced a bearish engulfing pattern on Monday, which is potentially ominous.
The bear case
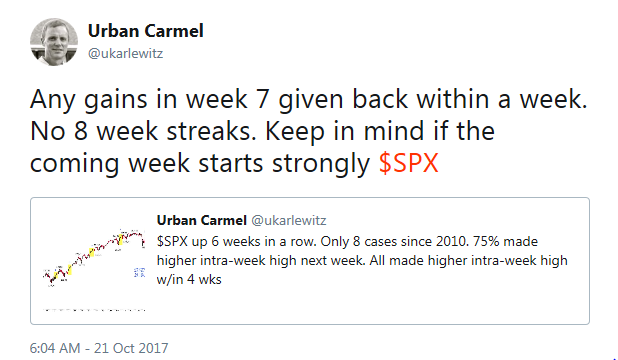
Urban Carmel pointed out last weekend that the market is now in the seventh week of consecutive weekly gains, which historically has not ended well.
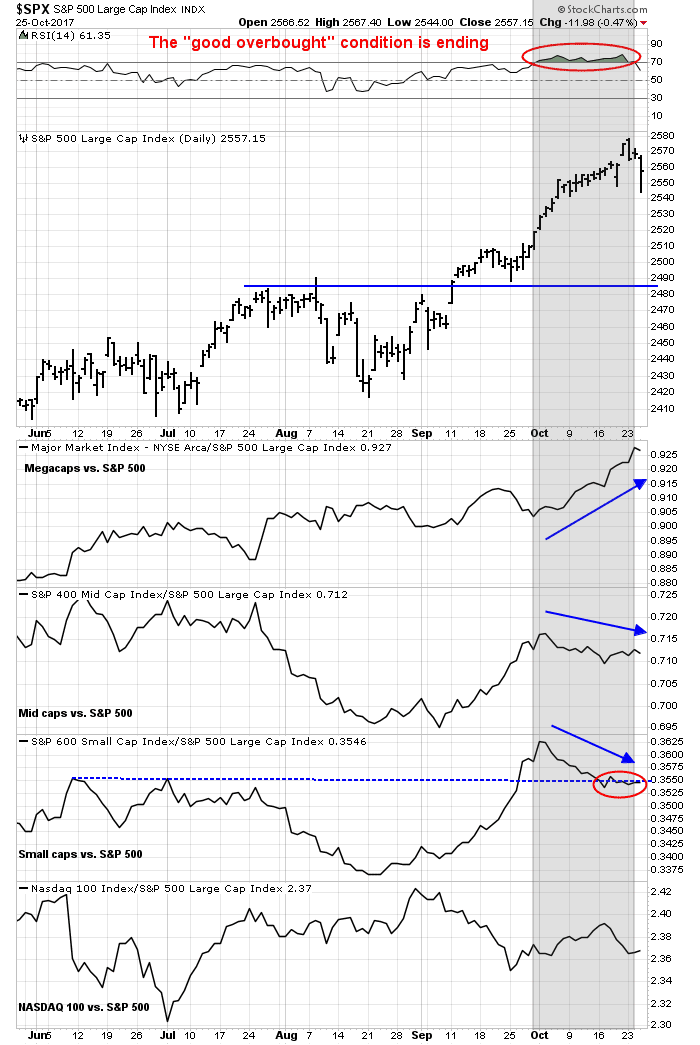
Equally disturbing are signs of diminishing breadth during the period where the RSI Indicator was exhibiting a “good overbought” condition (shaded region). At this point, only the megacap stocks are exhibiting any signs of market leadership.
A shallow correction?
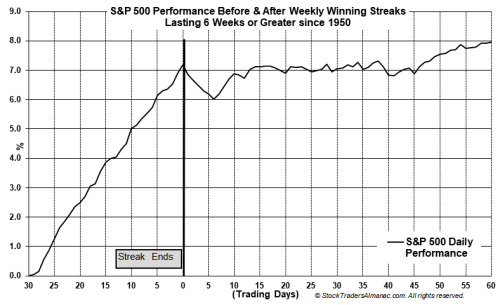
The cautionary signs exhibited by a potential downside break from the weekly RSI signal has historically led to 2-5% downdrafts. However, I would expect that any correction to be fairly shallow. Jeff Hirsch of Almanac Trader found that the end of long winning streaks tend to resolve themselves with a short pullback, followed by a period of sideways consolidation.
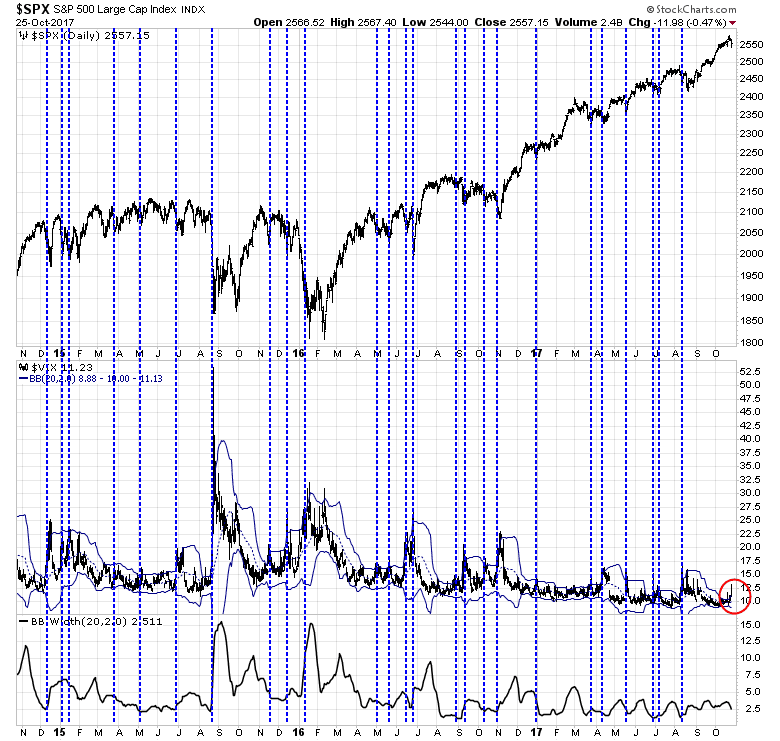
In addition, one of outcomes of the recent period of low volatility has had the perverse effect of the VIX flashing an oversold buy signal for stocks on the shallow pullback this week. As shown by the chart below, the VIX Index has climbed above its upper BB, which is an oversold signal for the stock market. Past episodes, which are marked by vertical lines, have been buy signals for the market. Moreover, the BB width is not particular low by historical standards, and therefore the lack of recent volatility is not an excuse to ignore this signal.
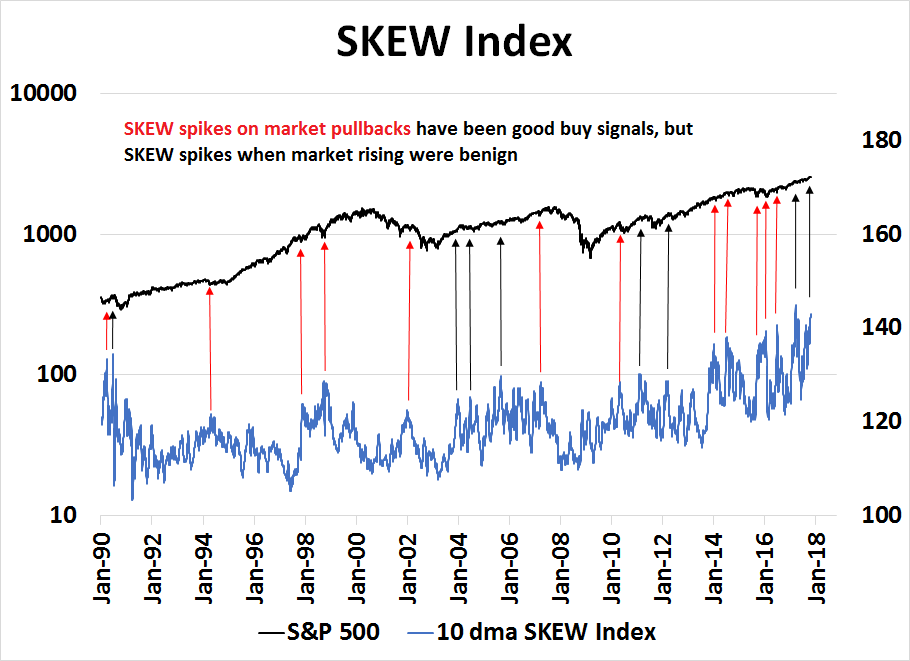
As well, one little known indicator from the option market is showing a high degree of anxiety. The SKEW Index, which measures the price of tail-risk protection, is spiking. In the past, SKEW spikes when the market has pulled back (red arrows) have been reasonably good contrarian buy signals, but SKEW spikes when the market was rising (black arrows) have resolved themselves in relatively benign ways.
The Fed chair wildcard
One potential source of volatility is the announcement of the nomination of the Fed chair, which is expected to occur before the start of November. Bloomberg reported that Yellen is finding support in Trump himself, who stated in a Fox Business News interview, “I like her a lot”. However, Bloomberg also reported that Trump informally polled Republican senators yesterday as to their preferences for a Fed chair.
The president, in a lunch meeting with Senate Republicans on Tuesday, asked for a show of hands in support of Yellen and other contenders for the job — Stanford University economist John Taylor and Fed governor Jerome Powell. He didn’t announce a winner and most of the senators didn’t raise their hands. But of those who did, “I think Taylor won,” said Senator Tim Scott of South Carolina.
The market is already starting to price in the possibility of a more hawkish should the Fed take a more drastic change in direction. A Yellen renomination or a Powell nomination would be regarded as equity bullish because they represent the status quo. A Taylor nomination would be viewed as bearish, as he is believed to be considerably more hawkish (see What would a Taylor Fed look like?).
However, there are other scenarios where the market reaction would be difficult to predict. The bigger question is whether John Taylor is on the Fed board in some capacity. Imagine Yellen as chair, and Taylor as vice chair. Assuming that John Taylor would accept a position as vice chair, I believe that such an outcome would tilt policy in a slightly more hawkish direction. Market expectations would then move quickly towards the dot plot, which calls for one more rate hike in 2017, and three quarter-point hikes in 2018. Such a pace of rate hikes is well beyond current market expectations, and the presence of Taylor on the Fed board would likely be viewed as equity bearish.
The road forward
My base case scenario calls for a short and shallow sell-off in the next week. The historical evidence suggests that any weakness should be viewed as an opportunity to buy the dip.
For the time being, the “arrow” on the Trend Model is changing from a buy signal, or up arrow, to a down arrow, or a sell signal. My inner trader has sold his long SPX position and flipped to a small short position.
Disclosure: Long SPXU
Sentimentrader.com reported that VIX was recently rising even with the market going up. That’s unusual and has in the past signaled weakness ahead. They think it is a sign of smart money taking a position.
I bought VXX on a stop buy using a 10 day simple moving average line as the trigger. Will exit on a stop sell using the same. When I was first.filled I put in a stop loss 3% below my purchase price.
This may be the first 5% correction in a dog’s age.
Here is the chart https://product.datastream.com/dscharting/gateway.aspx?guid=8c4e3a1a-552b-4f24-b32a-05a3b91715a1&action=REFRESH
Hi Cam – I think it is time again for the sector rotation analysis, especially with the melt up in the FANG stocks today. Thanks!