Preface: Explaining our market timing models
We maintain several market timing models, each with differing time horizons. The “Ultimate Market Timing Model” is a long-term market timing model based on the research outlined in our post, Building the ultimate market timing model. This model tends to generate only a handful of signals each decade.
The Trend Model is an asset allocation model which applies trend following principles based on the inputs of global stock and commodity price. This model has a shorter time horizon and tends to turn over about 4-6 times a year. In essence, it seeks to answer the question, “Is the trend in the global economy expansion (bullish) or contraction (bearish)?”
My inner trader uses the trading component of the Trend Model to look for changes in the direction of the main Trend Model signal. A bullish Trend Model signal that gets less bullish is a trading “sell” signal. Conversely, a bearish Trend Model signal that gets less bearish is a trading “buy” signal. The history of actual out-of-sample (not backtested) signals of the trading model are shown by the arrows in the chart below. Past trading of the trading model has shown turnover rates of about 200% per month.
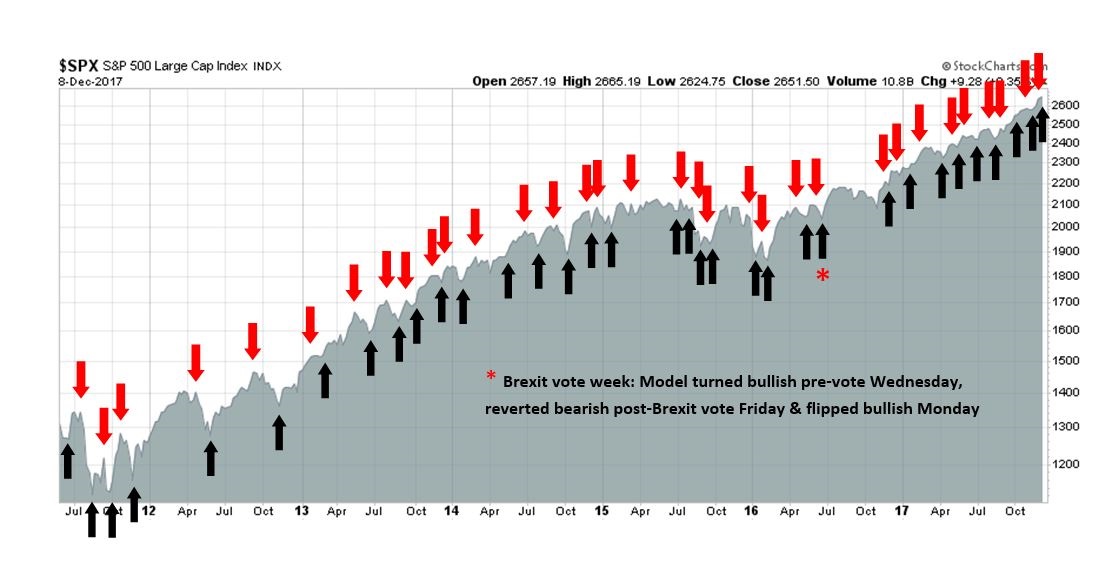
The latest signals of each model are as follows:
- Ultimate market timing model: Buy equities
- Trend Model signal: Bullish
- Trading model: Bullish
Update schedule: I generally update model readings on my site on weekends and tweet mid-week observations at @humblestudent. Subscribers will also receive email notices of any changes in my trading portfolio.
Party on!
Friday’s November Jobs Report highlighted a number of important bullish data points for the stock market in the weeks ahead. The headline non-farm payroll release came in ahead of expectations, while average hourly earnings missed. At the margin, tame wage pressure which will restrain the Fed from becoming overly aggressive in raising rates.
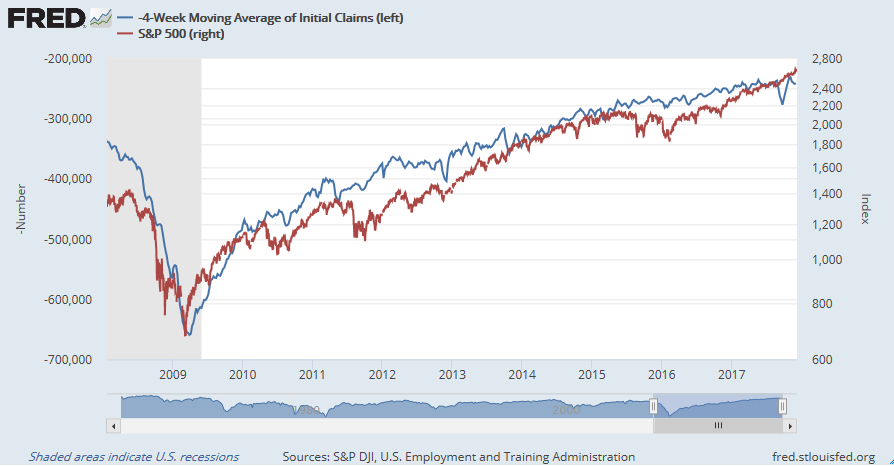
As well, Thursday’s release of initial jobless claims also underlined the remarkable inverse correlation between initial claims (inverted scale) and stock prices. So far, the continuing improvement in initial claims is supportive of higher equity prices.
In his latest update of high frequency economic data, New Deal democrat painted a bright picture for the near term, and an improving long term outlook:
The nowcast and the near term forecast remain very positive, with only relatively strong oil prices juxtaposed with relatively weak commodity prices as flies in the ointment. The longer term forecast, which I briefly downgraded to neutral, is weakly positive again.
Throw in the anticipated corporate tax cuts, it is difficult to contain our short-term enthusiasm. This week, I review my Recession Watch indicators and find that the current snapshot of recession risk is receding, though there are still some key risks on the horizon (also see Things you don’t see at market bottoms: Rational exuberance edition).
A leading indicator review
As a reminder, my Recession Watch indicators is a set of seven leading indicators designed to spot a recession a year in advance. They are split into three broad categories, the consumer and household sector, the corporate sector, and financial and monetary conditions.
Starting with the household sector, the outlook looks bright. Real retails sales are rising with no signs of a top in sight.

The housing sector is a highly cyclical measure of consumer durables. Peaks in housing start have historically been recessionary warnings. The latest figures show that housing starts are recovering after a weak patch, though some of the surge may be related to hurricane rebuilding. That said, this sector is likely to face artificial headwinds next year as higher Canadian lumber prices and the partial loss of mortgage interest destructibility raise housing prices and dampen demand.

On the other hand, real private residential investments have not recovered as strongly. However, this is a quarterly data series, compared to the more timely monthly frequency of housing starts.

On the surface, the consumer and household sector is in good shape. However, the lack of wage growth suggests that households are spending in anticipation of better times ahead. To cope, they are either digging into their savings, or borrowing to keep up with consumption.

This is not anything to panic over, but these conditions represent a cautionary flag longer term.
Corporate sector: Mildly positive
Conditions in the corporate sector can be best described as mildly positive. Historically, corporate bond yields have bottomed out well before the onset of a recession. Current readings show that corporate bond yields are falling, but the last low occurred in August 2016. This indicator tends to be very early, so it is nothing to worry about yet.

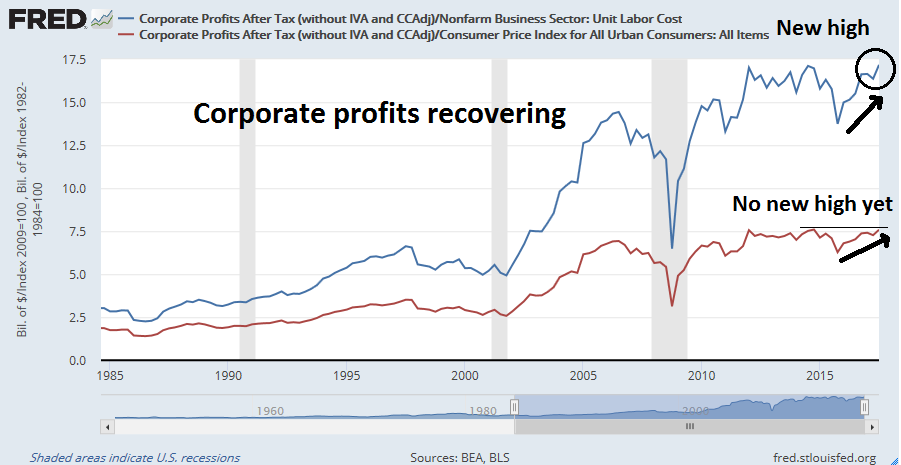
NIPA corporate profits are recovering after oil prices cratered in 2015. Corporate profits to unit labor costs (blue line) have made a new high for the cycle, though real corporate profits (red line) just missed the new high.
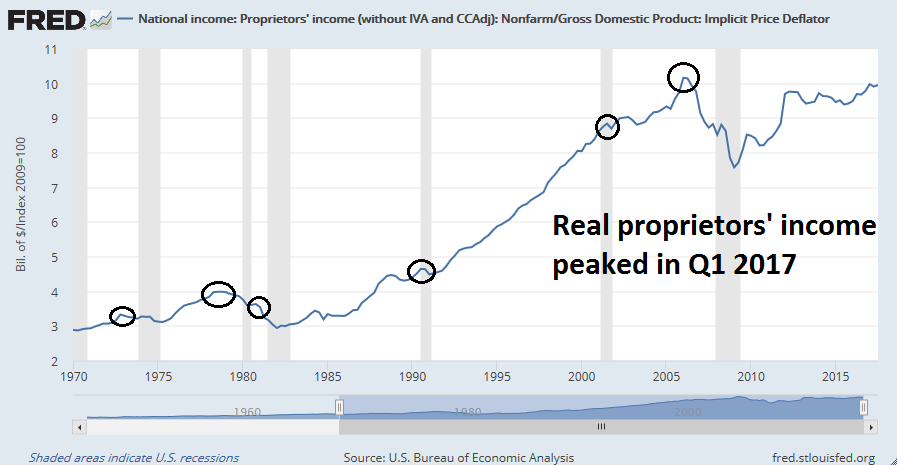
Corporate profits tend to be released with a lag, and proprietors’ income is a more timely data series. Real proprietors’ income has not made a new high for the cycle yet. Call the corporate profits/proprietors’ income indicators a mixed positive. Throw in the prospect of corporate tax cuts, they get even better.
Financial and monetary conditions: Watch out for the Fed
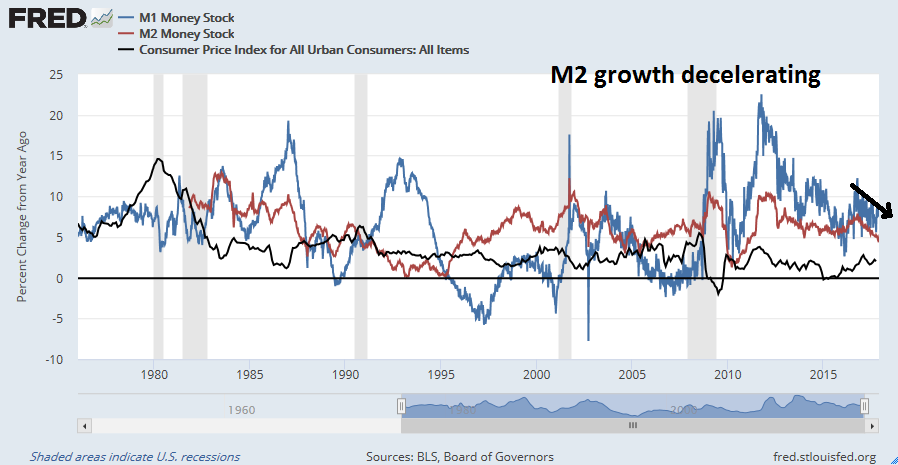
The third leg of my leading indicators is financial and monetary conditions. It is no secret that the Federal Reserve is embarking on a monetary policy normalization cycle of unknown length and magnitude. As the Fed tightens, money supply growth has tended to slow. In the past, either real M1 or M2 growth has fallen negative ahead of recessions. The latest readings show that real M2 growth stands at 2.3% and it is decelerating quickly. At this rate, it could easily go negative in Q1.
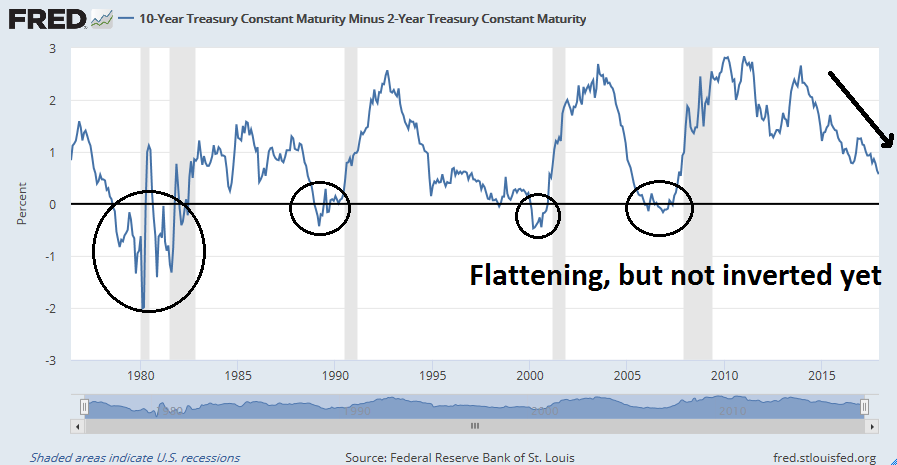
As well, the market has shown great concerns about the shape of the yield curve, which is flattening but nowhere near an inversion yet. However, should the Fed continue on its course to raise rates at its December meeting and proceed with three quarter-point hikes in 2018, the yield curve could easily be inverted by Q2 or Q3.
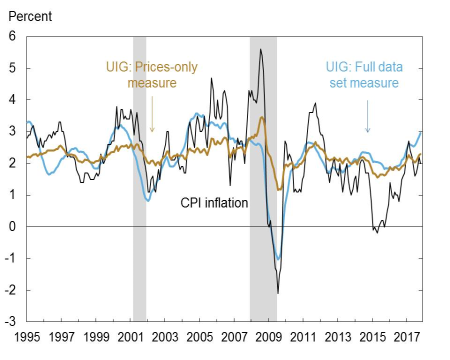
Despite the signs of tame inflation, there are plenty of indicators that show nascent inflationary pressures. The New York Fed’s Underlying Inflation Gauge estimates underlying trend CPI to be 2.25% to 3.00%, which is well above the Fed’s 2% target.
Moreover, measures of global inflation show that inflation surprise is turning up around the world.

Bottom line: Don’t expect the Fed to slow down in its course of rate hikes.
Investment implications
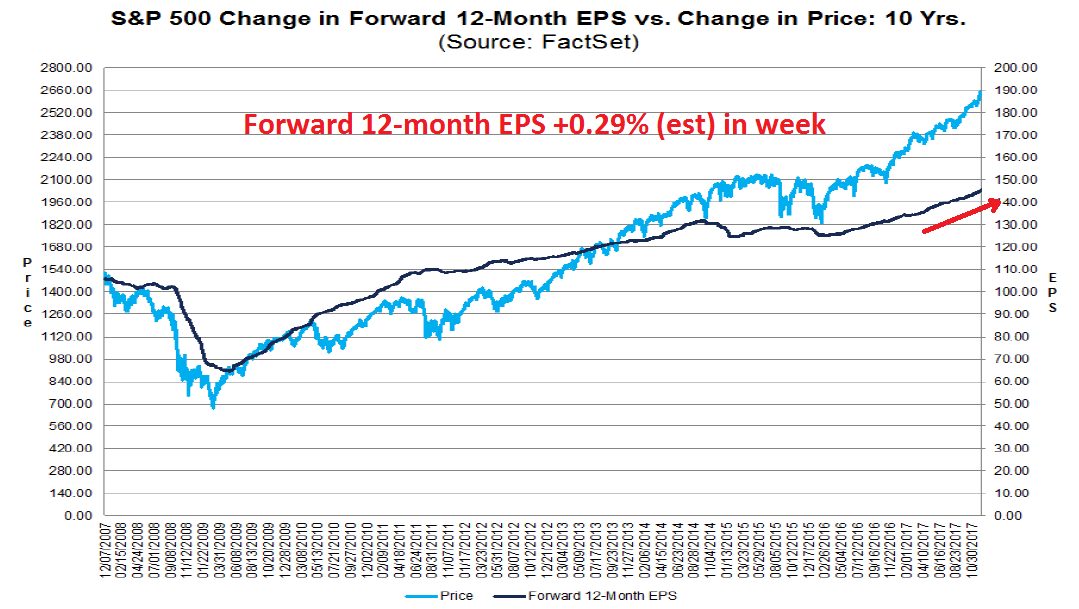
Putting it all together, the near term implications for US equities is bullish. The latest update from FactSet shows that earnings estimates continue to rise, indicating positive fundamental momentum.
From a technical perspective, risk appetite indicators are behaving well. There are few signs of stress from the credit markets after the hiccup in November.

NASDAQ and momentum stocks have also begun to recover after suffering a recent scare. The technical uptrend for both the NASDAQ 100 and the relative uptrend for price momentum remain intact.

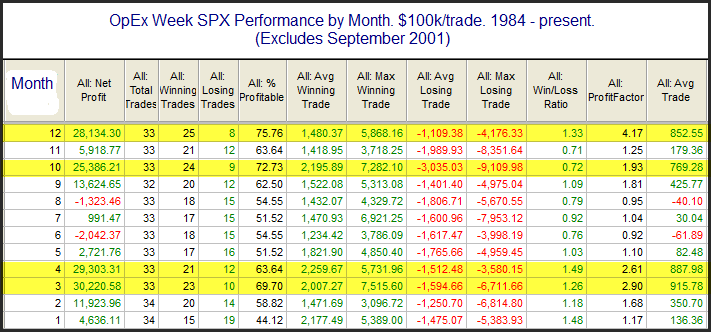
Next week is option expiry week. Rob Hanna at Quantifiable Edges found that December OpEx has been one of the better OpEx weeks in the year.
In conclusion, the near term outlook looks unabashedly bullish. Barring an unexpected event, such as a trade war, or a shooting war on the Korean peninsula, positive momentum should carry equity prices to further highs – until the Fed steps in and hits the monetary brakes.
My inner investor remains constructive on equities. My inner trader covered his shorts on Thursday and went long the NASDAQ 100 on Friday.
Disclosure: Long TQQQ
Thumbs up. Another great post.
J.P. Morgan was quoted as saying that he got rich by leaving the top 30% of a bull market to other people.
Hi Cam,
I like this post. I’m interested in your outlook in the event of a shooting war (N. Korea,/Iran vs. US or proxies), the odds of which are at their highest in many years and worryingly high in an absolute sense: https://www.theatlantic.com/international/archive/2017/12/global-conflicts-to-watch-in-2018/547913/
Thanks,
David
No one really knows what’s going on in Korea. The winter (Nov-Feb) period tends to be the quiet period because of weather conditions.
If you want to watch for a sign of an imminent attack, watch for news of the evacuation of American dependents. Even a non-nuclear retaliation could see 100-200K civilian losses in SK – which is a Hiroshima magnitude like loss. If they don’t evacuate US dependents ahead of a pre-emptive attack knowing those kinds of civilian casualties are possible, the inquiry afterwards will make Benghazi look like an afternoon at Ascot by comparison.