Preface: Explaining our market timing models
We maintain several market timing models, each with differing time horizons. The “Ultimate Market Timing Model” is a long-term market timing model based on the research outlined in our post, Building the ultimate market timing model. This model tends to generate only a handful of signals each decade.
The Trend Model is an asset allocation model which applies trend following principles based on the inputs of global stock and commodity price. This model has a shorter time horizon and tends to turn over about 4-6 times a year. In essence, it seeks to answer the question, “Is the trend in the global economy expansion (bullish) or contraction (bearish)?”
My inner trader uses the trading component of the Trend Model to look for changes in the direction of the main Trend Model signal. A bullish Trend Model signal that gets less bullish is a trading “sell” signal. Conversely, a bearish Trend Model signal that gets less bearish is a trading “buy” signal. The history of actual out-of-sample (not backtested) signals of the trading model are shown by the arrows in the chart below. Past trading of the trading model has shown turnover rates of about 200% per month.

The latest signals of each model are as follows:
- Ultimate market timing model: Buy equities
- Trend Model signal: Risk-on
- Trading model: Bearish
Update schedule: I generally update model readings on my site on weekends and tweet mid-week observations at @humblestudent. Subscribers will also receive email notices of any changes in my trading portfolio.
Four steps, where’s the stumble?
Wall Street traders know about the “Three steps and a stumble” adage, which states that the stock market tends to suffer substantial setbacks once the Fed takes three tightening steps in a row. Now that the Fed has raised rates four consecutive times, where`s the stumble?
Despite my recent post which suggested that the odds of a hawkish rate hike was high (see A dovish or hawkish rate hike), my social media feed was full of misgivings that the Fed is in the process of making a serious policy error like the 1937 rate hike cycle, where the central bank tightened the economy into a recession.

Another policy error that occurred in recent memory is the Jean-Claude Trichet led European Central Bank’s policy of tightening into the Great Financial Crisis.

Similar kinds of concerns are rising today. There are preliminary signs of a weakening economy, and the Fed’s willingness to stay the course on its rate normalization policy in the face of soft inflation statistics is raising anxiety levels.
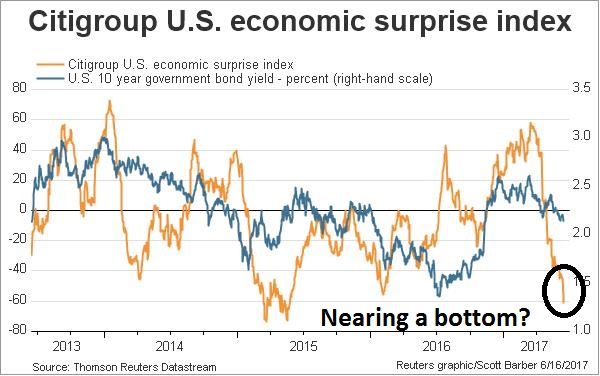
While I believe that recession risks in 2018 are rising, my base case scenario still calls for one last blow-off top in stock prices before the equity party comes to a close. Current concerns about the Fed tightening into a weakening economy can be summarized by this chart of the Citigroup US Economic Surprise Index (ESI), which measures whether macro releases are beating or missing expectations. As the chart shows, ESI has been weak, and the 10-year yield has declined in sympathy. But ESI is already at very low levels. How much worse can the macro picture get before it rebounds?
A weakening economy?
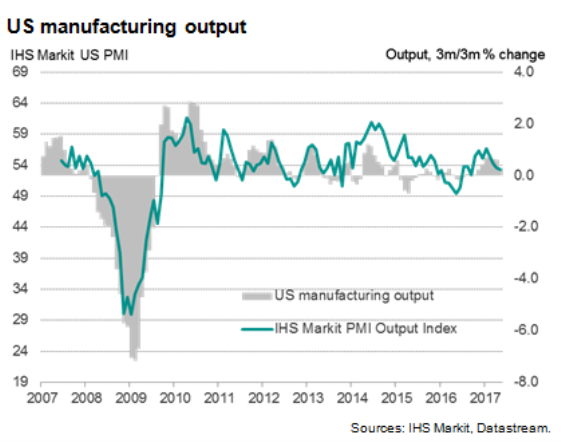
Evidence of a slowing economy is piling up. Markit wrote that “Weak PMI confirmed by official data”, as illustrated by this comparison of Markit PMI and manufacturing output.
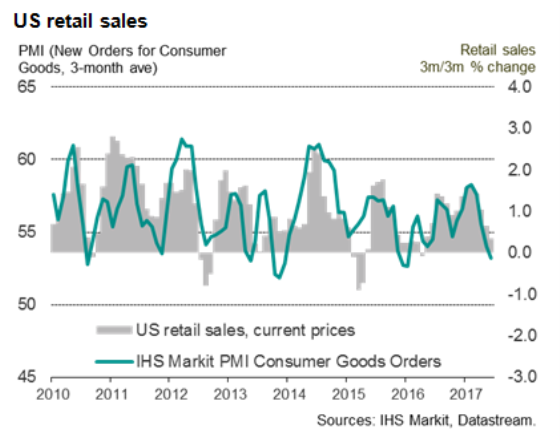
Similarly, weakness in the consumer goods component of PMI also led softer retail sales.
Friday’s release of housing starts (blue line) and housing permits (red line) was another month of weakness in housing, which is a highly cyclical sector that is part of my suite of long leading indicators. Nascent weakness in this sector is confirmed by the deceleration in construction job growth, which remains positive on a year-over-year basis. If housing activity does roll over, then the likelihood of a recession next year rises significantly.

Over at Calculated Risk, Bill McBride raised concerns about the rising risk levels in commercial real estate:
There are several warning signs for commercial real estate. As an example, even as the economy approaches full employment – and the demand for office space will likely slow – new construction is still strong and vacancy rates are already high.

Edward Harrison at Credit Writedowns Pro sounded a similar warning:
Commercial real estate is near its pre-recession peak in terms of value as a percentage of GDP. And that level will soon be broken given the huge slug of projects now in the works.
This is an interest-sensitive business because a lot of it is done using leverage in order to multiply profits. And this makes commercial real estate vulnerable to the Fed’s present rate hike cycle.
Bottom Line: Commercial real estate is a sector that continues to do well and power the US economy forward. But there are signs of overbuilding in the absolute number of units coming online right now, particularly in residential property. This makes the commercial property market vulnerable, and we should pay attention to signs of weakness in the sector.
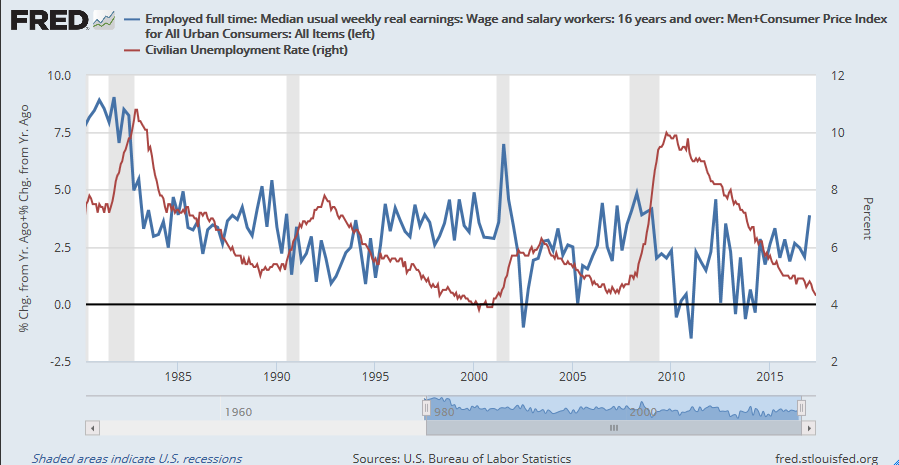
I had pointed out before that corporate profits (red line), which is another key long leading indicator, may have peaked this cycle. As well, a 4.3% unemployment rate is likely to lead to greater wage pressures (blue line), which will further depress corporate margins.
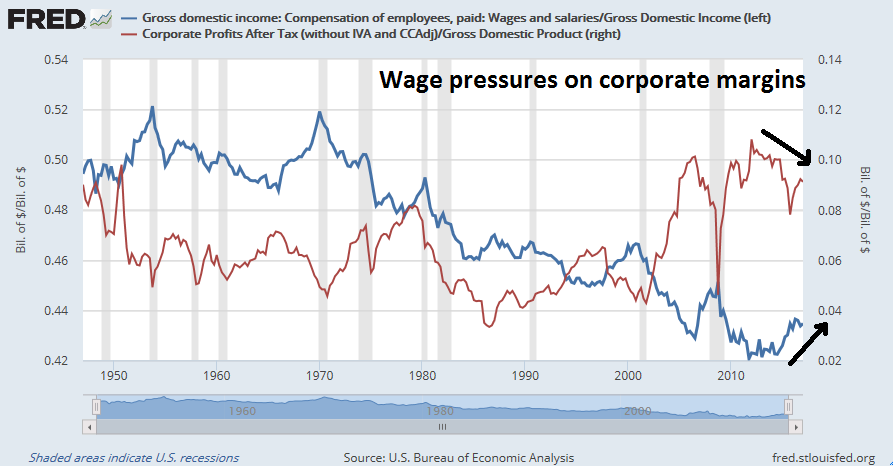
Indeed median nominal wage growth is beginning to accelerate as unemployment probes historically low levels, notwithstanding the hand wringing over tame inflation statistics.
Risks are also rising on both the monetary and fiscal policy fronts. In past posts, I pointed out the risks of a significantly more hawkish Fed as Trump appointees join the Board of Governors (see More surprises from the Fed? and A Fed preview: What happens in 2018?). At the same time, Trump Administration officials are still going up a steep learning curve. Business Insider reported that Treasury Secretary Steve Mnuchin seemed to be preparing the country for a government shutdown as legislation to raise the debt ceiling could be in jeopardy:
During a hearing before the Senate Budget Committee, Mnuchin was asked by Democratic Sen. Tim Kaine about a May 2 tweet from President Donald Trump that suggested the federal government needs a “good shutdown.”
“It’s an unfortunate outcome. At times there could be a good shutdown, at times there may not be a good shutdown.” Mnuchin said. “There could be reasons at various times why that is the right outcome.”
Office of Management and Budget director Mick Mulvaney echoed Mnuchin’s warning back in May.
“What we just did this week was fine and passable but not ideal,” Mulvaney told CBS’ Fact the Nation on May 7. “The appropriations, the spending process, Congress using the power of the purse has been broken here in Washington for more than 10 years. And I think a good shutdown would be one that could help fix that. It’s part of that overall drain-the-swamp mentality about Washington, DC.”
Mishaps such as a government shutdown is something that this market doesn’t need. (As another example of Trump officials’ steep learning curve, the Washington Examiner reported that OMB director Mick Mulvaney looked through the ADP jobs report for government job data as he didn’t realize that ADP only covered private sector employment).
Storm clouds are beginning to gather on the horizon. The risks to this expansion are rising, but there is no need to panic just yet.
Slowdown fears premature
Market fears about the Fed tightening into a slowing economy are premature. The near-term outlook for the economy and market remains bright. The Atlanta Fed’s GDPNow nowcast of Q2 GDP currently stands at 2.9%, which is roughly in line with Street expectations.
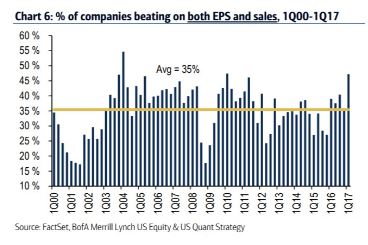
At the same time, Q1 earnings season came in ahead of expectations. As this chart from BAML shows, the percentage of companies that showed both sales and earnings beats were at the top end of historical experience.
The latest update from FactSet shows that forward 12-month EPS continues to rise, indicating Wall Street optimism about the growth outlook.

As well, the latest update from Barron’s shows that the insider activity has retreated from several weeks of buy signals to a hold signal. Readings for this indicator tends to be noisy from week to week, but the current pattern is constructive for stock prices.
In short, the nowcast and near-term outlook for equities are still rosy. While storm clouds may be forming on the horizon, those concerns are unlikely to materialize until later this year. New Deal democrat`s weekly assessment of the economic outlook concluded this way:
While the present remains positive, as does the near term forecast, there were two significant negative events for the longer term forecast this week. The first was the Fed raising rates, which caused the yield curve to flatten some more. It is just barely positive now (as opposed to neutral). The second was the poor housing starts and permits report, which was just bad enough to turn housing, on net, negative. As a result the longer term forecast is now just slightly above neutral.
The outlook for 2018 is decelerating from positive to neutral. Add in the possibility of a more hawkish Fed, then the likelihood of a recession in 2018 rises significantly.
Timing the market top
Conor Sen, who wrote in Bloomberg View, recently postulated the following sequence for the current late cycle expansion: full employment, followed by an oil spike, and then a Fed-induced recession. I would concur with that assessment, but amend the oil spike to a spike in commodity prices as crude oil has been dragged down by idiosyncratic supply factors. As well, the scenario outlined by Sen also conforms to the market cycle framework of technical analysis (see In the 3rd inning of a market cycle advance), where market leadership begins a bull move with interest sensitive stocks early in a cycle, then rotates through to consumer spending sensitive stocks, capital goods sectors as capacity utilization gets pressured, and ends with the inflation-hedge commodity producing sector.
Already we are starting to see life in the capital goods industrial stocks, indicating a possible revival in the global reflation trade. As the chart below shows, industrial stocks have staged a breakout out of a trading range relative to the market. The bottom panel shows that the global nature of the move. European industrial stocks have already been in a relative uptrend compared to Dow Jones Europe for all of this year. If the relative breakout in US industrial stocks holds, then expect the reflation theme to revive, a recovery in the Economic Surprise Index, and the yield curve to start steepening again.

By contrast, late stage cyclical stocks, such as gold, energy, and mining need more time to base relative to the market. Golds and mining stocks are starting to bottom and consolidate on a relative basis, though energy stocks (middle panel) remain in a relative downtrend.

If my hypothesis is correct, the stock market will see a second wind after a shallow June swoon. A surge in inflation hedge groups would be the signal that the market is in the late stages of a blow-off top.
The week ahead: Seasonal headwinds for stocks
Looking ahead to the next couple of weeks, the stock market is performing in line with historical experience. Urban Carmel observed that stock prices and bond yields tend to be weak after the Fed has raised rates (N=3). That has turned out to be true so far.
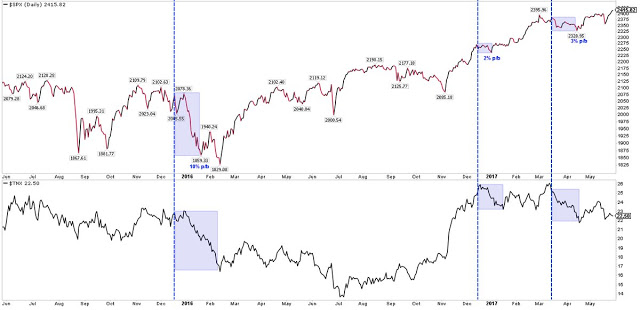
LPL Research also pointed out that the second half of June has tended to be seasonally weak, which is consistent with my short-term trading bias.

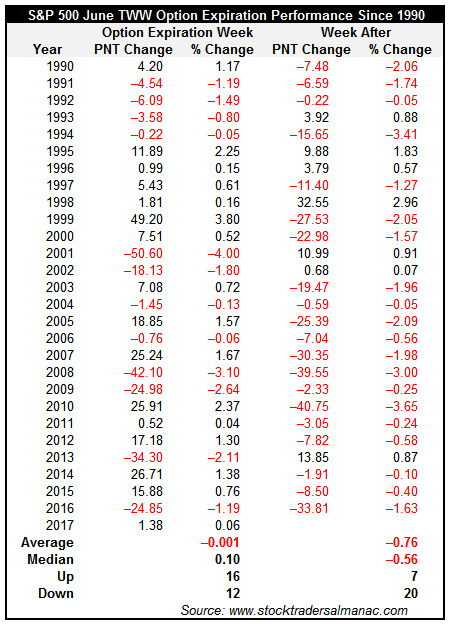
Last week was option expiry week (OpEx). According to Jeff Hirsch of Almanac Trader, the week after June OpEx has shown a bearish tilt, with the SPX down 20 out of 27 times (74%) since 1990.
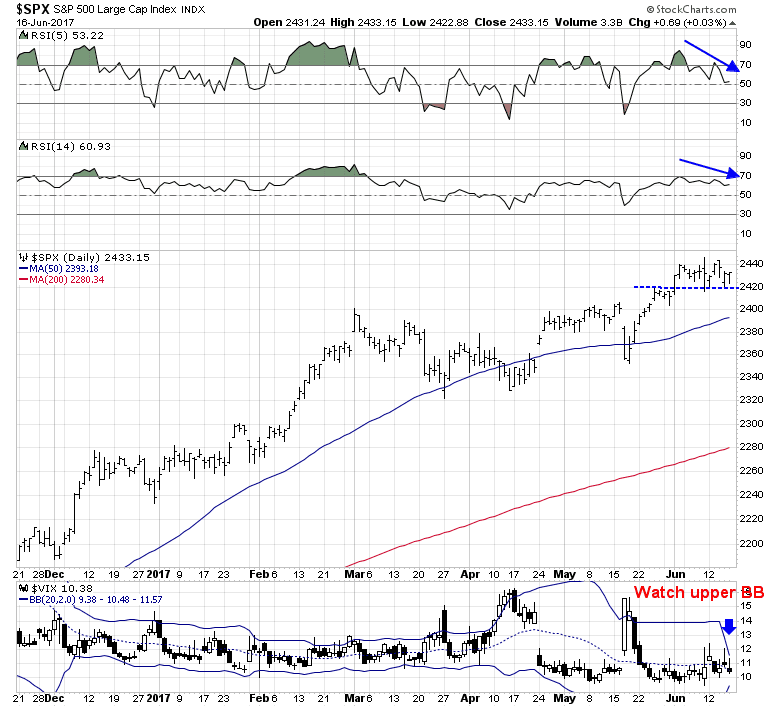
The short-term technical condition of the market can best be described as exhibiting negative momentum, but not at an extreme. The SPX is on RSI-5 and RSI-14 sell signals, with initial support at 2420, and secondary support at the 50 dma at about 2390. Should the market weaken in a panic sell-off, watch for an oversold condition should the VIX Index (bottom panel) spike above its upper Bollinger Band.
Even the badly beaten up NASDAQ 100 stocks are only mildly oversold, but not enough to sound the all-clear signal.
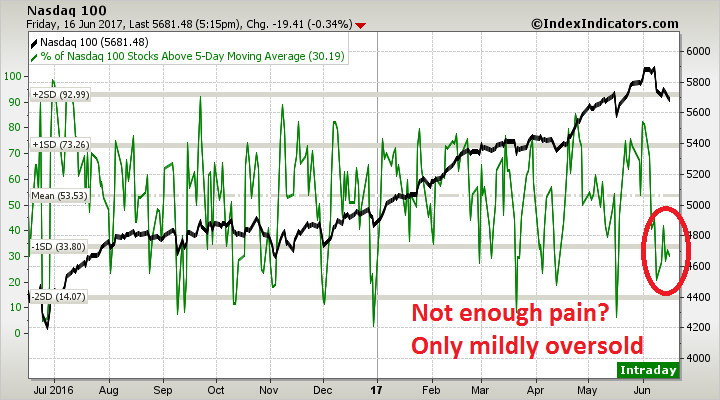
We may need more panic for Tech stocks for a durable bottom. The short-term ARMS Index for NASDAQ stocks (TRINQ) never traded above 2, which would indicate a “margin clerk” liquidation market. In all likelihood, there may be more pain to come for Tech in the short-term.

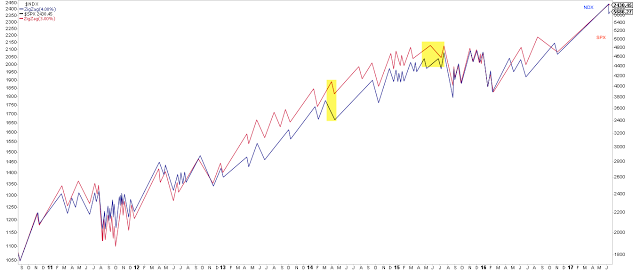
Urban Carmel analyzed past instances of NDX retreats and found that whenever the NDX fell 4% or more (it fell 4.5% last week), the SPX has followed.
During the past 7 years, whenever NDX has fallen 4% from a recent high (blue zig zag line), SPX has also fallen at least 3% (red line). There were two lags between NDX and SPX dropping (yellow shading), but no exceptions, even during the remarkable 2013-14 period. This implies a move of 236.5 for SPY [and about 2360-2370 for SPX].
My inner investor remains constructive on equities. My inner trader is still short the market and waiting for oversold conditions to cover his shorts.
Disclosure: Long TZA
Bearish strategists point to high valuation but that has never been a cause of a bear market. Buffett said again recently that if interest rates stay this low for the next 5, 10 or 15 years, this market is dirt cheap.
Leading economic indicators in America and globally are pointing up. That reinforces the bull.
Sentiment indicators seem high but at the slightest downswing, a huge bout of pessimism pops up in the investment community. My guess is everyone has one foot out the door and that makes me think sentiment is not near a bull market ending level.
If margin loans begin to fall, I’ll become cautious. If leading economic indicators turn down I’ll become cautious. If a buying panic sends markets and sentiment soaring 15-20%, I’ll become bearish and exit to a minimal allocation to equities. If the American political scene gets more heated, I’ll continue to ignore it.
My portfolio clients invest on an intermediate basis so I ignore (but worry about) short term swings. So anything I’ve written today says nothing about the short term.