Preface: Explaining our market timing models
We maintain several market timing models, each with differing time horizons. The “Ultimate Market Timing Model” is a long-term market timing model based on the research outlined in our post, Building the ultimate market timing model. This model tends to generate only a handful of signals each decade.
The Trend Model is an asset allocation model which applies trend following principles based on the inputs of global stock and commodity price. This model has a shorter time horizon and tends to turn over about 4-6 times a year. In essence, it seeks to answer the question, “Is the trend in the global economy expansion (bullish) or contraction (bearish)?”
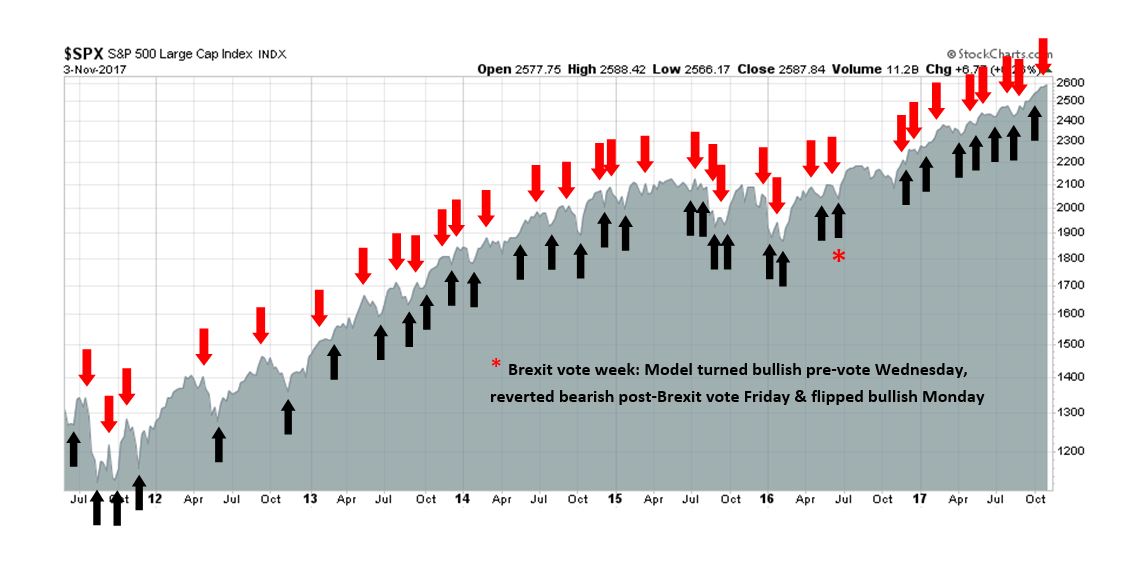
My inner trader uses the trading component of the Trend Model to look for changes in the direction of the main Trend Model signal. A bullish Trend Model signal that gets less bullish is a trading “sell” signal. Conversely, a bearish Trend Model signal that gets less bearish is a trading “buy” signal. The history of actual out-of-sample (not backtested) signals of the trading model are shown by the arrows in the chart below. Past trading of the trading model has shown turnover rates of about 200% per month.
The latest signals of each model are as follows:
- Ultimate market timing model: Buy equities
- Trend Model signal: Bullish
- Trading model: Bearish
Update schedule: I generally update model readings on my site on weekends and tweet mid-week observations at @humblestudent. Subscribers will also receive email notices of any changes in my trading portfolio.
Tops are processes
It is said that while market bottoms are events, which are sparked by emotional panic selling, tops are processes, which are the result of a series of connected episodes that depress prices. In the past few months, I have adopted the belief that the market is undergoing a topping process. Consequently, I become increasingly cautious about the stock market, though I do not believe that the ultimate top has been seen yet.
Here is what we know about the market on an intermediate term time frame:
- Positive momentum: The market has been supported by strong price, fundamental, and macro-economic momentum. Most macro models show that the risk of recession is low or nonexistent.
- Valuation: Valuation is stretched.
- Sentiment: Sentiment has been frothy, which is contrarian bearish.
- Technical: The pre-conditions for an intermediate or long-term top are not yet in place.
- Short-term outlook: Much depends on the fate of the GOP tax bill and the market’s evaluation of other sources of risk, such as the Middle East.
Under these conditions, an investor could be either bullish or bearish and be correctly positioned. It just depends on the investment time horizon.
Powerful momentum
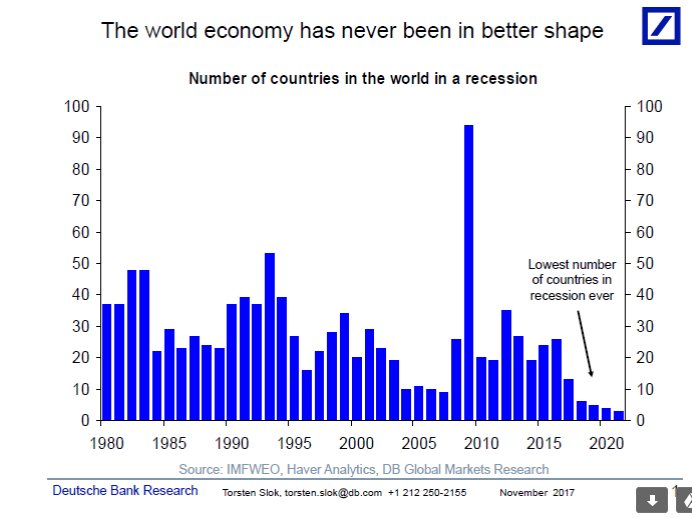
Global equity markets are enjoying a macro-economic sweet spot. The world is seeing signs of synchronized global growth. Torsten Slok at Deutsche Bank pointed out that the number of countries in recession, or forecasted recession, is at a historical low.
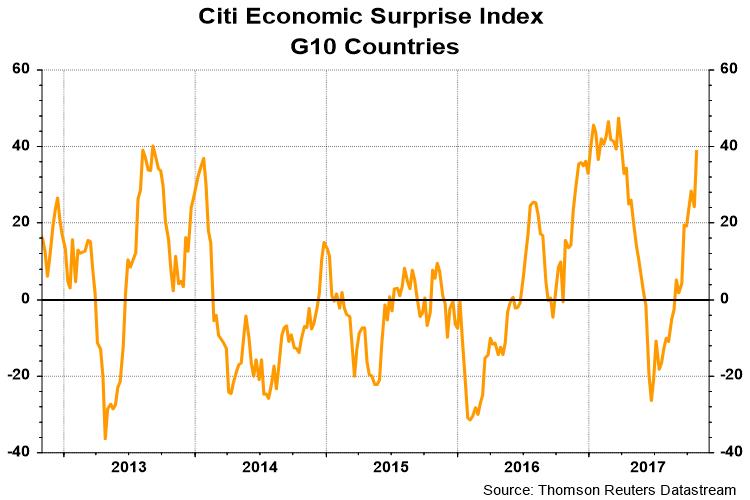
The G10 Economic Surprise Index, which measures whether macro indicators are beating or missing expectations, is surging.
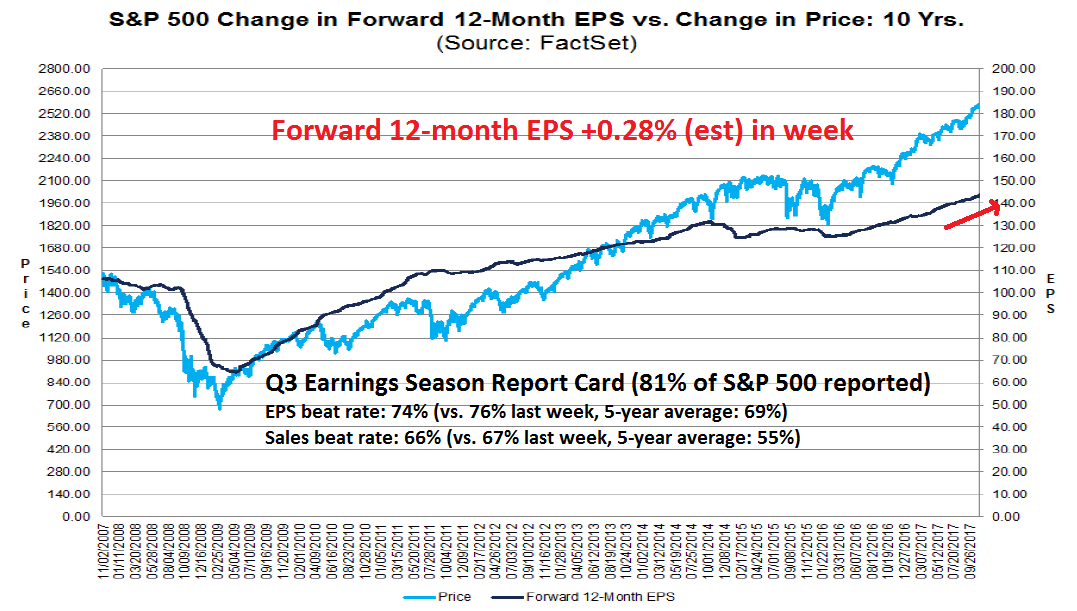
In the US, the latest update from Factset shows that the results from Q3 Earnings Season remain upbeat. Both the EPS and sales beat rates are well above historical averages, and forward 12-month EPS continues to rise. The Q4 negative guidance rate came in at 66%, which is below the 5-year average of 75%.
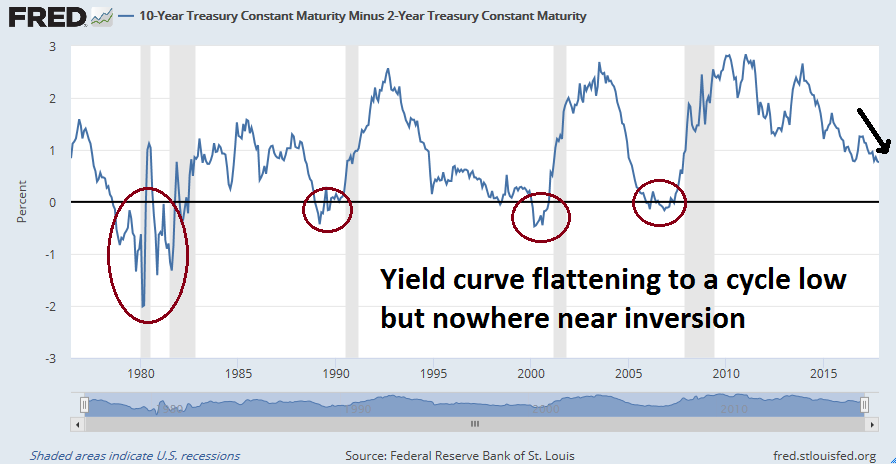
Despite the upbeat growth outlook, the bond market is flashing a warning. The 2s10s yield curve is flattening and readings are at a cycle low of 0.72%, though it is nowhere near an inversion. While the yield curve has been an uncanny recession warning signal in the past, it may not invert this time because of the effects that the Fed’s QE programs had on the bond market.
Stretched valuation
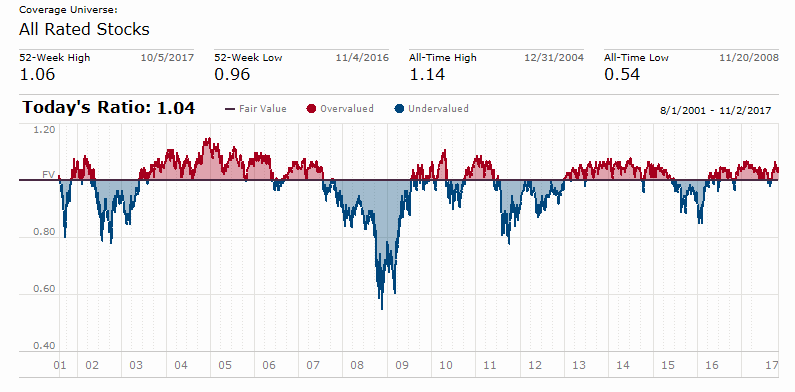
On the other hand, equity valuations are stretched using a variety of metrics. Morningstar estimates that the market is about 4% overvalued, which is roughly the degree of overvaluation seen at the 2007 top.
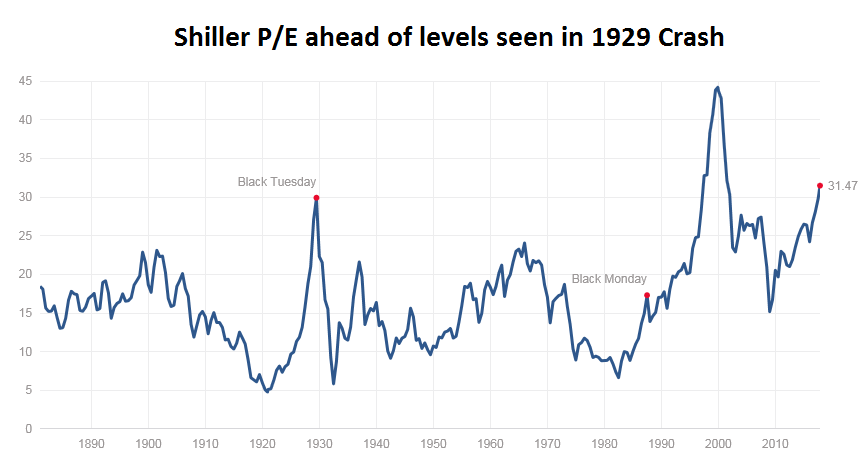
The Shiller P/E now stands at 31x, which is above of the 28x multiple seen at the last market peak in May 2007, and it is even ahead the levels reached before the Crash of 1929.
Ed Yardeni’s Rule of 20, which states that the market is overvalued when the sum of forward P/E (18.0, via FactSet) and headline CPI (2.1) is 20 or more, indicates that stock prices are stretched.

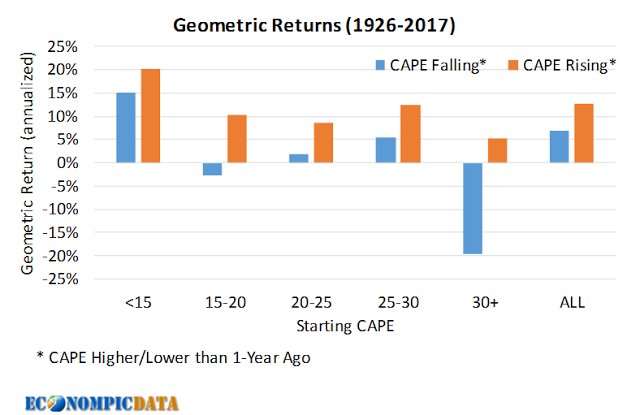
That said, valuation is not very effective as a short-term market timing indicator. The Morningstar analysis showed that the market went through stretches of overvaluation without entering into a bear market. As well, analysis from EconoPic found that high levels of CAPE was not an impediment to stock prices, as long as it was accompanied by positive price momentum.
Frothy sentiment
There is also little doubt that sentiment is getting overly frothy. I have been detailing how investor sentiment has gotten out of hand with my series, “Things you don’t see at market bottoms”:
- Things you don’t see at market bottoms, 23-Jun-2017
- Things you don’t see at market bottoms, 29-Jun-2017
- Things you don’t see at market bottoms, bullish bandwagon edition
- Things you don’t see at market bottoms, Retailphoria edition
- Things you don’t see at market bottoms, Wild claims edition
- Things you don’t see at market bottoms, No fear edition
- Things you don’t see at market bottoms, Paris Hilton edition
- Things you don’t see at market bottoms, CFD edition
- Things you don’t see at market bottoms, Halloween edition
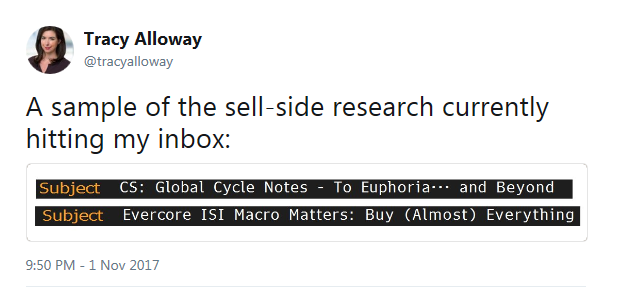
Here is the latest example from Tracy Alloway.
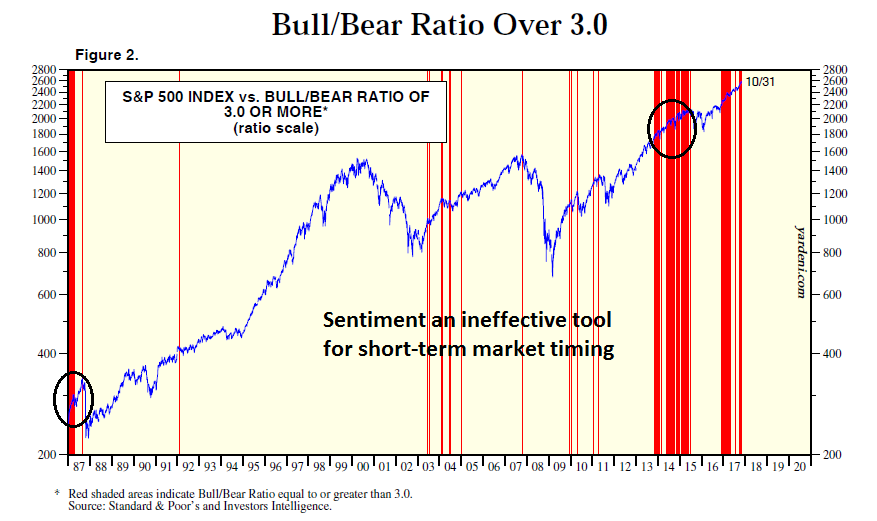
While excessively bullish sentiment can provide a warning sign for investors, it is also not a very good short-term market timing indicator. As an example, there was some buzz last week about the bullish excesses seen in the level of Investors Intelligence bulls and bears. This chart from Yardeni Research shows current bull/bear ratio at such an extreme that it was only exceeded by readings before the Crash of 1987.
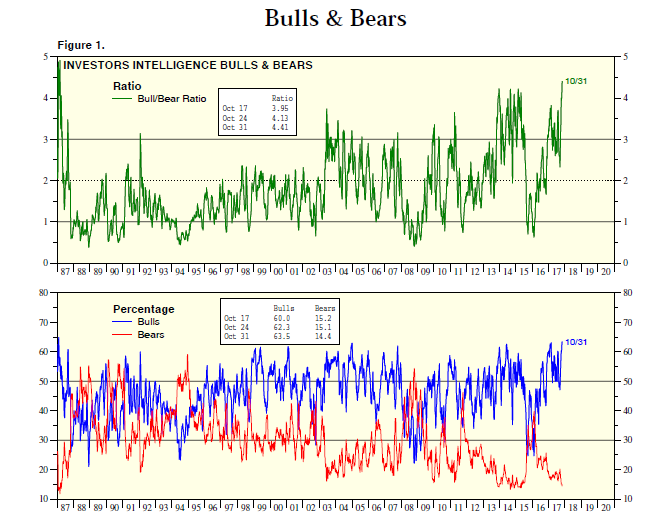
Further examination of this indicator reveals that stock prices can rise further even after the bull/bear ratio has reached crowded long levels.
By contrast, excessive fear has shown itself to be a much better signal of limited downside in stock prices, though the model failed in the bear market of 2008-09.

This is another example of the adage, “bottoms are events, while tops are processes”.
Nearing technical target, but no signs of a top
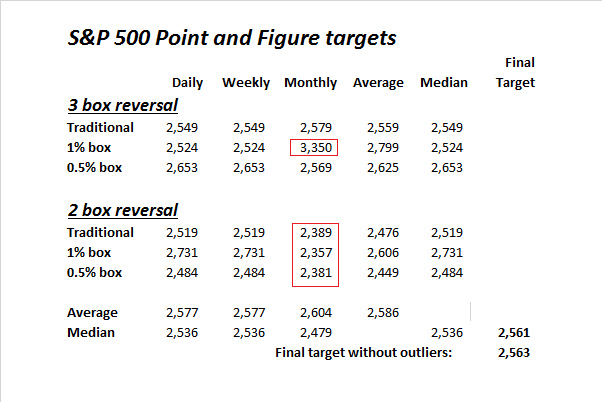
In a recent post (see Nearing upside target, now what?), I had outlined a range of S&P 500 upside target using daily, weekly, and monthly prices and a variety of assumptions (outliers shown in red). The consensus final target came to 2560-2580, which the market has exceeded.
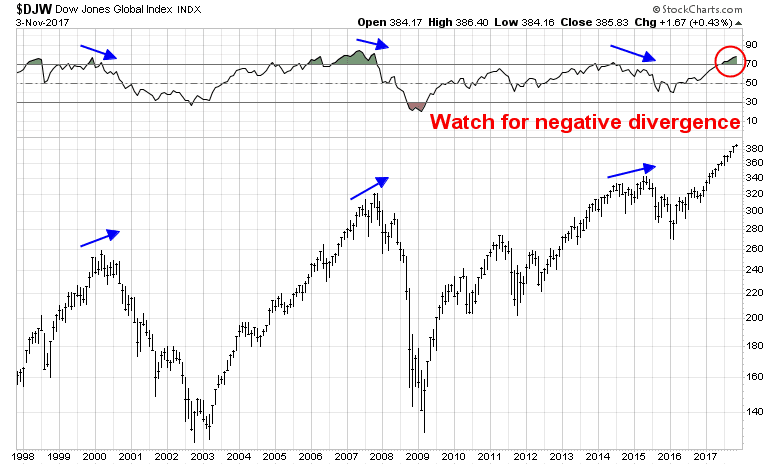
On the other hand, the pre-conditions for a cyclical market top are not in place. The global reflationary rebound has lifted stock prices all around the world. As the chart below of the DJ Global Index shows, past peaks (N=3) have been marked by an initial top, a retreat, and a second rally that was characterized by a negative RSI divergence. We have not even seen the first pullback yet.
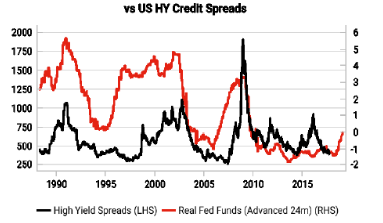
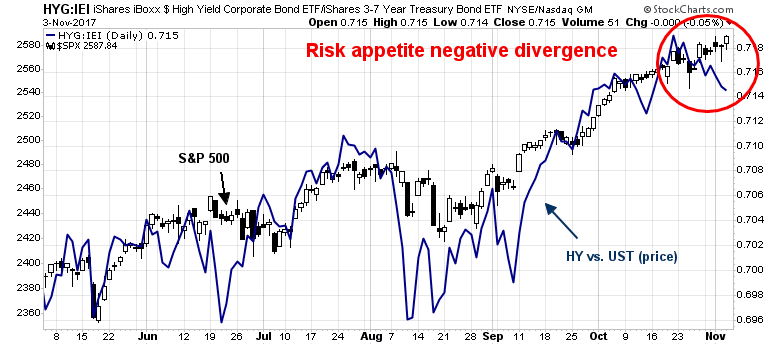
One clue for the timing of an ultimate market top came from Variant Perception, which found that the real Fed Funds rate leads the high yield (HY) credit spreads by 18-24 months. If this relationship continues into the future, then HY spreads, which is a proxy for risk appetite, would begin to widen in early to mid 2018.
Market vulnerable, but buy the dip
To summarize, the question of whether to be bullish or bearish depends on your investment time horizon. I believe that the market is in the process of making a long-term cyclical top. Valuations are stretched, and sentiment is frothy. New Deal democrat’s latest update of high frequency economic indicators reveals that coincident and short leading indicators are positive, while long leading indicators are neutral.
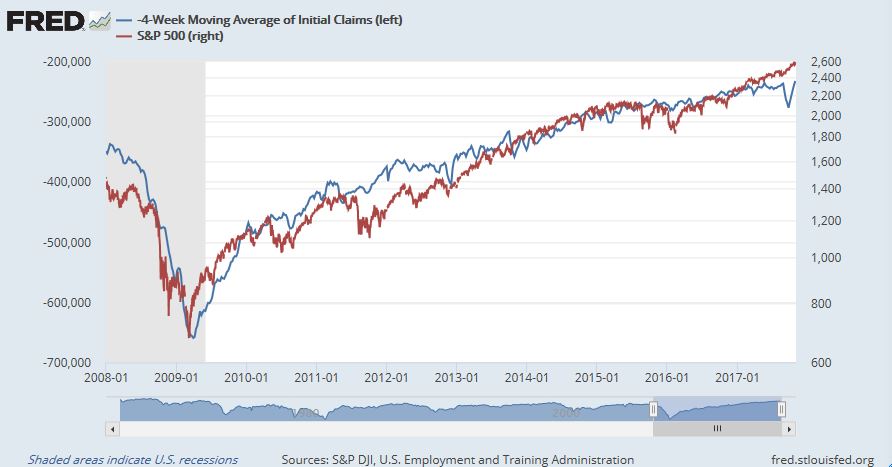
However, the nowcast of the economy is as close to perfection as any investor could ask. As an example, there is a close inverse correlation between initial jobless claims (blue line, inverted scale) and stock prices (red line). These readings suggest that the market is likely to grind higher over the next few months.
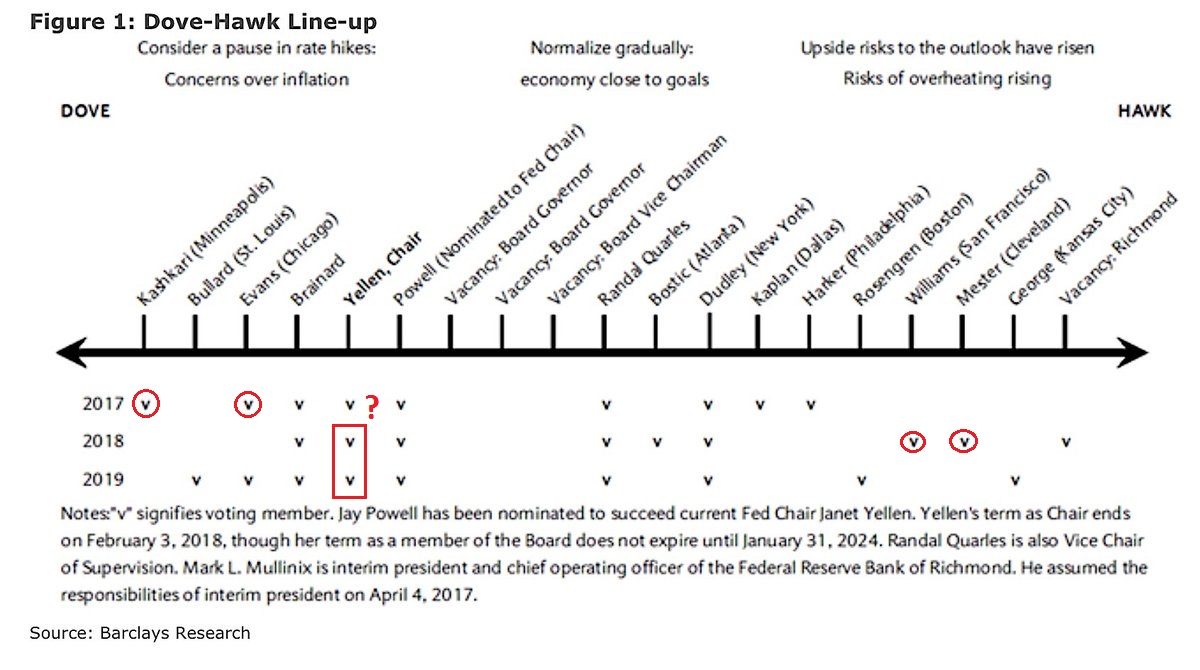
The longer term outlook is not as rosy. Long leading indicators are in neutral territory and readings are deteriorating. The risk of a Fed policy error that tightens the economy into a recession is high. In particular, the combination of a new Fed chair, a shift of votes from dovish to hawkish voting regional presidents in 2018, and likely newly appointed hawkish Fed governors will set monetary policy on a more aggressive course than current market expectations (see Is the Fed tightening into a stalling economy?).
In the short run, the market is tactically overbought and vulnerable to a pullback. I detailed the short-term negative divergences in my last post (see A market volatility update), and I will not repeat all of them here.
Tax bill uncertainty
Much of the near term equity outlook depends on the success of the Republican tax proposals. I am monitoring the reaction of major lobby groups and the degree to which they can mobilize effective and widespread political opposition. There has not been sufficient detail for all interest groups to fully study the implications of the proposals. Major business groups such as the Chamber of Commerce have issued non-committal statements indicating support with “a lot of works remains to be done” qualifiers. Rather than dwell on the Republicans apparent united front, here are a number of potential pitfalls for the proposal.
There were scattered complaints from groups who stand to lose from the bill. Not unexpected were the objections from the National Association of Home Builders and National Association of Realtors over the limited loss of mortgage interest deductibility. I am also watching whether the powerful AARP reacts to the elimination of medical expense deductions, which would hit nursing home residents very hard (via CNBC). The bill has also attracted opposition from the National Farmers’ Union.
A major potential sticking point is the opposition from the National Federation of Independent Business, which is composed of small-c conservative business owners, to the pass-through provisions in the bill. The House GOP proposal calls for the taxation of pass-through entities at a 25% rate, with a set of complicated rules to prevent abuse. Kansas governor Sam Brownback had eliminated all state taxes on pass-through entities, but those provisions had created an enormous hole in the state budget as Kansas residents converted themselves from employees to LLCs in order to take advantage of the loophole (see NY Times account). Congressional lawmakers learned from that experience and created “guardrails”, which consist of a number of arcane rules to reduce the abuse of the pass-through provision. The NFIB objected on the grounds that “the bill leaves too many small business behind”. Even though the details of these provisions are highly technical, the bill was drafted without any IRS input because of budget secrecy. This approach is highly likely to create problems, either in the immediate future during debate, or later during the implementation phase should the bill pass.
The elimination of the state and local tax deduction is another potential sticking point in the passage of the bill. This will hurt the residents of high state tax jurisdictions, and it is unclear whether Republicans in those districts could be relied upon to support the bill.
Bloomberg also reported that the House bill, as written, would run afoul of the Byrd Rule in the Senate and a sunset provision would therefore have to be inserted to the proposals:
In order to fast-track the tax legislation through the Senate without having to rely on support from Democrats, Republicans are using a budget process known as reconciliation. That means rather than needing 60 votes to keep the bill moving, Republicans — holding only 52 seats — can proceed with a simple majority of 51 votes to pass the legislation.
To qualify for the Senate’s reconciliation process, the bill must meet the terms of an adopted budget resolution and adhere to rules developed by and named for the late Robert Byrd, the West Virginia Democrat who served as majority leader from 1987 to 1989.
The House plan passes the first test. The fiscal 2018 budget resolution does not allow a tax bill to add more than a total of $1.5 trillion to deficits over 10 years, and the Joint Committee on Taxation’s initial assessment of the measure puts the bill’s cumulative shortfall at $1.41 trillion over a decade.
The red flag is raised after 2027. The nonpartisan joint committee’s analysis shows the plan adding $156 billion to the budget shortfall in that year, a sure sign that it will add to the deficit in 2028. That would trigger the Byrd rule, giving Democrats an opening to raise an objection to the bill on the Senate floor that would require 60 votes to overcome.
The Democrats have so far presented a united front in opposition. Assuming that the Byrd Rule problem is overcome, the Republicans can only afford to lose 22 House votes and 2 Senate votes. Bloomberg reported that Senator John McCain has called for “regular order and support for both parties” for tax reform. Bloomberg also separately reported that Republican senator James Lankford also opposes the bill because of excessive debt. The Republican margin in the Senate is now razor thin. The fate of the tax bill now hangs by thin thread and depends on the support of GOP mavericks like Bob Corker and Susan Collins.
Stay tuned for the full reaction. None of the obstacles presented are necessarily fatal to the bill. It just means that there will be a lot of bargaining and modifications ahead. However, if the market believes that the tax package is becoming a repeat of the healthcare fiasco, it would be the spark for a correction of unknown magnitude.
Correction, then a year-end rally
Putting it all together, my base case scenario calls for a shallow pullback in the next few weeks, followed by a rally into year-end. Evidence of robust growth and emerging inflationary pressures will prompt the Fed and other major central banks to adopt a tightening policy, which will result in an economic slowdown in late 2018 or early 2019. Already, we are seeing evidence that inflation trends are bottoming and starting to turn up around the world.
My inner investor is constructive on stocks, and he is neutrally positioned at the asset mix specified by his investment policy. Should equity prices sell off, he is prepared to add to his positions.
My inner trader is tactically short the market in anticipation of a pullback.
Disclosure: Long SPXU
8 thoughts on “Bull or bear? It depends on your time horizon”
Comments are closed.
Question: You often mention that you are positioned at “the asset mix specified by his (your inner investor’s) investment policy.” Could you share with us what that mix is now?
Also: At the beginning of this piece you noted that “Despite the upbeat growth outlook, the bond market is ***flashing a warning.*** … (While the yield curve has been an uncanny recession warning signal in the past, it may not invert this time because … )”. You did not follow up with much guidance as to HOW WE might make use of bonds given this unknown uncertainty. (I do know that uncertainty is uncertain).
Thank you again for your broad but data-driven analyses.
David Galin
In answer to your questions:
Q: You often mention that you are positioned at “the asset mix specified by his (your inner investor’s) investment policy.” Could you share with us what that mix is now?
A: My asset mix is specific to my own circumstances, and should not be applicable to anyone else. I was trying to convey the idea that my long-term risk appetite is at neutral right now.
Q: At the beginning of this piece you noted that “Despite the upbeat growth outlook, the bond market is ***flashing a warning.*** … (While the yield curve has been an uncanny recession warning signal in the past, it may not invert this time because … )”. You did not follow up with much guidance as to HOW WE might make use of bonds given this unknown uncertainty. (I do know that uncertainty is uncertain).
A: A flattening yield curve is usually interpreted as bond market expectations of slowing growth rates. When the yield curve flattens so much that it gets inverted (short rates above long rates), that’s a sign of trouble. Still, the rate of change matters and a flattening yield curve is a signal that growth expectations are falling.
Shiller PE 10 will decline over the next few years because recession poor earnings of 2008 and 2009 will fall out of the ten year average. I had thought that a good thing but the chart above says stock markets will fall.
Ken,
I quote from your statement above:
“Shiller PE 10 will decline over the next few years ”
as the 2008 and 2009 earnings are stripped out of the Shiller CAPE ratio, shouldn’t the CAPE rise further as we head into 2020?
The low earnings during 2008 and 2009 make the index high because the divisor is smaller. In 2018 and 2019 we will replace those with a much bigger number to combine with 2010 through 2017 for the ten years.
Ken, you are correct that is having a significant affect of inflating Shiller PE ratio right now, and it should begin to fall. However, which chart above are your referring to that shows a falling Shiller PE results in a stock market fall?
The ‘Geometruc Returns CAPE Falling’ chart.
CAPE is another name for Shiller PE10.
Cam there are so many people talking about this 2018-2019 fed tightening leading to a recession it seems it is much more likely that we have a much longer extension of a rally or a correction sooner than is thought correct?