Mid-week market update: Boy, was I wrong. Two weeks ago, I wrote Why the S&P 500 won’t get to 2400 (in this rally). Despite today’s market strength, stock prices may be restrained by a case of round number-itis as the Dow crosses the 21,000 mark and the SPX tests the 2,400 level.
In addition, the market’s reaction to President Trump’s speech to Congress was at odds to the reaction from Street strategists. While the market went full risk-on in the wake of the Trump speech, this Bloomberg summary of strategist comments made it clear that the speech was long on themes and short on details. Perhaps stocks are rallying because Trump did not go off script and sounded statesmanlike and presidential. How long the market remains patient with his lack of the specifics on tax reform, which is Wall Street’s major focus, remains an open question.
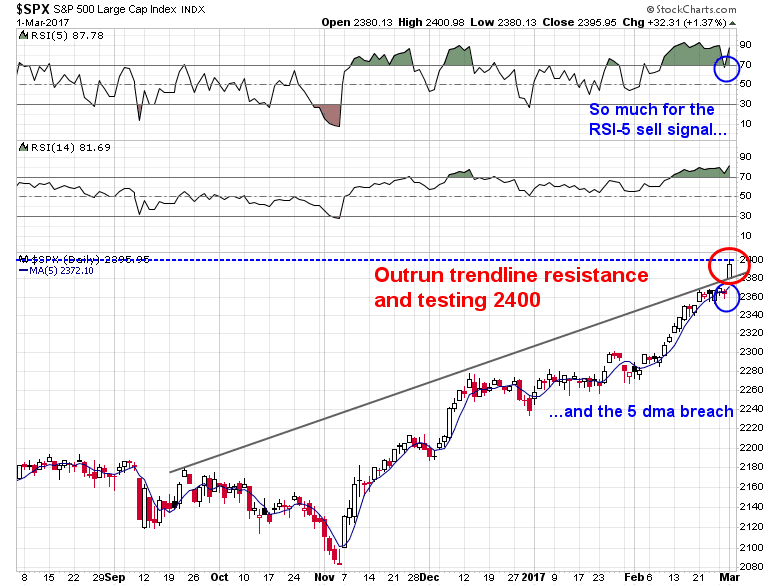
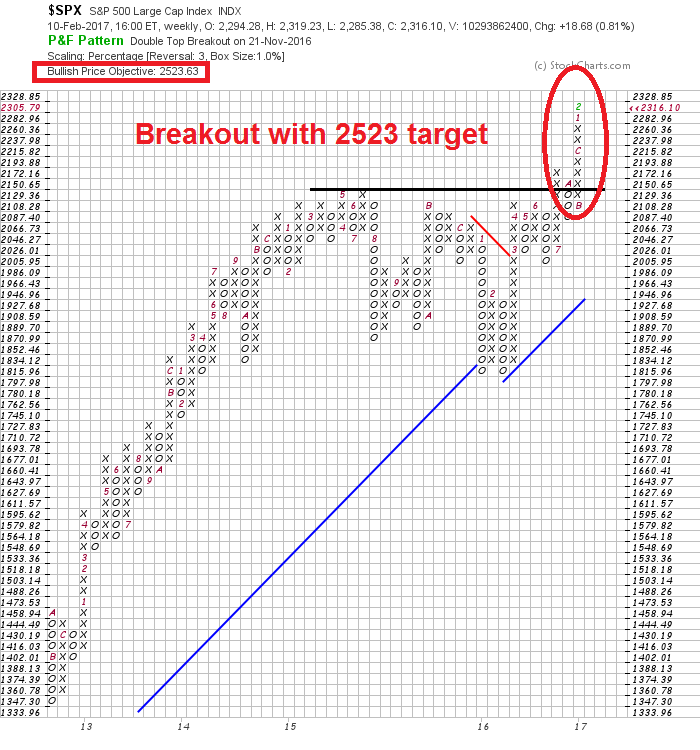
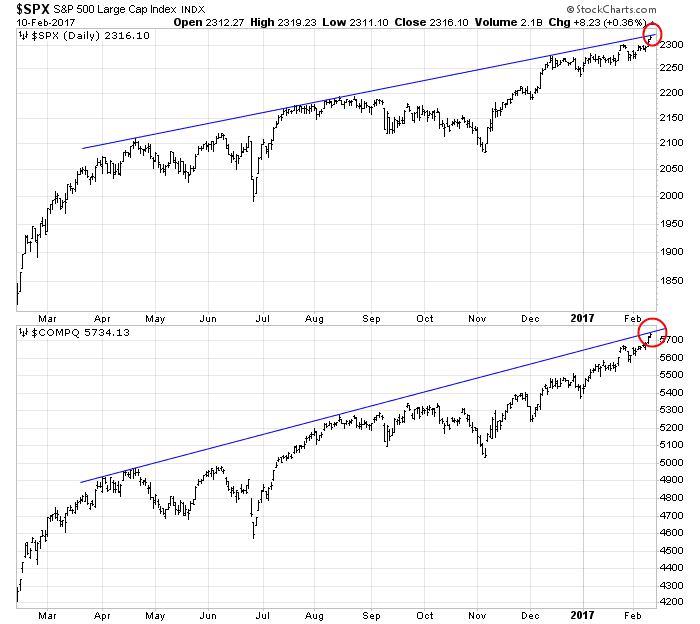
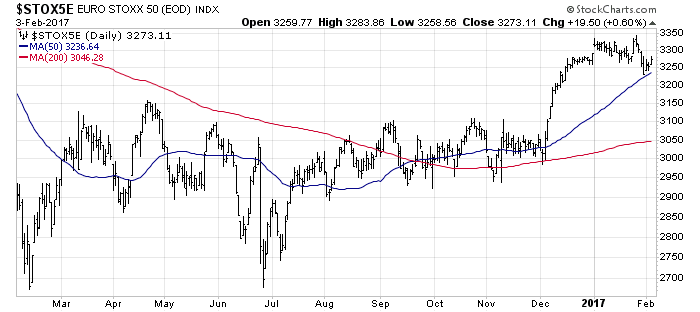
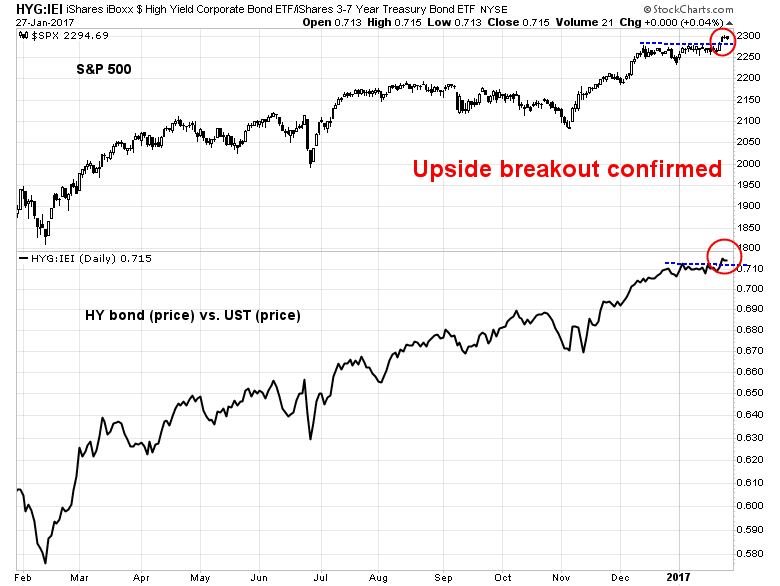
In the meantime, the SPX has broken above its trend line and appears to be staging an upside blow-off. When animal spirits start to stampede like this, you never know when the rally will end.
Does this mean it’s time to jump back on the bullish bandwagon? Not so fast. The week isn’t over and there are a couple of other major developments (other than the Trump speech) that warrant consideration.
The state of the (European) union
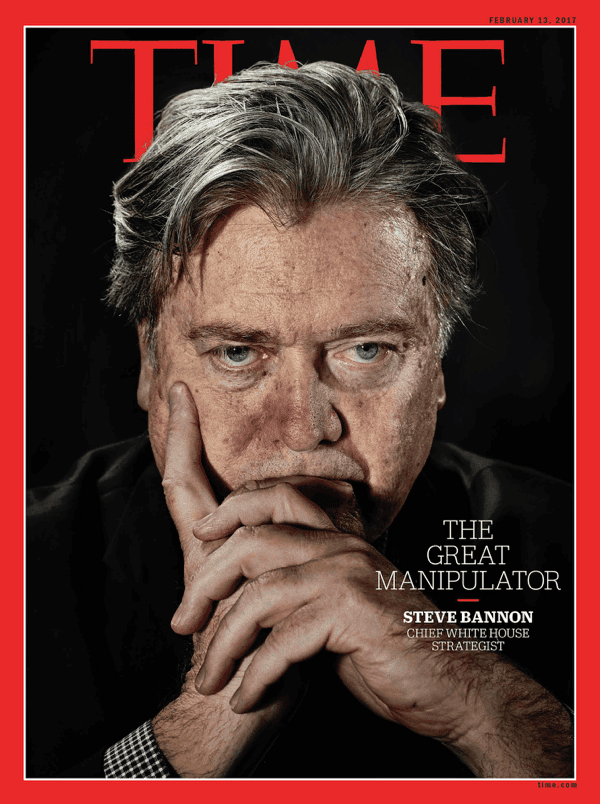
I suggested about a month ago that we may be nearing a peak in political populism based on the magazine cover indicator (see Peak populism?). The latest developments from Europe indicates that we may be nearing a political inflection point.
The populist Geert Wilders is losing ground in the upcoming Dutch election on March 15. Bloomberg reports that Wilders’ Freedom Party is running neck and neck with the establishment Liberals, which forms the current government:
Dutch Prime Minister Mark Rutte’s Liberals are making up ground on populist frontrunner Geert Wilders in the polls, suggesting that voter support is crystallizing in the final weeks of the campaign in favor of keeping Rutte in power.
Two polls released on Tuesday showed the Freedom Party with a one-seat advantage or even with the Liberals. That’s down from a lead of as many as 12 seats at the start of the year. A poll aggregator released Wednesday showed the Liberals narrowly ahead for the first time since November.
Business Insider also reported that Wilders has slipped to second place in one recent poll.
In France, conservative presidential candidate François Fillon’s political fortunes are imploding, based on the news that investigating magistrates have summoned him and his wife on charges that he put his wife on a government payroll for nonexistent work. In a press conference, Fillon decried the move as “political assassination” and vowed to fight on. This development has cleared a path for the centrist Emmanuel Macron to the French presidency. The latest Betfair odds shows Macron surging at Fillon’s expense. The anti-establishment and populist Marine Le Pen remains in second place, with little hope of winning the election.
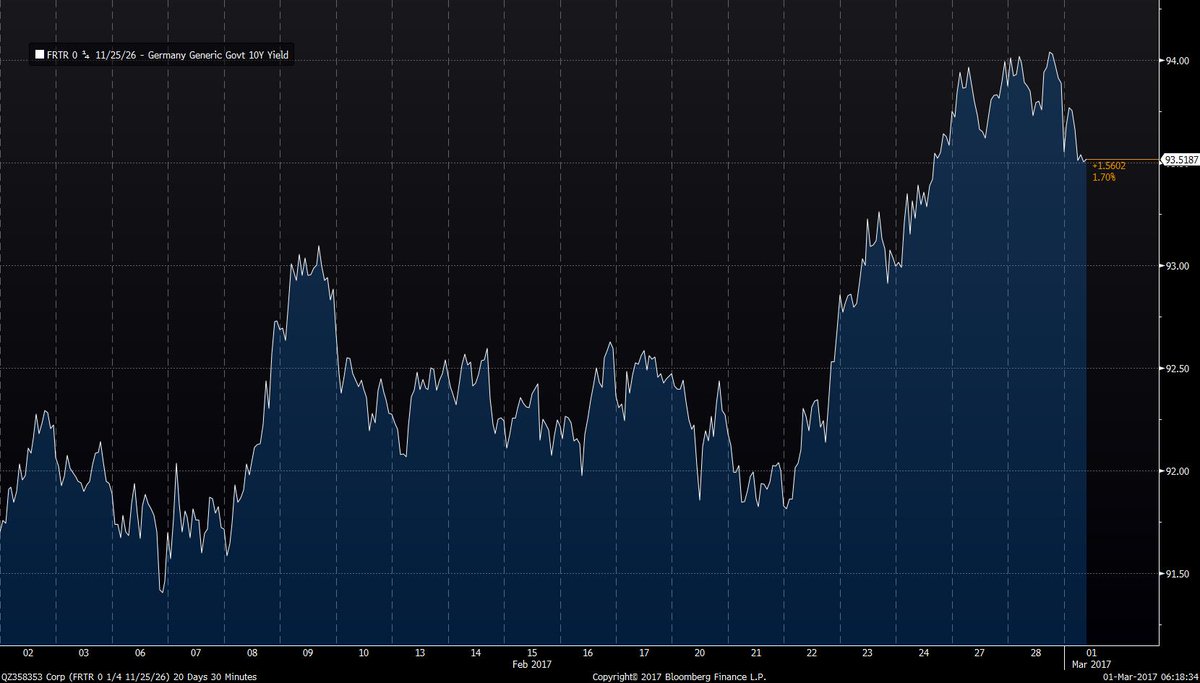
As a consequence, the French-German yield spread has begun to narrow.
The state of the European Union is getting stronger.
A March rate hike?
In a Bloomberg interview on February 21, Cleveland Fed president Loretta Mester stated that the Fed does not like to surprise the market on interest rate decisions. At the time of that interview, the odds of a March rate hike was in the 20-30% range. It is now about 70% after one Fed speaker after another warned that not only is the March FOMC meeting “live”, there is a distinct possibility that they may raise rates at that meeting. San Francisco Fed president John Williams said that he expect that the FOMC will a rate hike will warrant “serious consideration” at the March meeting. In a CNN interview, New York Fed president William Dudley said that the Fed will raise rates “fairly soon”.
What does this all mean?
Fed watcher Tim Duy thinks that the question is whether the Fed wants to be preemptive, or it wants to wait to see how fiscal policy develops:
When I read the interview, it is hard for me to see that he has a strong conviction for drawing forward the rate hike to March. It seems odd to do so if he sees no change in the forecast and downplays the impact of the upside risks. If he does want to move in March, it tells me then it has little to do with either factor and is entirely about staying ahead of the curve. It is about the need for a preemptive rate hike. If his forecast is for three hikes and he wants to hike in March, then his patience has ended and he wants those hikes frontloaded. If for FOMC participants as a whole the forecast has yet to change much, then it is possible that the even if they raise in March, the median projection of three rate hikes this year remains steady.
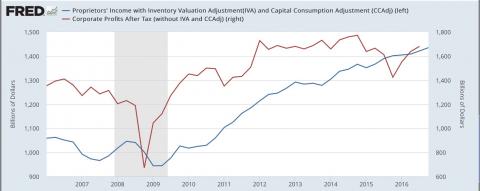
Much of the data has been coming on the “hot” side, indicating a robust economy with rising inflationary pressures. By the book, the Fed should be thinking seriously about starting a rate hike cycle about now. Indeed, there were several data points that were released today that are supportive of that view.
The Beige Book, which released today, showed a lot of “modest to moderate” growth. Labor markets are tight, with “moderate” employment growth. Some districts reported labor shortages. These are the kinds of conditions that Dudley referred to when he described an “economy continues on the trajectory that it’s on, slightly above-trend growth, gradually rising inflation” as the prerequisites to the removal of monetary policy accommodation.
This morning also saw the release of the ISM Manufacturing Survey, which rose and came in ahead of expectations, as it continued a trend of beating market expectations.
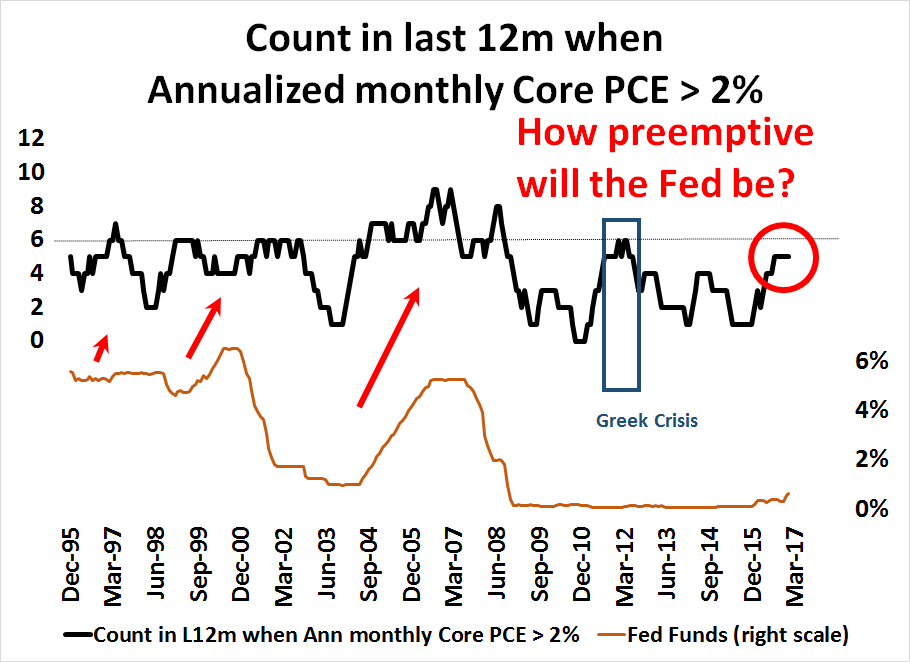
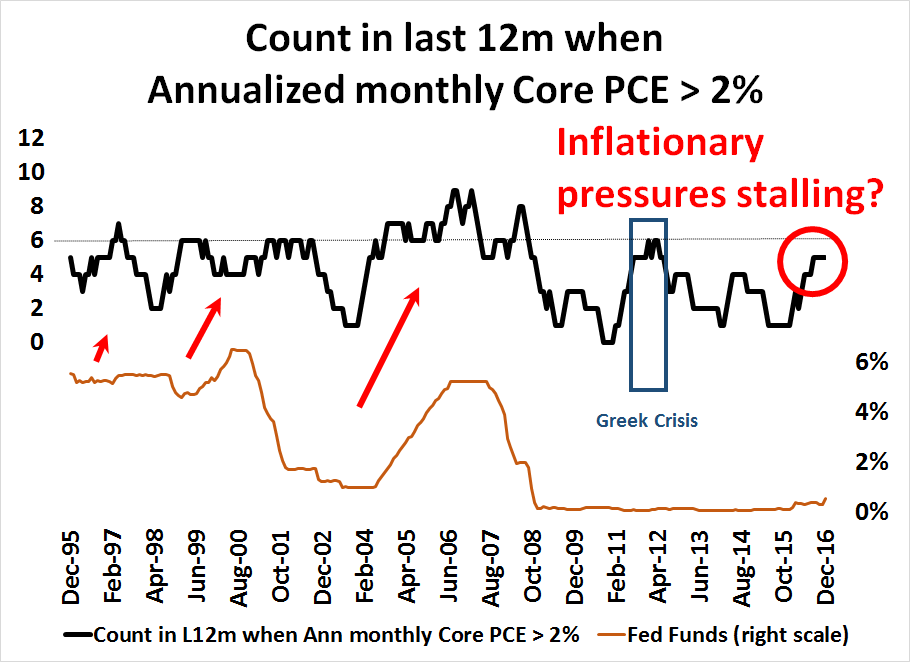
As well, month-over-month Core PCE, the Fed’s preferred inflation metric, was released this morning. It also came in ahead of expectations and surged to an annualized rate of 3.8%, well ahead of the Fed’s 2% inflation target.
To put this data point into context, I counted the times in the last 12 months that annualized m/m Core PCE has exceeded 2%. As the chart below shows, the Fed has historically begun a rate hike cycle whenever the count reached six (dotted line). The count currently stands at five, which begs the question, “How preemptive does the Fed want to be?”
Fed chair Janet Yellen and vice chair Stan Fischer are scheduled to speak on Friday. If they want to give the market further direction, we should get it then. In addition, Fed governor Lael Brainard is scheduled to speak a 6pm ET today (Wednesday). Brainard is one of the most dovish governors on the Board, if her tone sounds hawkish, then watch out!
A market blow-off
In summary, the stock market is undergoing a blow-off with no end in sight. We are starting to see bullish political developments out of Europe, but one wildcard is the possibility of a March rate hike. Should the Fed preemptively raise rates, not only would the normal macro effects of slowing the American economy be applicable, it would push up the US Dollar. A rising USD would be bearish in three ways. First, a strong greenback squeezes the margins and therefore the earnings of large cap multi-nationals companies. It would be supportive of the “America First” contingent within the Trump administration in their protectionist policies. As well, a strong USD would pressure the emerging market countries and companies with USD debt and raise the odds of an EM debt crisis.
My inner trader initiated a small SPX position on Tuesday. He is maintaining his position in view of the downside risks to the market.
Josh Brown had a terrific comment about the secret of Warren Buffett’s success. Buffett is unabashedly “permabullish” on America:
One of the hallmarks of Berkshire’s success has been its willingness to raise or lower its formidable cash hoard in response to the presence (or lack thereof) of viable investing opportunities. One of the other hallmarks of Buffett’s approach has been to tune out forecasts and de-emphasize the importance of them in general.
The one thing Buffett has never given up on is the idea that American productivity, innovation and economic dynamism will always lead to substantially greater prosperity in the future. And he’s been right for decades, through all sorts of setbacks, crises and challenges for the nation.
So if the choice is to be in the Buffett camp vs the David Stockman camp or the Peter Schiff camp, well, I regard that as no real choice at all.
Lastly, permabulls need not be blind to the possibility of market declines, economic catastrophes (real or imagined) and other momentary trials and tribulations. Buffett’s got these possibilities built right into his manifesto:
Charlie and I have no magic plan to add earnings except to dream big and to be prepared mentally and financially to act fast when opportunities present themselves. Every decade or so, dark clouds will fill the economic skies, and they will briefly rain gold. When downpours of that sort occur, it’s imperative that we rush outdoors carrying washtubs, not teaspoons. And that we will do.
That formula has worked out well. Stay bullish on the belief of the dynamism of America, and buy good businesses when they become cheap. In a post-election interview with CNN, Buffett expressed confidence in the supremacy of the American businesses (click on this link if the video is unavailable).
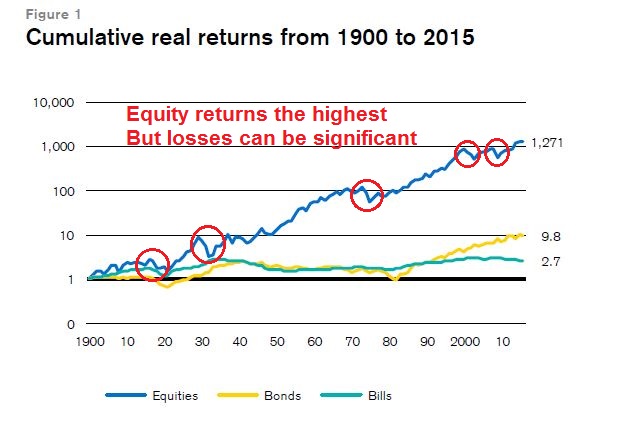
There is much to be said about the Buffett formula. According to Credit Suisse, US real equity returns has been the highest in the world. Though the stock market has experienced serious losses, prices have always come back.
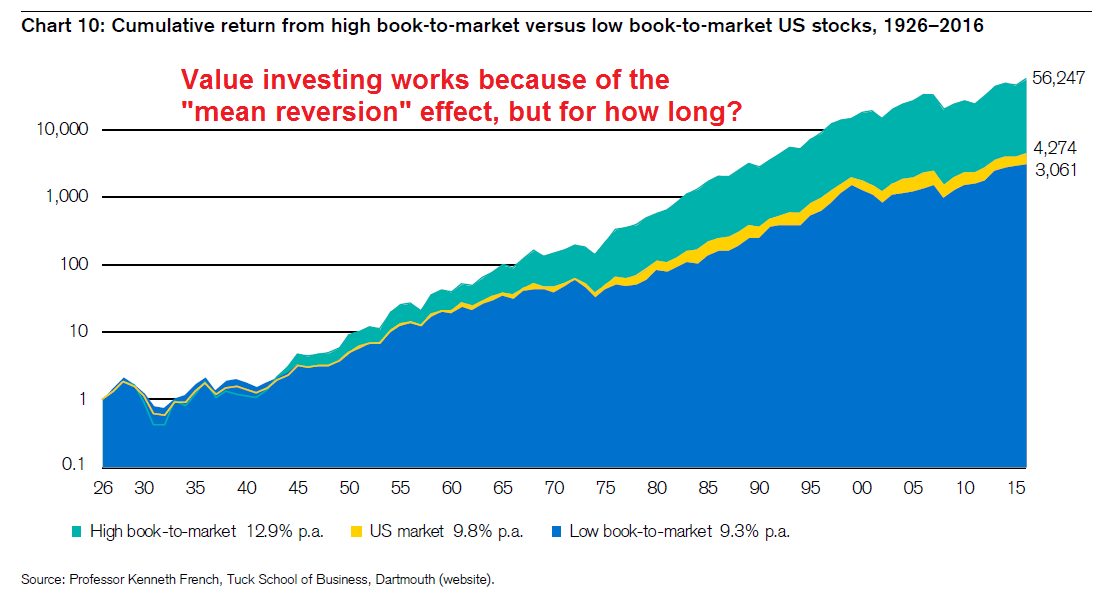
A value orientation, as proxied by a high price to book, outperforms the market. Buffett then couples the value discipline by buying companies with a moat, or a sustainable competitive advantage. The combination of buying value companies with a moat has been the secret of success.
However, we may be reaching an inflection point for Buffett`s brand of investing. In the Age of Trump, the tailwinds on Buffett`s value approach may be coming to an end.
The end of Pax Americana?
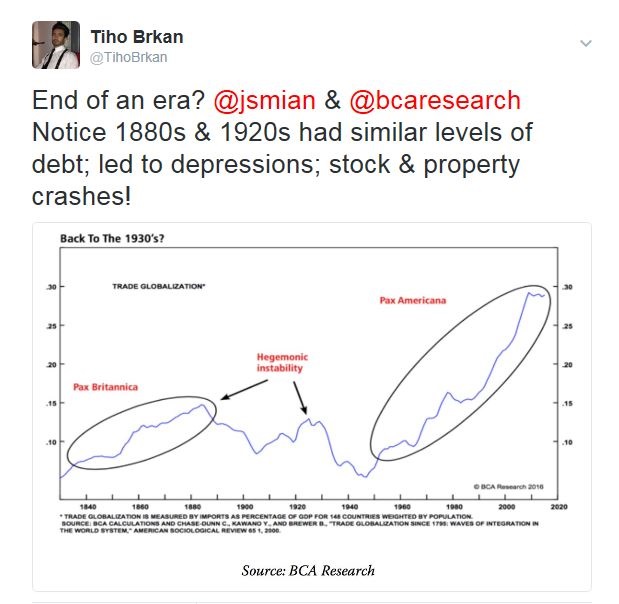
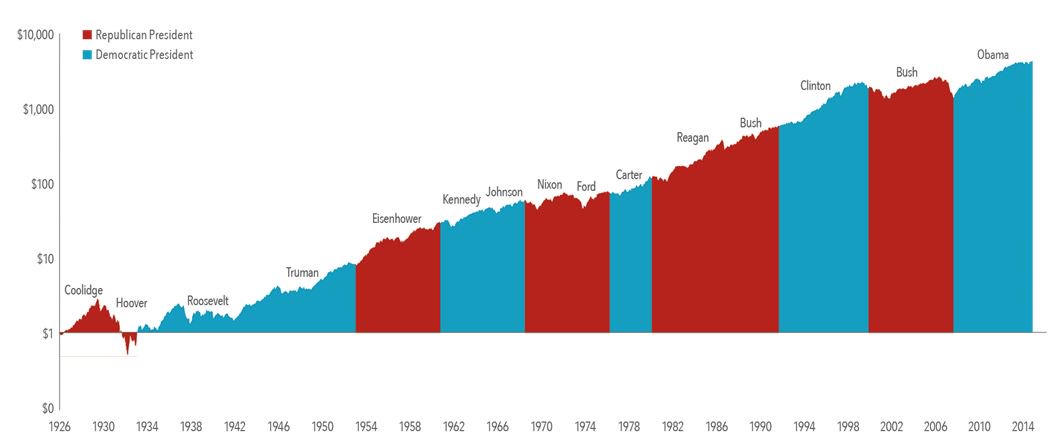
This chart from BCA Research (via Tiho Brkan) tells the story. Buffett’s successful run coincides with the era of Pax Americana and rising global trade. What would happen if the growth in global trade were to come to a screeching halt? What kinds of stresses would the global economic system face?
Value investing depends on valuation a mean reversion effect, or the tendency of cheap stocks to return to becoming more reasonably priced. What if mean reversion were to stop occurring? What would happen to some of those business moats if global trade were to start shrinking?
Donald Trump’s America First policies certainly raises the risk level. Politico reported last week that Trump wants to re-negotiate trade treaties upon a moment’s notice whenever the US gets into trouble:
Trump has said he wants to include a clause in trade agreements that would allow the United States to get out within 30 days if the other country balks at fixing any problem that occurs. Last week, White House trade adviser Peter Navarro upped the ante by telling Senate Finance Committee members that the administration also wants to include a provision that would trigger a renegotiation whenever the United States runs a trade deficit with the partner country, Morning Trade has learned.
WTF? This is the same Peter Navarro who dismissed analysis from Citigroup outlining how retailers would be losers under a Border Adjustment Tax (BAT) as “fake news” (via Business Insider):
CNBC’s Melissa Lee pointed to a Citigroup estimate that said this new tax would be a massive hit to company earnings. That means people working in retail would likely lose their jobs as companies try to cut costs.
Navarro immediately got defensive.
“Well, first of all, this is a false narrative and a fake study,” he countered.
Lee was a bit surprised. “Let me get this right,” she said, “Citigroup did a fake study?”
“Citigroup has no credibility,” Navarro said. He called the bank’s analysis, and analysis from the Peterson Institute for International Economics, “garbage studies and scare tactics” and compared them to media outlets like MSNBC and CNN.
“We are not backing off,” he said.
Lee pointed out that Citigroup isn’t the media — it’s research written for investors looking to find out if companies are healthy. Navarro ignored that point.
“Yeah, well, the Dow just hit 20,000, how you like them apples?” he said. “There are winners and losers.”
America First Protectionism = EM debt crisis
If the Trump administration is intent on going down that trade policy path in the name of “America First”, then the risks are rising very, very quickly. Here is one immediate problem that market analyst and Texas Republican John Mauldin is worried about:
Paul Ryan and House Ways & Means Committee Chair Kevin Brady know everything I just said and probably agree with much of it. They believe the BAT’s negative effects will disappear quickly due to currency flows. As the trade deficit shrinks, fewer dollars will flow from the US to the rest of the world. That trend will make the dollar rise against other currencies, thereby nullifying the higher prices we will pay for imported goods.
That’s the theory. In fact, most economists do agree that the dollar is likely to rise significantly if this proposal is adopted. So, the theory is that Walmart shoppers really won’t pay higher prices, at least in dollar terms. I do not think things will work that way in practice, at least not as quickly as they hope…
Here we see once again how debt constrains us from doing what might otherwise make sense. Emerging-market countries own massive amounts of dollar-denominated debt. A stronger dollar means they must somehow come up with more of their local currencies to repay their dollar debts. And they will have to do it fast, even as their exports are shrinking because US consumers are being encouraged to “buy American.”
It gets worse. To whom is all that emerging-market debt owed? Primarily to Western banks and bondholders, who are often themselves excessively indebted. The potential financial contagion is massive. Ambrose Evans-Pritchard of the London Telegraph describes it in his characteristically colorful style:
Yet getting there constitutes a global shock of the first order. “This will trigger a series of emerging market crises,” said Stan Veuger from the American Enterprise Institute. He estimates that the burden for companies and states in developing countries with dollars debts will jump by $750bn. Turkish firms alone would face a $60bn hit.
It does not end there. Studies by the Bank for International Settlements show that a rising dollar automatically forces banks in Europe and the Far East to shrink cross-border lending through the mechanism of hedge contracts.
A dollar spike of anywhere near 20pc would send the Chinese yuan smashing through multiple lines of psychological resistance. The People’s Bank (PBOC) is already intervening heavily to defend the line of seven yuan to the dollar. Ferocious curbs would be needed to stop the Chinese middle classes funneling money out of the country if it crashed by a fifth.
Junheng Li from Warren Capital says the China’s exchange regime is more brittle than it looks. Official data overstates the PBOC’s fighting fund by $1 trillion, either because reserves are “encumbered” by forward dollar sales or because they must be held in reserve as a “fiscal backstop” for Chinese firms at risk of default on dollar debts. She expects the system to snap at any time, and without warning.
I strongly doubt whether the Trump-Ryan axis in Washington has any idea what could happen if they detonate a debt-deflation crisis in China, or if they ignite a short-squeeze on $10 trillion of off-shore dollar debt with no lender-of-last-resort behind it. Nor do they care.
A surging USD from the imposition of a BAT could spark another emerging market currency crisis. This time, the world won`t have the benefits of rising global trade to cushion the blow.
When confidence cracks
The blogger Jesse Livermore at Philosophical Economics wrote an insightful post last weekend about the interaction of valuation and cash in a low yielding world:
A useful way to estimate that value for a security you own is to ask yourself the question: what is the most you would be willing to pay for the security if you couldn’t ever sell it? Take the S&P 500 with its $45 dividend that grows at some pace over the long-term–say, 2% real, plus or minus profit-related uncertainty. What is the most that you would be willing to pay to own a share of the S&P 500, assuming you would be stuck owning it forever? Put differently, at what ratio would you be willing to permanently convert your present money, which you can use right now to purchase anything you want, including other assets, into a slowly accumulating dividend stream that you cannot use to make purchases, at least not until the individual dividends are received?
When I poll people on that question, I get very bearish answers. By and large, I find that people would be unwilling to own the current S&P 500 for any yield below 5%, which corresponds to a S&P 500 price of at most 1000. The actual S&P trades at roughly 2365, which should tell you how much liquidity–i.e., the ability to take out the money that you put into an investment–matters to investors. In the case of the S&P 500, it represents more than half of the asset’s realized market value.
Much of the valuation of equities in the current environment depends on confidence:
Now, here’s where the parallel to banking comes into play. As with a bank, a market’s liquidity is backed by a network of confidence among its participants. Participants trust that there will be other participants willing to buy at prices near or above the current price, and therefore they themselves are willing to buy, confident that they will not lose access to their money for any sustained period of time. Their buying, in turn, supports the market’s pricing and creates an observable outcome–price stability–that reinforces trust in it. Because the investors don’t all rush for the exits at the same time, they don’t have a need to rush for the exits. They can rationally collect the excess returns that the market is offering, even though those returns would be insufficient to cover the cost of lost liquidity.
When the network of confidence breaks down, you end up with a situation where people are holding securities, nervous about a possible loss of access to their money, while prevailing prices are still way above intrinsic value, i.e., way above the prices that they would demand in order to compensate for a loss of liquidity. So they sell whatever they can, driving prices lower and lower, until confidence in a new price level re-emerges. Prices rarely go all the way down to intrinsic value, but when they do, investors end up with generational buying opportunities…
The question comes up: in a low rate world, with assets at historically high valuations, offering historically low returns, what should investors do? Should they opt to own assets, or should they hold cash? The point I want to make in all of this is that to answer the question, we need to gauge the likely strength and sustainability of the market’s network of confidence amid those stipulated conditions. We need to ask ourselves whether investors are likely to remain willing to buy at the high valuations and low implied returns that they’ve been buying at. If the conclusion is that they will remain willing, then it makes all the sense in the world to buy assets and continue to own them. And if the conclusion is that they won’t remain willing, that something will change, then it makes all the sense in the world to choose hold cash instead.
Now imagine that global trade starts to unravel and EM countries experience a currency crisis, which morphs into a global financial crisis. What happens to confidence then?
If we want to get in front of things that are going to break a market’s network of confidence and undermine people’s beliefs that they’ll be able to sell near or above where they’ve been buying, we shouldn’t be focusing on valuation. We should be focusing instead on factors and forces that actually do cause panics, that actually do break the networks of confidence that hold markets together. We should be focusing on conditions and developments in the real economy, in the corporate sector, in the banking system, in the credit markets, and so on, looking for imbalances and vulnerabilities that, when they unwind and unravel, will sour the moods of investors, bring their fears and anxieties to the surface, and cause them to question the sustainability of prevailing prices, regardless of the valuations at which the process happens to begin.
Under that scenario, would buying the dip work? Could Berkshire Hathaway depend on the moats of these companies that Buffett purchased? How many of those moats would be breached if global trade tanks? Could you depend on the resiliency of a leaderless capitalist system when America is no longer willing to be its leader? What happens to the political systems of the leading industrialized countries in the world?
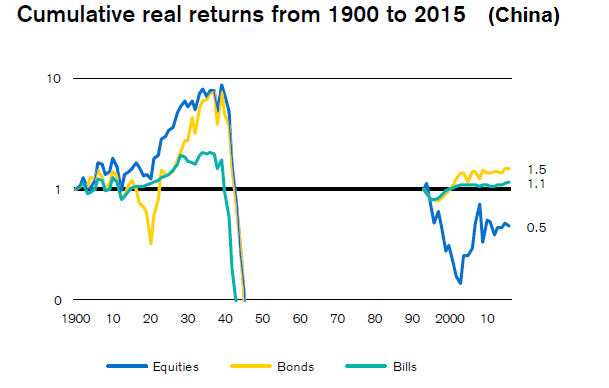
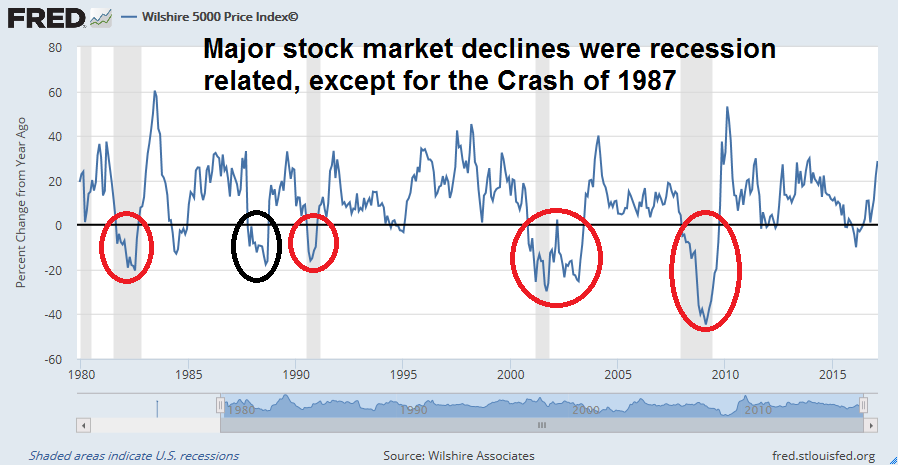
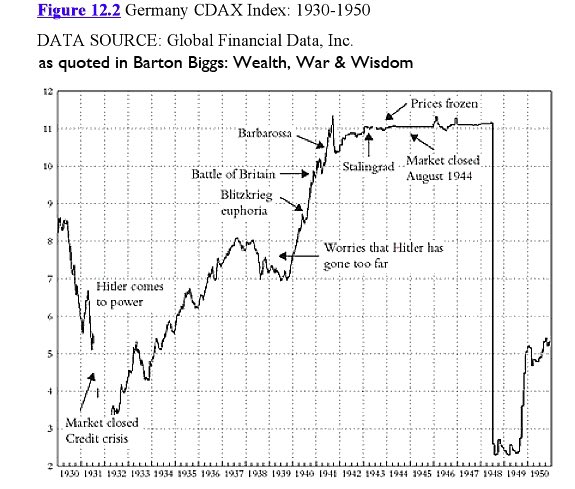
As per Credit Suisse, remember what happened the markets of major countries that underwent major political upheaval in the 20th Century:
Do you still want to bet on mean reversion and the sustainability of business moats under those kinds of scenarios?
Preface: Explaining our market timing models
We maintain several market timing models, each with differing time horizons. The “Ultimate Market Timing Model” is a long-term market timing model based on the research outlined in our post, Building the ultimate market timing model. This model tends to generate only a handful of signals each decade.
The Trend Model is an asset allocation model which applies trend following principles based on the inputs of global stock and commodity price. This model has a shorter time horizon and tends to turn over about 4-6 times a year. In essence, it seeks to answer the question, “Is the trend in the global economy expansion (bullish) or contraction (bearish)?”
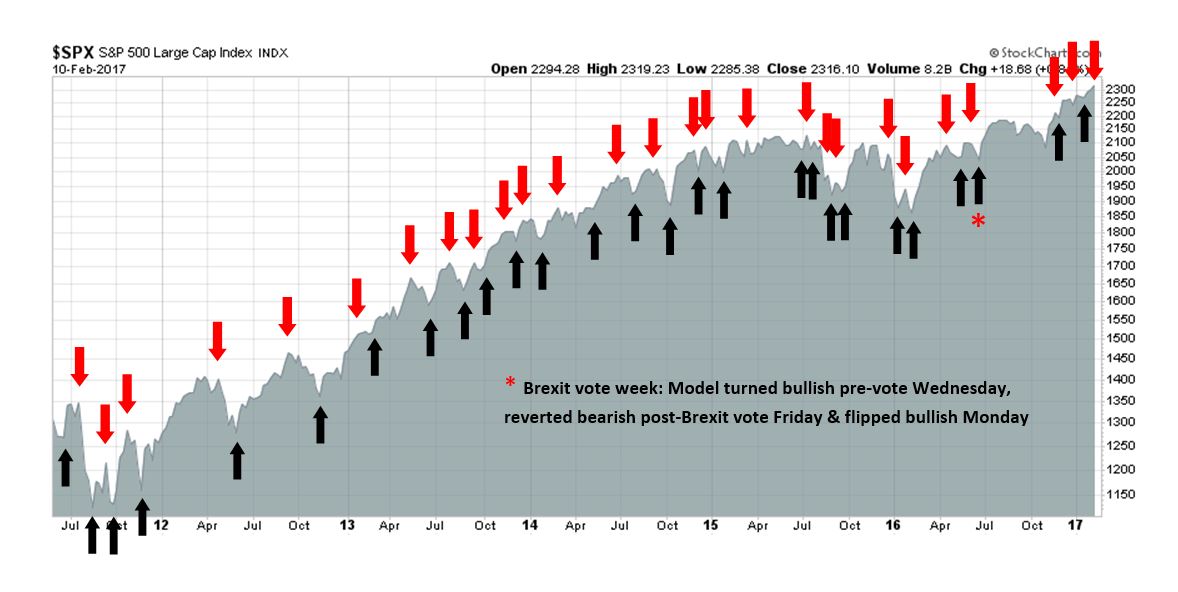
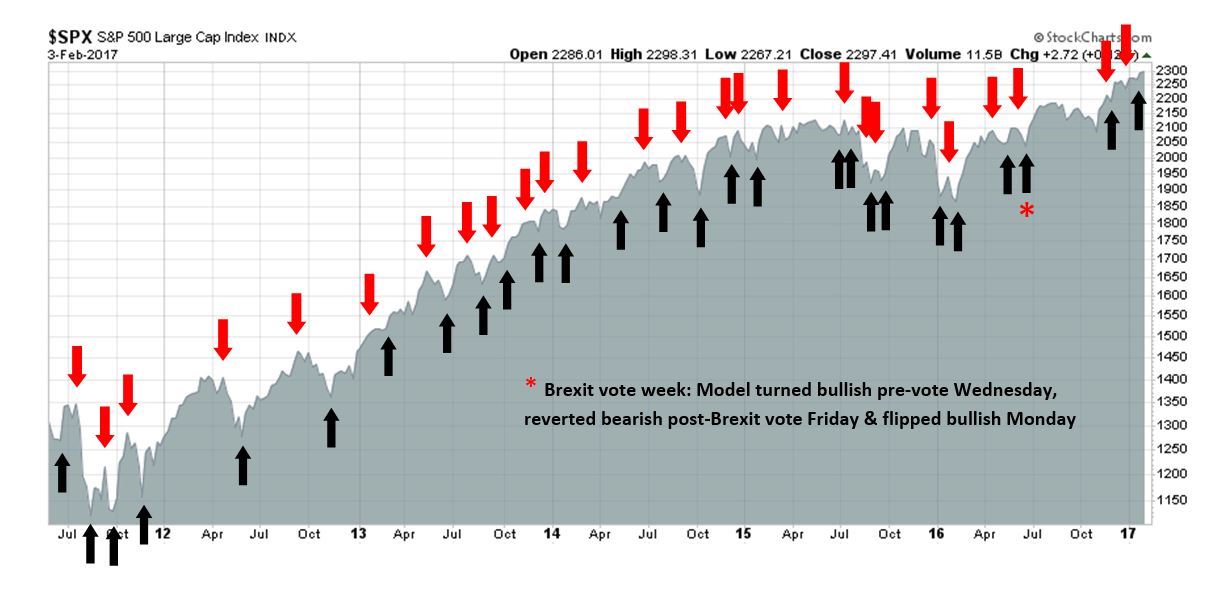
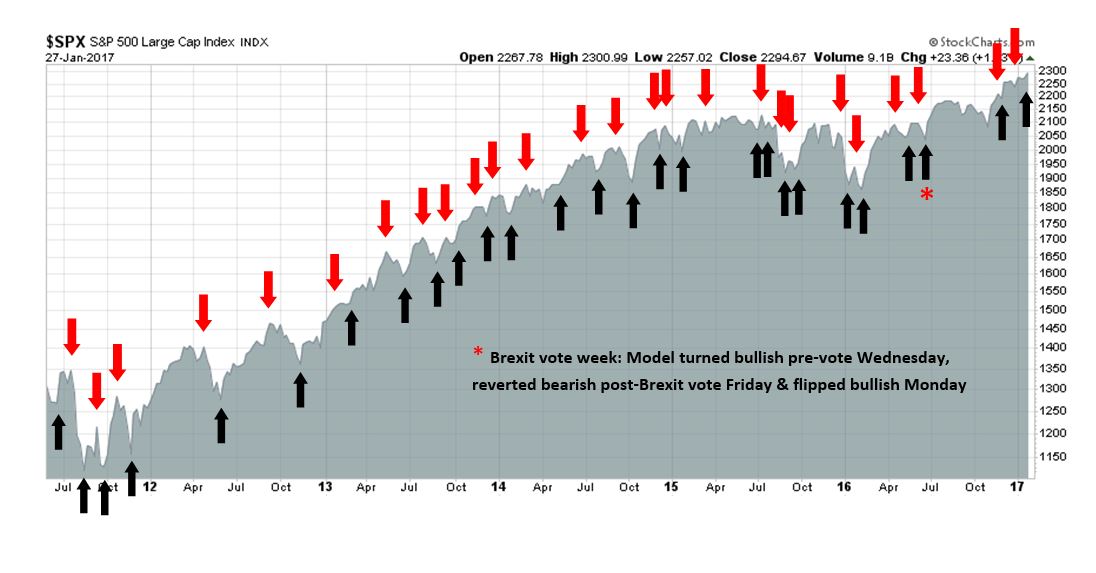
My inner trader uses the trading component of the Trend Model to look for changes in the direction of the main Trend Model signal. A bullish Trend Model signal that gets less bullish is a trading “sell” signal. Conversely, a bearish Trend Model signal that gets less bearish is a trading “buy” signal. The history of actual out-of-sample (not backtested) signals of the trading model are shown by the arrows in the chart below. Past trading of the trading model has shown turnover rates of about 200% per month.
The latest signals of each model are as follows:
Ultimate market timing model: Buy equities
Trend Model signal: Risk-on
Trading model: Bearish
Update schedule: I generally update model readings on my site on weekends and tweet mid-week observations at @humblestudent. Subscribers will also receive email notices of any changes in my trading portfolio.
Sell the news?
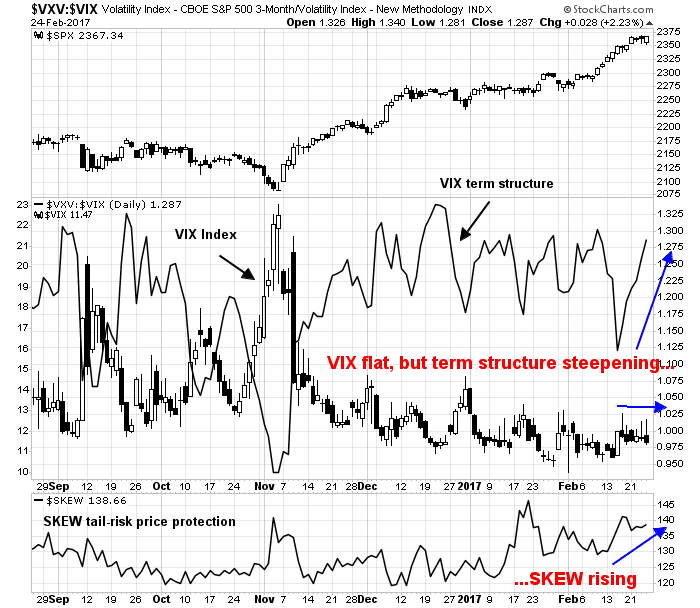
There has been much written lately about low level of stock market volatility, as measured by the VIX Index. It’s interesting that these concerns have even surfaced in the latest FOMC minutes:
Financial asset prices were little changed since the December meeting. Market participants continued to report substantial uncertainty about potential changes in fiscal, regulatory, and other government policies. Nonetheless, measures of implied volatility of various asset prices remained low.
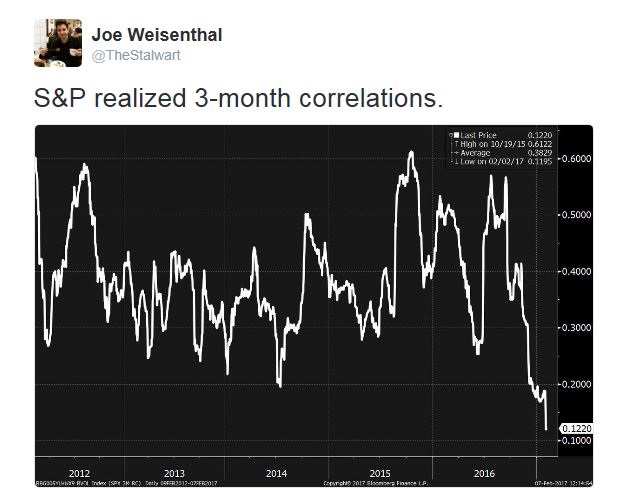
A little noticed change has occurred in the markets since mid-February. Even though stock prices were grinding upwards, VIX term structure began to steepen as 3-month VIX futures rose but 1-month VIX remained stable. As well, the bottom panel shows that SKEW, which measures the price of tail-risk protection, is rising. These readings indicate that the market is anticipating a near-term volatility event.
The most likely spark for a volatility event is Trump’s address to Congress on Tuesday, when he is expected to outline his tax reform proposals. This speech has the potential to raise the “uncertainty about potential changes in fiscal, regulatory, and other government policies”.
The stock market has rallied substantially in anticipation of Trump’s proposal of tax cuts, tax holiday for offshore cash repatriation, and deregulation. As Trump’s tax reform proposals become more clear, it is becoming evident that there are two likely outcomes. Either Wall Street will have to swallow the bitter pill of the protectionist measures of a Border Adjustment Tax (BAT), or they will get delayed and bogged down in Congress.
As the market has bought the rumor of tax cuts, it may now be time to sell the news.
Waiting for tax reform
Here is where we stand right on tax reform. In a recent Reuters interview, here is what Donald Trump said when asked about the prospects for tax cuts and deregulation:
“We’re going to have a corporate tax cut … anywhere from 15 to 20 percent (as a target for the corporate tax rate). … We’re going to have other things that are very good and we’re going to have a tremendous regulatory cut because the regulations are piled up on top of each other and you’ll have many regulations for the same thing within different industries and it’s out of control. The regulations in this country are out of control. And it makes it hard for businesses to even open in the United States. We’re going to get rid of a lot of the unnecessary regulations.”
That’s the good news. The bad news is they will likely be accompanied by a BAT as a way to pay for the tax cuts:
“It could lead to a lot more jobs in the United States. … I certainly support a form of tax on the border because everybody else does. We’re the only country, we’re one of the very few countries, possibly the only country, that has no border tax. And that’s not a tax to the consumer, because that’s going to be a tax to companies and it’s going to be a tax to other countries much more so than it is to the consumer. That’s a tax to other countries. And what will happen is, don’t forget there is no tax if we make our product in the United States. So I don’t consider it a tax. That’s a tax if companies are buying their product outside of the United States. But … if they make their product in the United States, there is no tax. So what is going to happen is companies are going to come back here, they’re going to build their factories and they’re going to create a lot of jobs and there’s no tax.”
For readers who are unfamiliar with the BAT concept, here is a discussion of BAT from market analyst and Texas Republican John Mauldin:
Under the BAT plan, imports will be penalized and exports rewarded, which, theoretically, in a perfect world without pushback, would leave our economy nicely balanced and undisrupted. That’s the idea. But I doubt it will happen that way, because the importers and exporters are not the same businesses.
A vast number of businesses import products from other countries and sell them to Americans. Toy companies are a good example. Virtually all the shiny presents under your Christmas tree were made outside the US. The companies that import them could be border-adjusted right out of business under the Better Way plan.
Here’s an example. Suppose you are a toy company and you spend $1 million to bring in toys from China. You package and distribute them to retailers around the country, generating an additional $500,000 in costs for yourself. You sell them at wholesale for $2 million. What’s the tax consequence?
You just spent $1.5 million to generate $2 million in revenue. But the $1 million you spent on the imports is no longer deductible on your tax return. So your taxable profit isn’t $500,000, it’s $1.5 million. At 20%, your corporate income tax is $300,000 instead of $100,000. This plan triples your taxes…
At best there will be an adjustment period, which will be far longer than those who propose this plan think, as workers retrain for new jobs. We’ve heard this story before, and it didn’t work out as advertised. So count me skeptical.
The problem is that the importers and exporters don’t all operate in the same states and counties, so the people who lose their jobs because of the import tax will end up having to move to where the exporting jobs are. How did that work out for the Rust Belt when the steel jobs left? For whatever reason, the data clearly shows we are moving less than we ever have before.
Liberty Street Economics, a blog run by the New York Fed, which believes that a BAT is unlikely to substantially promote exports:
How will U.S. exporters fare? An unintended consequence of the proposed border tax is that it is likely to depress rather than stimulate exports. As export prices are also invoiced in U.S. dollars, the tax exemption on export revenue will mostly boost exporters’ profit margins rather than increase their export sales. And with the accompanying partial appreciation in the U.S. dollar, the prices of U.S. exports in foreign currencies will rise. This will provide incentives for our trading partners to switch their demand away from U.S.-produced goods, resulting in lower U.S. export sales.
Those are just the first order effects. John Mauldin thinks that a BAT will set off a global trade war:
When you talk to Republican leaders and ask them why other countries wouldn’t react to the BAT and impose larger tariffs or sanctions on US goods, they respond with a question of their own; and it’s a logical one: “But why would they? We’re only doing with the BAT what they’re already doing to us.” And they are correct. US corporations are at a massive competitive disadvantage today because we have high corporate taxes and no VAT. Other nations do not charge a VAT tax when their companies export products. That means a German car sold in Asia or a Japanese car sold in Europe has a competitive tax advantage over a car made in the US and on sale in those countries. The Republicans are simply trying to rectify that competitive disadvantage.
The problem is that other countries are simply not going to say, “Oh, the United States finally figured it out that we were taking advantage of its silly, complicated tax system. There’s really nothing we can do, so let’s just get on with the program.” No, they are going to protect their own businesses. In international trade, it’s every country for itself. They are all going to react to losing anything that they think is a competitive advantage. If you don’t get this, go back to kindergarten and study children trading toys in their sandbox. This behavior is ingrained in every human being.
Mauldin concluded (remember, he is a long-time Texas Republican):
I know this is going to offend a few of my friends, but I’m going to say it anyway: I am afraid that this border adjustment tax, if implemented, will throw the world into a global recession. All of the wonderful tax cuts and beautiful plans that are being proposed along with the BAT will not be enough to keep the US from participating in that recession as well.
Understand, I’m a believer in free markets, and I know that the American enterprise and entrepreneurial system, when given an opportunity, can respond and create growth in this country. But the BAT is not the way to do it.
That’s just the pushback from the “moderate” wing of the GOP. Here is an example of the opposition to BAT from the right wing of the party (via Breibart):
The latest solution from GOP “leadership” grab bag of bad ideas is the ill-conceived proposal to “help” America with her huge ($491 billion) global trade deficit with the Border Adjustment Tax (BAT).
The idea goes like this: The U.S. will tax all imports at 20 percent and provide a rebate of 20 percent on American exports sold abroad. That is not only counterproductive from a trade deficit reduction standpoint; it is skewed to help large American corporations over small and mid-sized American producers…
The solution is the scaled tariff. The tariff looks at the trailing twelve months (TTM) of trade balance between other nations and the United States. The tariff would only be applied to countries that have a significant or chronic surplus with the United States. The tariff would be adjusted quarterly up or down based upon the (TTM) figures. As trade heads toward balance, the tariff will self-adjust downward for that country. If a trading partner retaliates with counter-tariffs or currency manipulation that drive a greater deficit, the tariff will rise in direct relation to the (TTM) figures.
Any BAT will be a bitter pill for the equity market to swallow in order to get its tax cuts. A scaled tariff will even be worse.
Legislative chaos
The other likely scenario is a delay of the tax reform as it gets bogged down in Congress. The Hill reported that Ryan’s tax reform plan won’t get more than ten votes in the Senate:
Sen. Lindsey Graham (R-S.C.) says the House GOP tax plan that Speaker Paul Ryan (R-Wis.) tried to sell to Senate Republicans won’t get 10 votes in the upper chamber.
If Graham is correct, it’ll be a blow for Ryan and House Ways and Means Committee Chairman Kevin Brady (R-Texas), who are pushing a 20 percent across-the-board tax increase on imports to pay for comprehensive tax reform.
The idea has run into staunch resistance in the Senate, which bodes ill for President Trump’s hopes of passing tax reform this year.
The Trump administration is still not fully staffed, which is going to slow down its legislative agenda. Business Insider reported that Trump will delay its proposals for infrastructure spending to next year’s legislative calendar. In addition, AP (via Business Insider) reported that the Trump administration also faces a looming debt ceiling fight and possible government shutdown this spring:
Add a potential government shutdown to embattled President Donald Trump’s growing roster of headaches.
Beneath the capital’s radar looms a vexing problem — a catchall spending package that is likely to top $1 trillion and could get embroiled in the politics of building Trump’s wall at the US-Mexico border and a budget-busting Pentagon request.
While a shutdown deadline has a few weeks to go, the huge measure looms as an unpleasant reality check for Trump and Republicans controlling Congress.
Despite the big power shift in Washington, the path to success — and averting a shuttering of the government — goes directly through Senate Democrats, whose votes are required to pass the measure. And any measure that satisfies Democrats and their new leader, Sen. Chuck Schumer of New York, is sure to alienate tea party Republicans. Trump’s determination to build his wall on the US-Mexico border faces a fight with Democrats, too.
In effect, the market is faced with the unpalatable choice of BAT, or a delay of expected tax cuts until next year, with no idea of how the water down the proposals will be.
Good news, and bad news
If investors had bought the rumor of the tax cuts, does that mean that they should now sell the news?
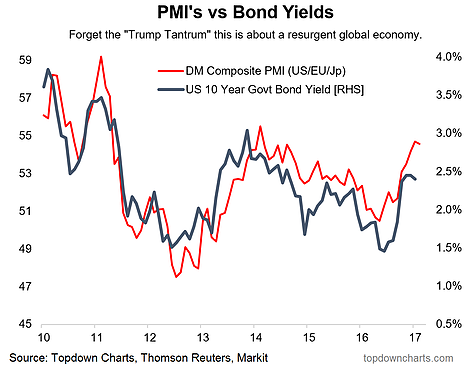
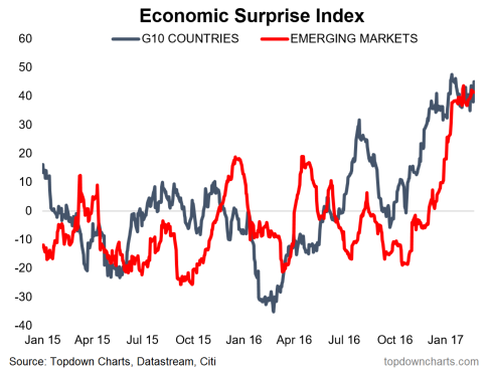
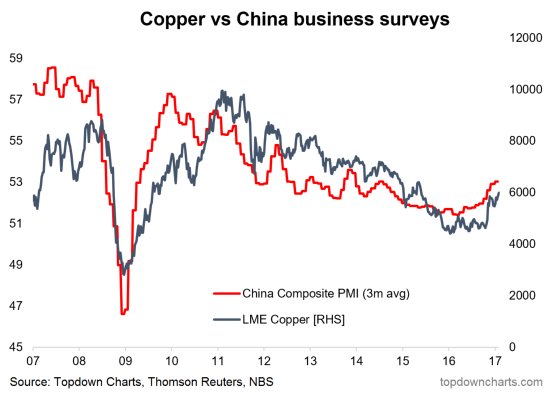
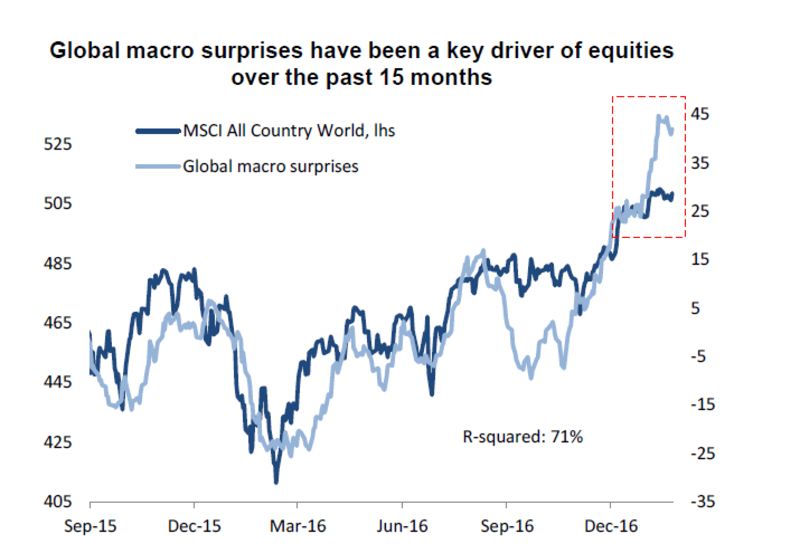
Before making a decision on that question, there is some good news and bad news about the market. Here is the good news. The market rally was sparked mainly by a reflationary growth rebound. As these charts from Callum Thomas of Topdown Charts show, the rebound is broad and global in scope.
There has also been a surge in global Economic Surprise Indices, which measure whether top-down economic indicators are beating or missing expectations.
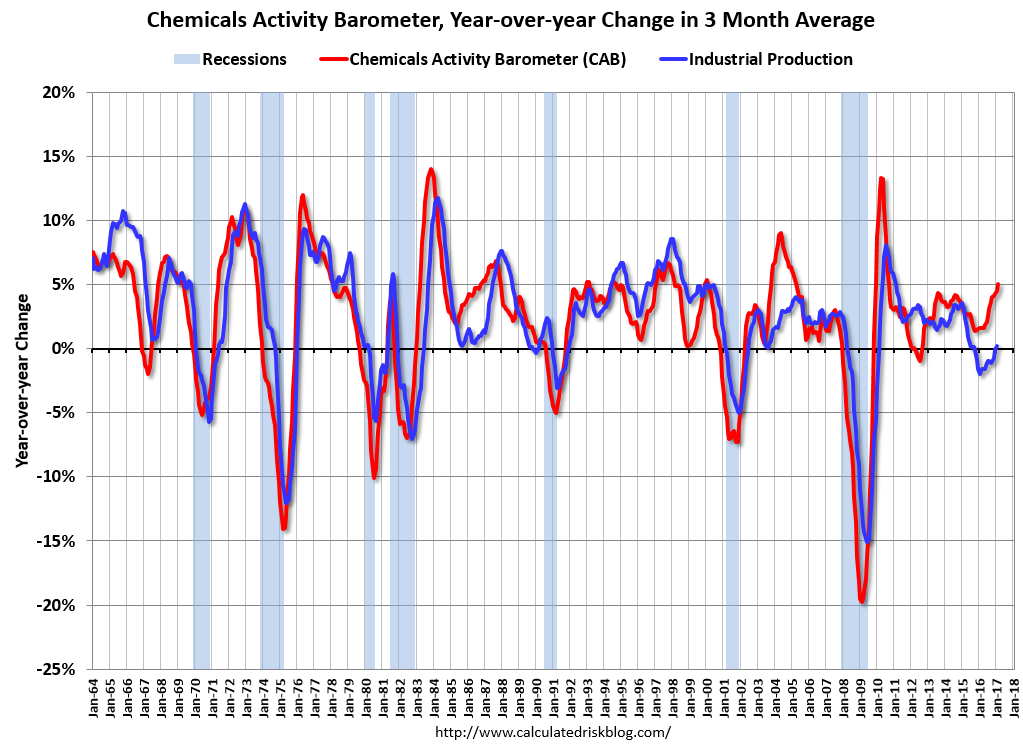
Specific to the US, the Chemical Activity Barometer, which leads industrial production, is also rising strongly (via Calculated Risk):
The good news is global macro momentum is pointed upwards.
As good as it gets?
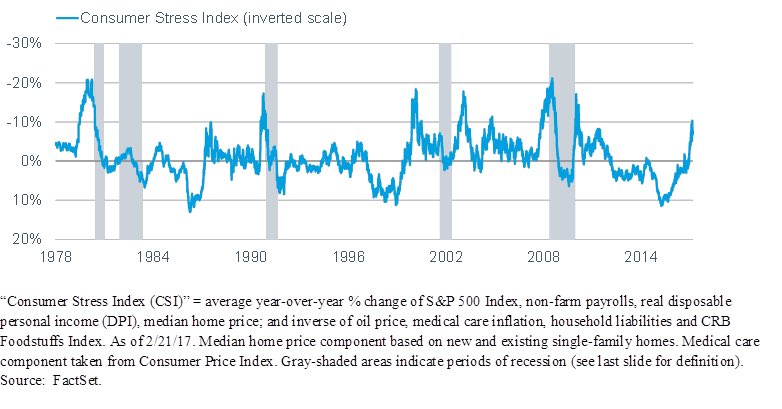
The bad news is conditions may be as good as they get. Liz Ann Sonders observed that consumer stress is rising. While readings are not at danger levels, it does hint at a loss of positive momentum.
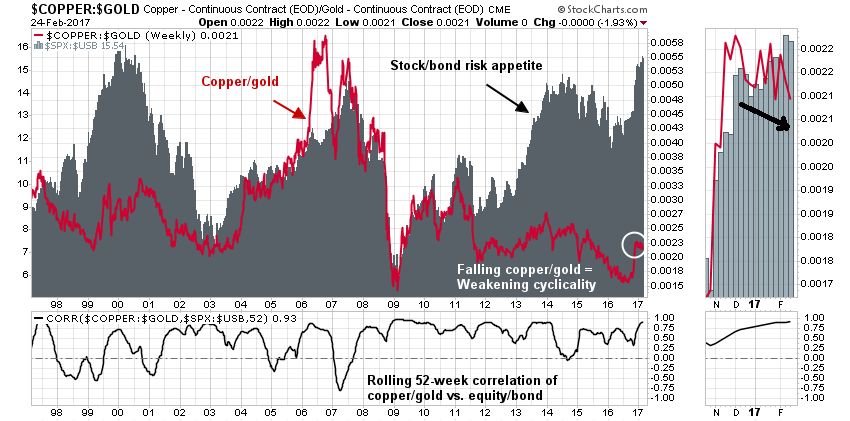
Copper prices, which is an indicator of the global cycle, are starting to weaken. The chart below shows the copper/gold ratio (red line) and the equity/bond ratio (grey bars). While both copper and gold are hard assets, copper has a greater cyclical element and therefore the copper/gold ratio is a sensitive barometer of global cyclical demand. The stock/bond ratio is a measure of market risk appetite, and it has historically been highly correlated to the copper/gold ratio (bottom panel).
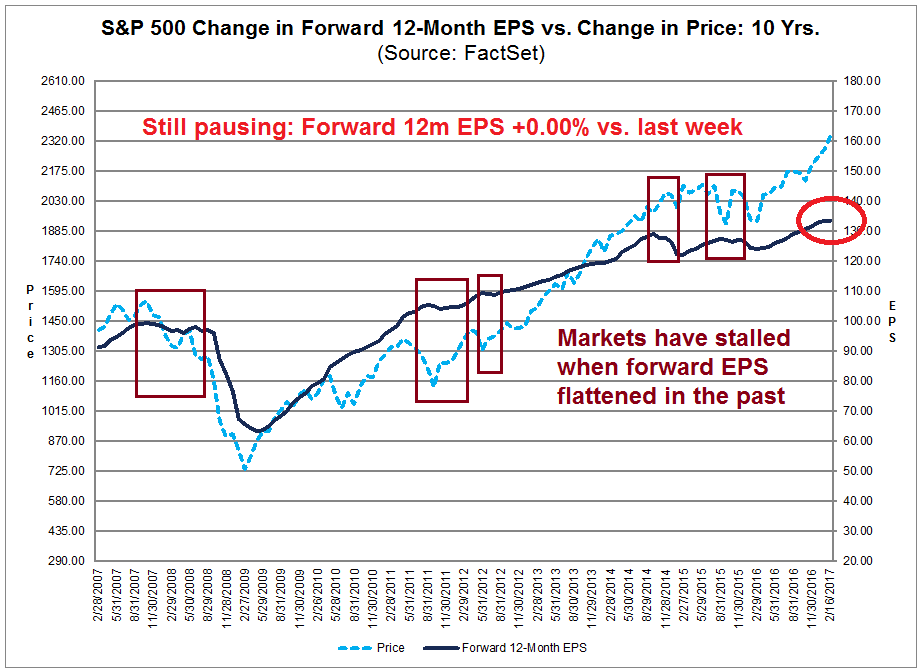
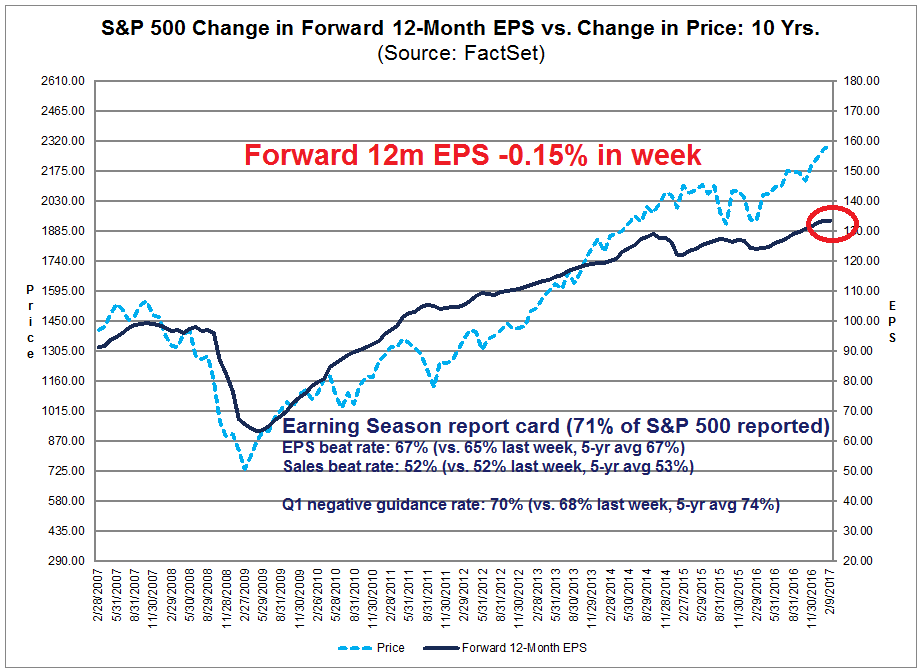
The latest update from Factset shows another sign of stalling momentum Forward 12-month EPS was flat compared to last week and fell compared to two and four weeks ago (annotations are mine).
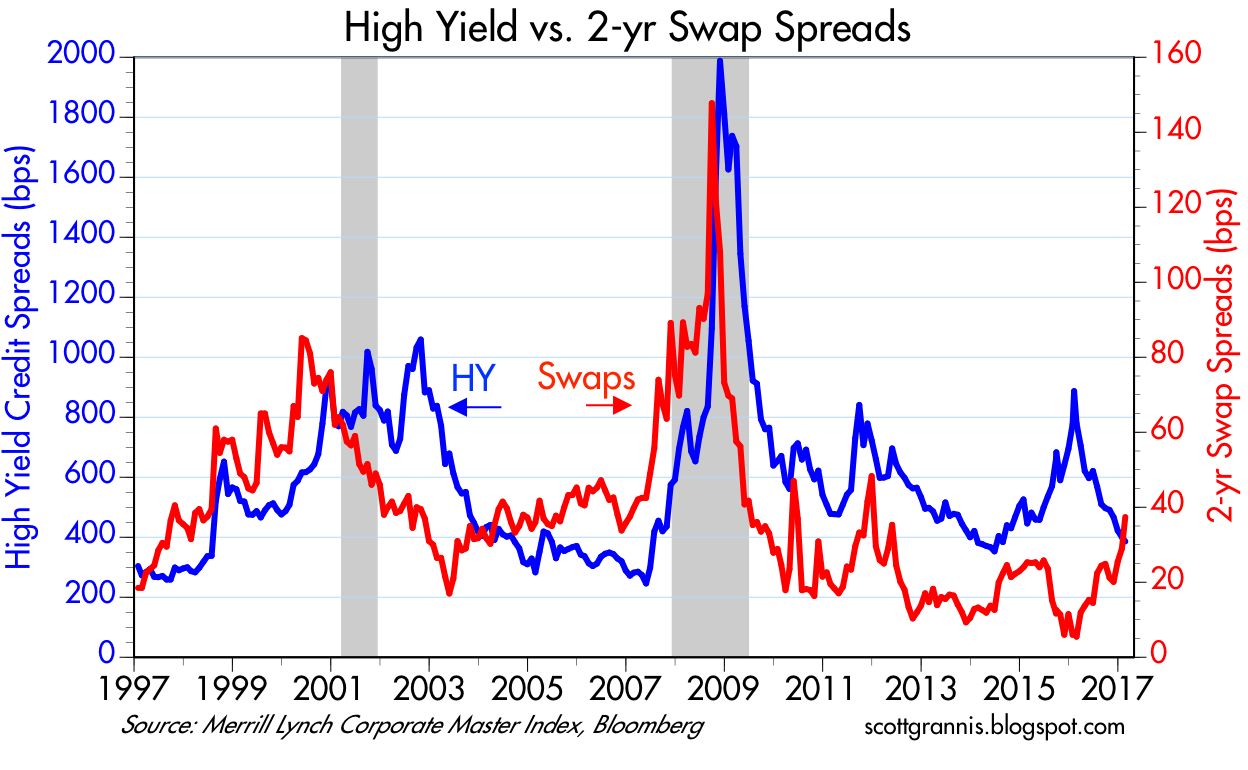
Scott Grannis also pointed out that the 2-year swap rate is starting to rise, indicating higher stress levels. Again, these are not panic levels, but this is another warning sign of declining risk appetite.
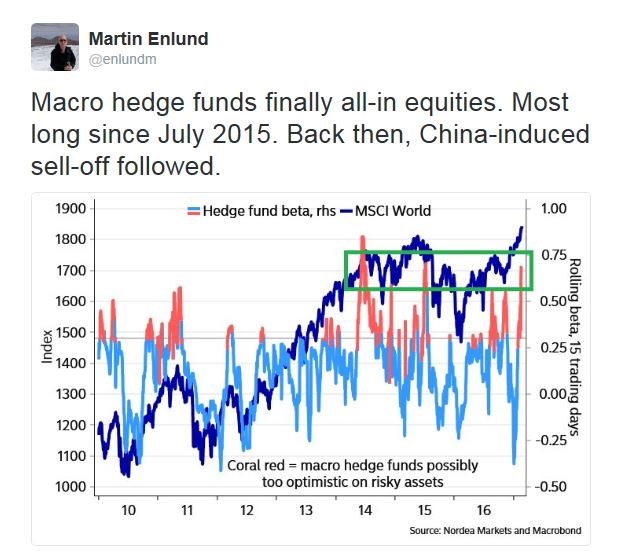
What’s more, global macro hedge funds are all-in on their risk exposure.
Bloomberg reported that analysis by Novus Partners showed that equity holdings favored by hedge funds are showing low levels of liquidity. So what happens if we get a “volatility event” and they all try to head for the exit?
Is it any wonder why demand for tail-risk protection is rising?
Estimating downside risk
I believe that the prudent course of action for investors would be to prepare for some near-term equity weakness. In that case, the question the becomes, “What’s the downside risk?”
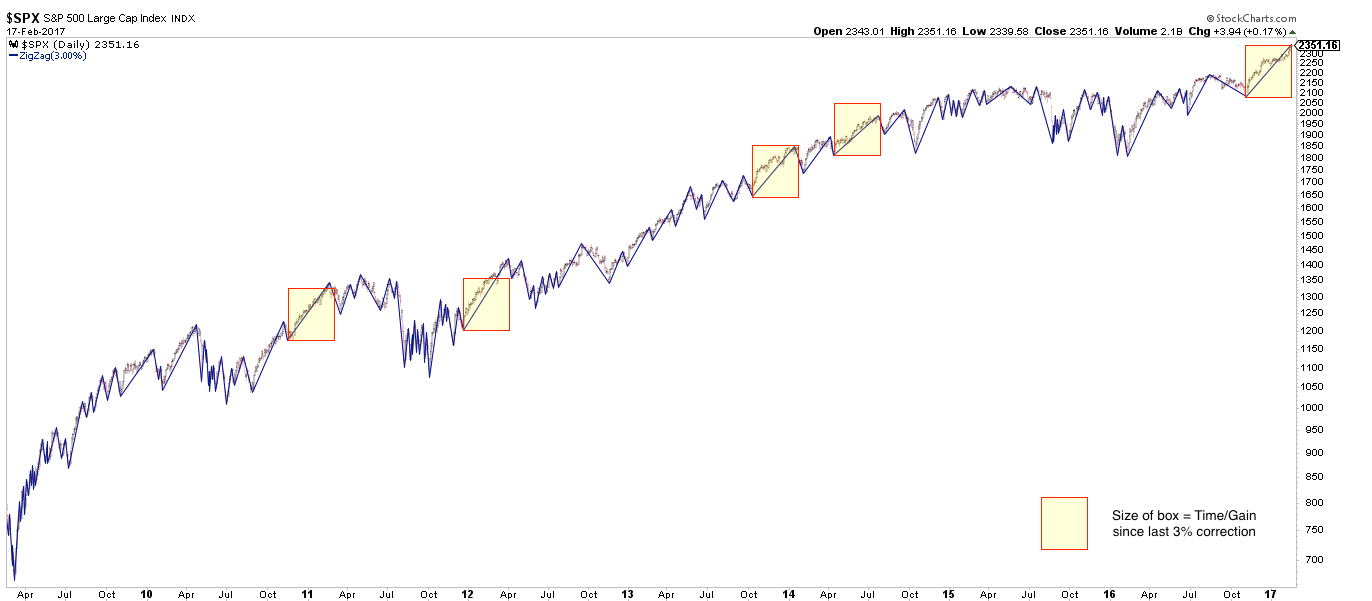
I offer a number of scenarios to answer that question. Urban Carmel pointed out that, from a technical perspective, the stock market has exhibited a period of strong positive momentum. Such episodes tend to resolve themselves with only minor pullbacks before powering higher:
When the current uptrend ends, it is not likely to lead directly into a more significant downturn. Momentum like this weakens before it reverses. In each of the cases highlighted above, after a 3-5% drawdown, SPX either continued higher or retested the prior high before falling lower. Mid-2011, 2012 and 2014 are recent examples of the latter case (shown below). That would be our expectation now as well.
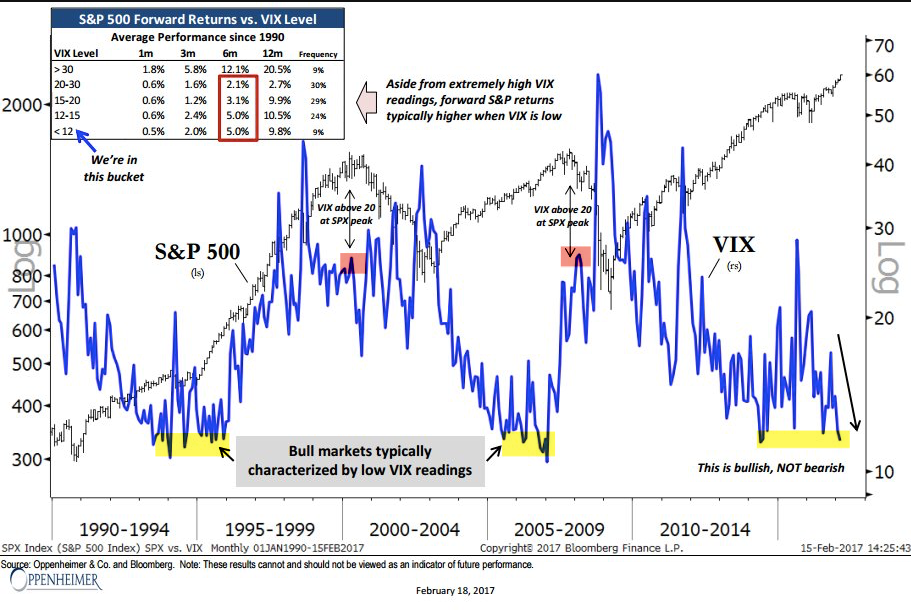
He also highlighted research from Ari Wald, indicating that low VIX levels tend to be bullish market environments, not bearish:
Much has been made of the persistently low level of the Vix. The three most recent bull markets have each been characterized by a persistently low Vix. Historical instances are severely limited, but a low Vix has been a positive sign for the SPX. The market did not peak in either 2000 or 2007 until Vix had climbed, over the course of years, to more than 25. Since 1990, when the Vix has been below 12, SPX has returned 5% and 10% over the next 6 and 12 months, respectively (from Ari Wald).
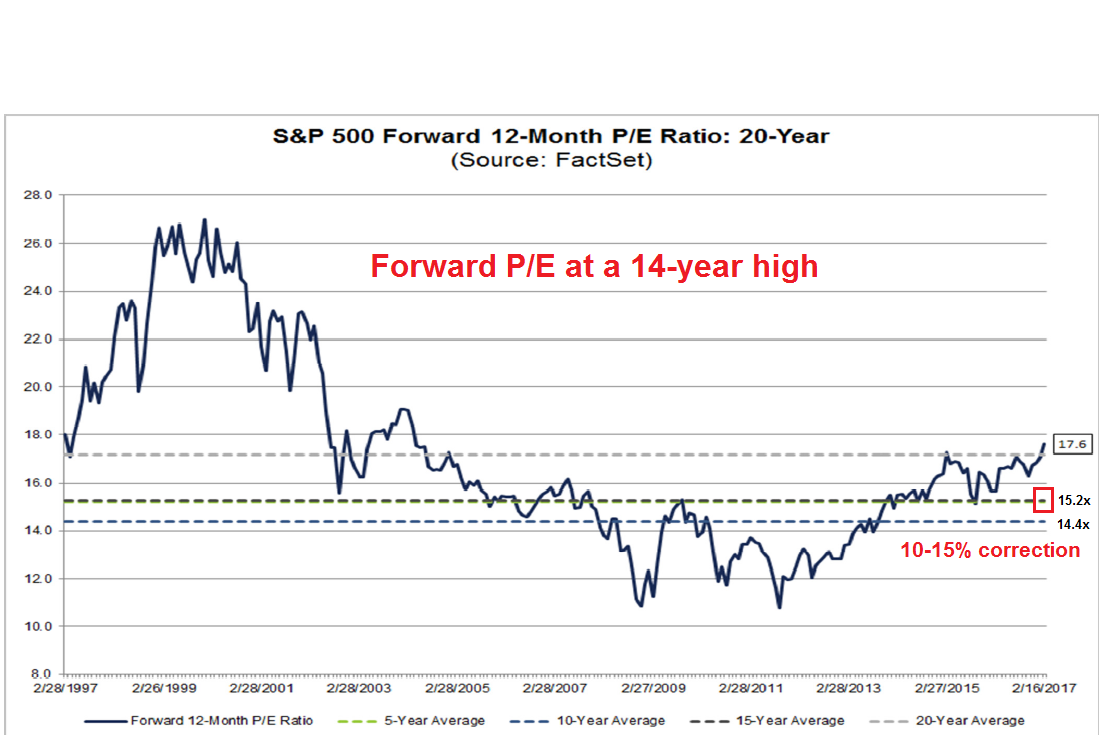
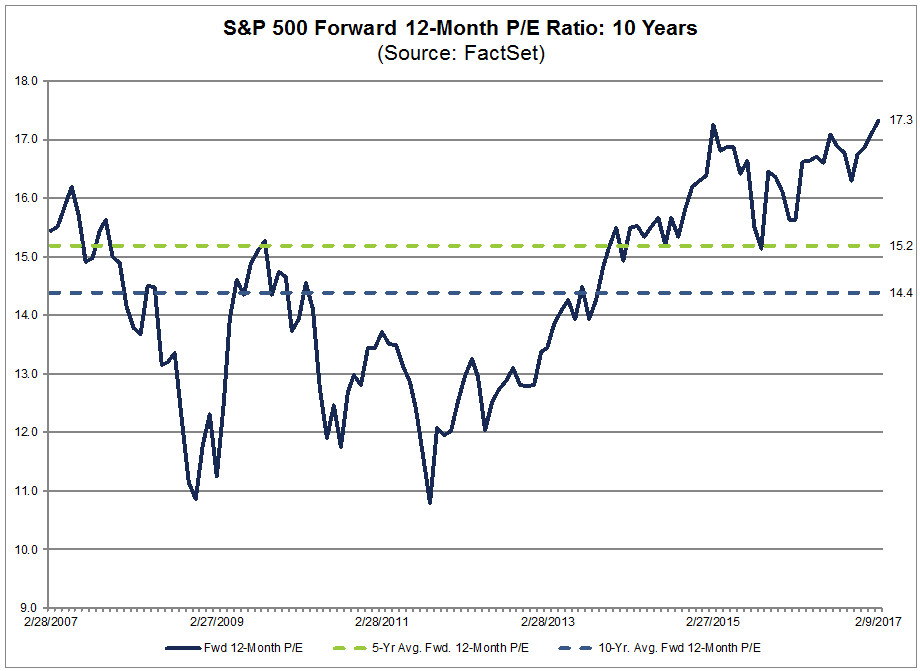
The fundamental answer to the downside risk question depends on how the tax reform measures get resolved. If the tax cuts were to be delayed until next year, then forward P/E ratios may have to adjust downwards. Analysis from Factset shows the forward P/E ratio at 17.6, a 14-year high. Forward P/E is well above its 5-year average of of 15.2 and 10-year average of 14.4. If the global reflation story were to remain intact, a 10-15% retreat in prices would represent a valuation floor for equity risk. I would add, however, that 10-15% represents the probable maximum downside potential, but any pullback could stop well short of that estimate.
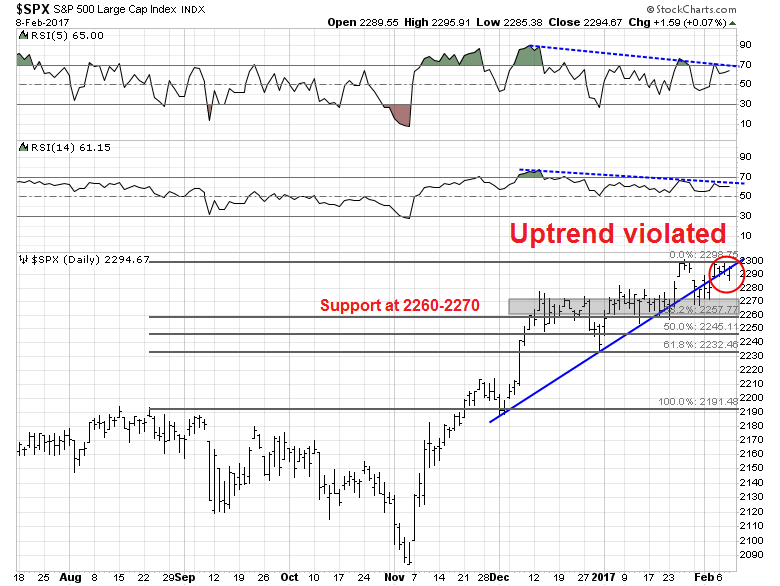
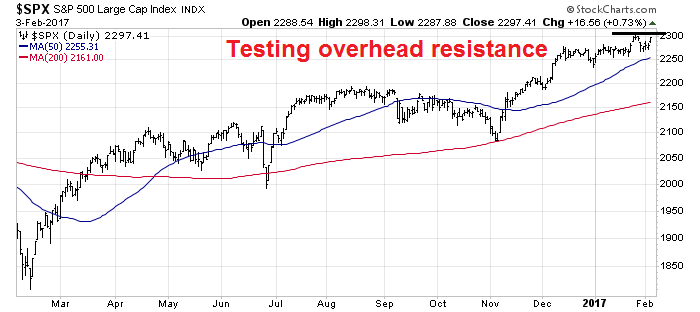
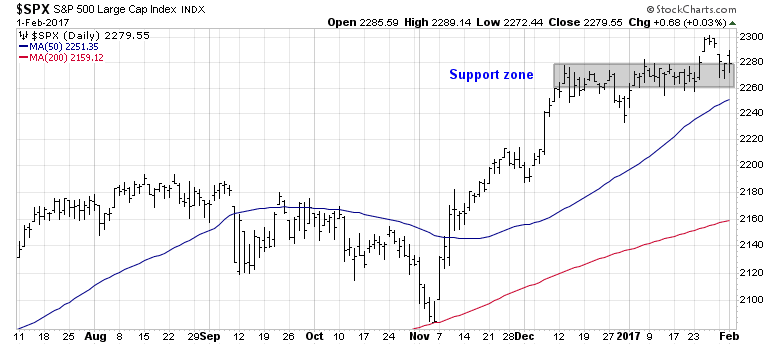
Confused? The following SPX chart offers some technical perspective. There is initial support at about the 2280 breakout point, which roughly coincides with the 50 day moving average (dma). Secondary support is at 2190, which also coincides with the 200 dma. If those support levels break, then long-term support can be found at 2135, which corresponds to about a 10% pullback. Viewed view a technical prism, a 10-15% pullback seems unlikely, unless total panic were to set in.
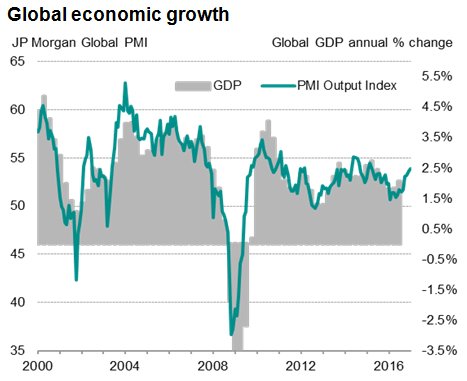
If, on the other hand, tax reforms were to pass with a BAT, then it could signal the start of a major bear market. As the chart below shows, global PMIs are closely correlated with global trade. Both have been rising strongly. Imagine the global macro conditions and growth outlook if trade flows were to tank. Earnings estimates would also fall, and would likely spark a major bear market, tax.
The week ahead: Waiting for the bearish break
Looking to the week ahead, my inner trader continues to wait for the break in the equity market uptrend. While many technical and sentiment indicators are in the bearish zone, there is no obvious bearish trigger.
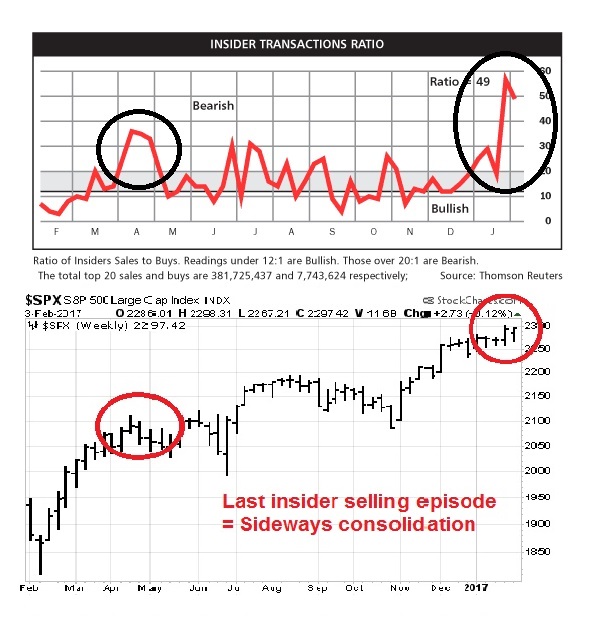
The latest update from Barron’s shows that insiders have resumed their heavy selling.
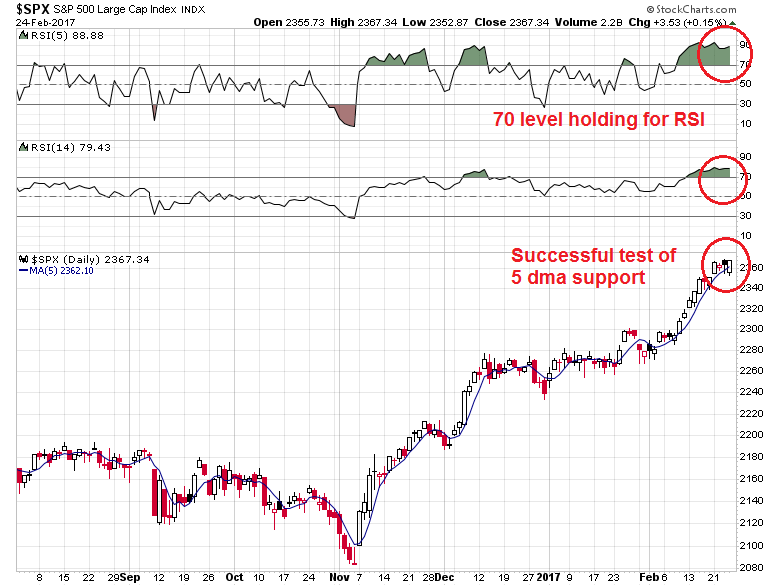
While these technical indicators are supportive of the near-term bear case, we haven’t seen technical breaks of the uptrend that marks a bearish break. Neither the SPX has fallen below its 5 day moving average, nor has its RSI-5 or RSI-14 have declined below the overbought reading of 70.
My inner investor remains constructive on stocks. He is not worried about 5-10% price squiggles when he invests in equities. On the other hand, he will take action to de-risk his portfolio should the more dire scenario of a trade war come to pass.
My inner trader remains in cash. He is still waiting for a technical break before he shorts the market.
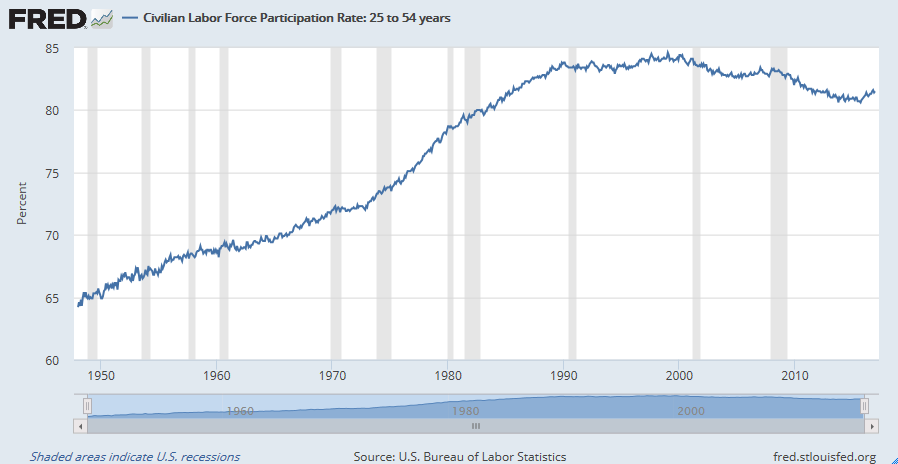
There has been much hand wringing by economists over the falling labor force participation rate (LFPR). As the chart below shows, the prime age LFPR, which is not affected by the age demographic effect of retiring Baby Boomers, have not recovered to levels before the Great Recession.
The lack of recovery in LFPR has caused great consternation over at the Federal Reserve. These readings suggest that there is still considerable slack in the labor market, despite the sub 5% unemployment rate.
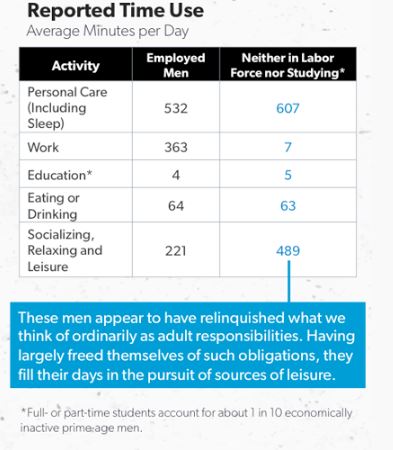
A number of explanations have been advanced for this phenomena, such as jobless Millennials spending all their time playing video games in their parents’ basement instead of looking for a job (via Nicholas Eberstadt of the American Enterprise Institute).
Another possible explanation is the growth of disability as a shield against unemployment payments run out. As the Great Recession hit, disabled workers became discouraged and chose to rely on their disability payments instead of trying to find another job.
There may be another very simple alternative explanation for the collapse in LFPR. The answer is so simple, it’s criminal that anyone missed it.
It’s criminal!
Nicholas Eberstadt of AEI, who advanced the theory of the lazy Millennials, suggested an very simple explanation. The explosion in the incarceration rate in the United States has rendered a segment of the population virtually unemployable, which consequently depressed LFPR (via Bloomberg):
A single variable — having a criminal record — is a key missing piece in explaining why work rates and LFPRs [labor-force participation rates] have collapsed much more dramatically in America than other affluent Western societies over the past two generations. This single variable also helps explain why the collapse has been so much greater for American men than women and why it has been so much more dramatic for African American men and men with low educational attainment than for other prime-age men in the United States.
The idea has some merit. Consider that the US has the highest incarceration rate of the major countries in the world, beating the likes of Russia, South Africa, and other industrialized countries (via Wikipedia):
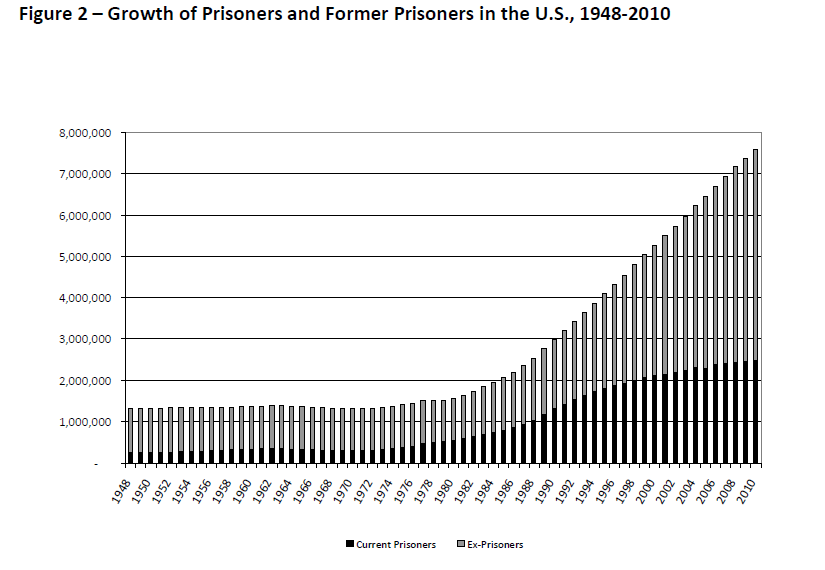
Prison and jail populations have exploded over the years (via Wikipedia).
The problem isn’t just the number of people in prison and jail, but what happens to them when they are released. Research from the Sentencing Project found that 60% of former inmates could not find work a year after release.
That’s just people with criminal records. What if you were arrested but never convicted. The WSJ reports that the proliferation of private databases have created employment barriers for people with arrest records. These are people who were arrested, but not convicted. It could be something as simple as a misdemeanor offense, or a case of mistaken identity.
When Precious Daniels learned that the Census Bureau was looking for temporary workers, she thought she would make an ideal candidate. The lifelong Detroit resident and veteran health-care worker knew the people in the community. She had studied psychology at a local college.
Days after she applied for the job in 2010, she received a letter indicating a routine background check had turned up a red flag.
In November of 2009, Ms. Daniels had participated in a protest against Blue Cross Blue Shield of Michigan as the health-care law was being debated. Arrested with others for disorderly conduct, she was released on $50 bail and the misdemeanor charge was subsequently dropped. Ms. Daniels didn’t anticipate any further problems.
But her job application brought the matter back to life. For the application to proceed, the Census bureau informed her she would need to submit fingerprints and gave her 30 days to obtain court documents proving her case had been resolved without a conviction.
Clearing her name was easier said than done. “From what I was told by the courthouse, they didn’t have a record,” says Ms. Daniels, now 39 years old. She didn’t get the job. Court officials didn’t respond to requests for comment.
Could something like this happen to you?
Estimating the “criminal class” effect
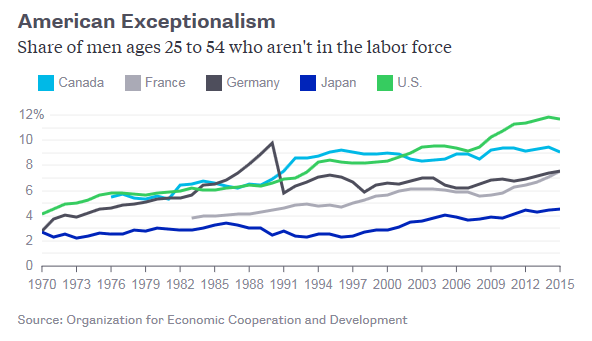
I have a couple of rough ways of estimating the “criminal class” effect on the LFPR. Using top-down data, the chart below from Bloomberg shows the differences between the “not in labor force” rate (NILF) between the US and other major industrialized countries. The latest data (2015) shows a 2.6% spread in NILF rate between the US and Canada. The NILF rates of those two countries last crossed in 2007. Before that, they crossed in 2001.
What if the American NILF rate fell to the Canadian rate due to an equalization of incarceration rates? As the chart below shows, if we add back the 2.6% US-Canada NILF spread, the US prime LFPR would jump to 84.1% (red dot), which is above the rate seen before the Great Recession, and slightly ahead of 2001 and 2007, when the NILF rates of the two countries last converged (black dots).
Bottom-up estimates
Another way I used to estimate the “criminal class” effect on the LFPR is to ask the question, “What if all former inmates found jobs as easily as the rest of the population?”
To answer this question, I used estimates by the academics Shannon, Uggen, Thompson, Schnittker and Massoglia in the paper “Growth in the US ex-felon and ex-prisoner population, 1948 to 2010“. I took the grey bars in this chart (ex-prisoners) as estimates of the former prisoner population.
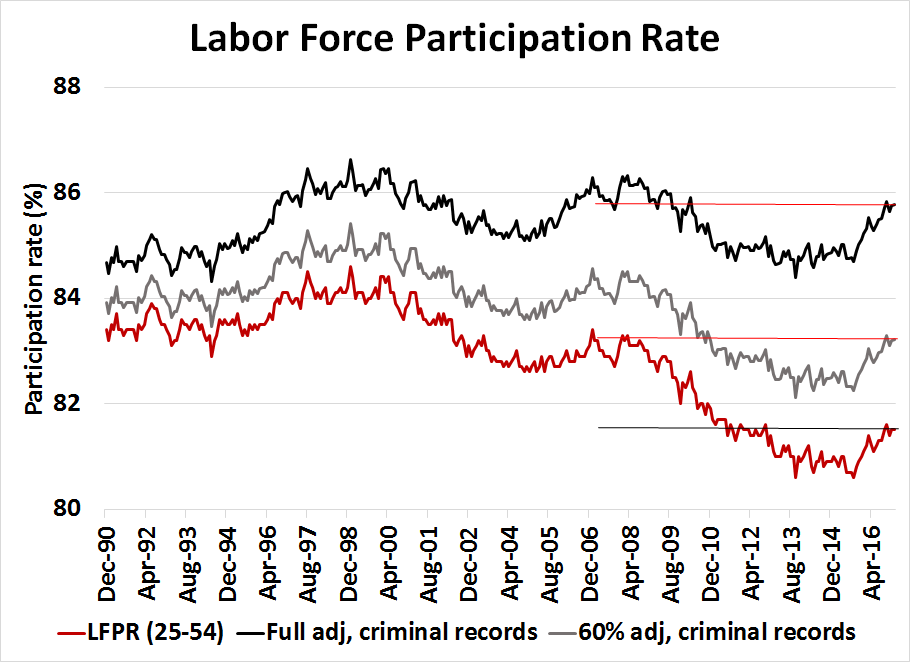
The chart below adjustments to the LFPR, assuming different levels of difficulty for former inmate participation in the labor force. The red line shows the actual prime age LFPR (data from FRED). The black line assumes that all former inmates re-entered the labor force and none were discouraged. The grey line assumes that 60% of former inmates get discouraged and left the labor force (see Sentencing Project analysis above).
Based on this approach, the LFPR would have fully recovered from the Great Recession if we assume a full adjustment for people with criminal records. Assuming a 60% discouragement rate among former inmates, the LFPR has significantly recovered from the Great Recession effects, and the recovery is better than the unadjusted LFPR rate.
A feature, not a bug
I would add that this analysis assumes that there was no employment discouragement effect on people who were arrested but not charged. In reality, this “arrested but not convicted” category undoubtedly also had a depressing effect on the participation rate, as that population would have had sufficient difficulty in finding work that they would be more likely to leave the labor force than the general population.
In conclusion, using two separate approaches, I estimate that the surge in incarceration rate in the United States in the last couple of decades has dramatically affected labor force dynamics. The plunge in labor force participation rate is an unintended consequence of the country`s law-and-order focus. In other words, falling LFPR is a feature of past policy, not a bug.
As a result, the economy is likely far closer to full employment than standard unfiltered statistics, which has bullish implications for cost-push inflation. The slightly more hawkish tone of the latest FOMC minutes should therefore be taken as a welcome sign that the Fed will not fall behind the inflation fighting curve:
Many participants expressed the view that it might be appropriate to raise the federal funds rate again fairly soon if incoming information on the labor market and inflation was in line with or stronger than their current expectations or if the risks of overshooting the committee’s maximum-employment and inflation objectives increased.
Based on the results of this study, it could be argued that monetary policy should be on an even hawkish trajectory than three hikes in 2017.
Mid-week market update: Markets behave different at tops and bottoms. Bottoms are often V-shaped and reflect panic. Tops are usually slower to develop. Hence the trader’s adage, “Take the stairs up, and escalator down.”
I have been writing that the US equity market appears to be extended short-term and ripe for a pullback, but that was last week and about 1% lower (see Why the S&P 500 won’t get to 2400 (in this rally)). I stand by those remarks.
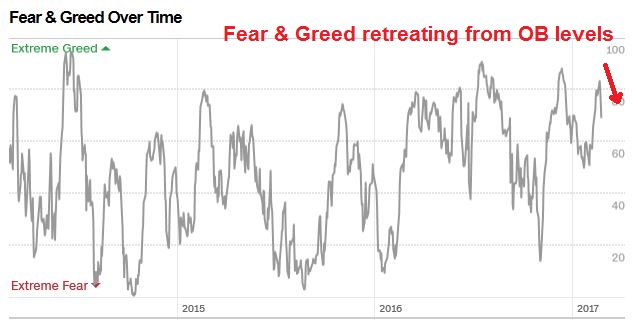
I could say that the Fear and Greed Index appears to be extended and historically stock prices have had difficulty advancing further with readings at these levels.
I could also say that Ned Davis Research Crowd Sentiment Poll is also extended. Historically, stock prices have exhibited a negative bias at these levels (via Tiho Brkan).
None of this matters much to short-term traders. That’s because sentiment and overbought/oversold indicators are less useful at tops than bottoms. While it may be timely for traders to tilt to the long side when panic starts to appear, market euphoria are not good trading signals of market tops. Savvy traders know to wait for a bearish break when the market gets overbought and giddy.
I am seeing some limited signs of a bearish break, but the trading sell signal is incomplete.
CBOE put/call sell signal
I recently highlighted the euphoric condition where the CBOE equity-only put/call ratio (CPCE) had fallen to below 0.60 for four consecutive days. A study showed that such overbought conditions resulted in subpar returns, but they were still positive.
The same study showed that when the market becomes overbought and mean reverts, CPCE rises above 0.60, forward returns tend to far more negative. That`s the bearish break that traders should be waiting for.
The signal appeared as of Tuesday’s close, when CPCE rose to 0.61 and Wednesday’s preliminary equity put/call ratio came in at 0.82. Those are sell signals.
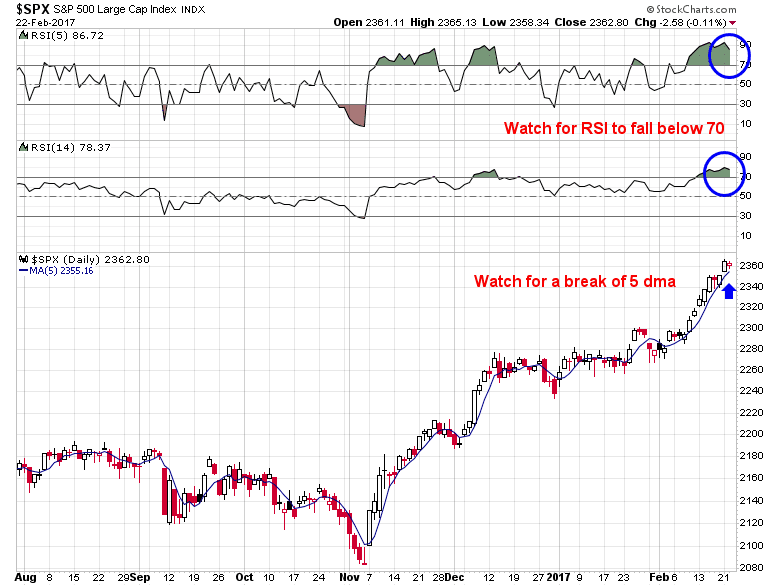
Still waiting for other breaks
While the CPCE sell signal is encouraging for the bears, other short-term technical indicators have not flashed signals for my inner trader to commit funds to the short side. I am waiting for the SPX to fall below its 5 day moving average, which currently stands at about 2355. In addition, I am waiting for RSI-5 and RSI-14 to decline below 70 as signs of faltering momentum.
I would add that my cautiousness is tactical. Any pullback should be regarded as a correction within an uptrend unless proven otherwise.
My inner investor remains bullishly positioned. My inner trader is in cash, but he is waiting for a technical break to go short.
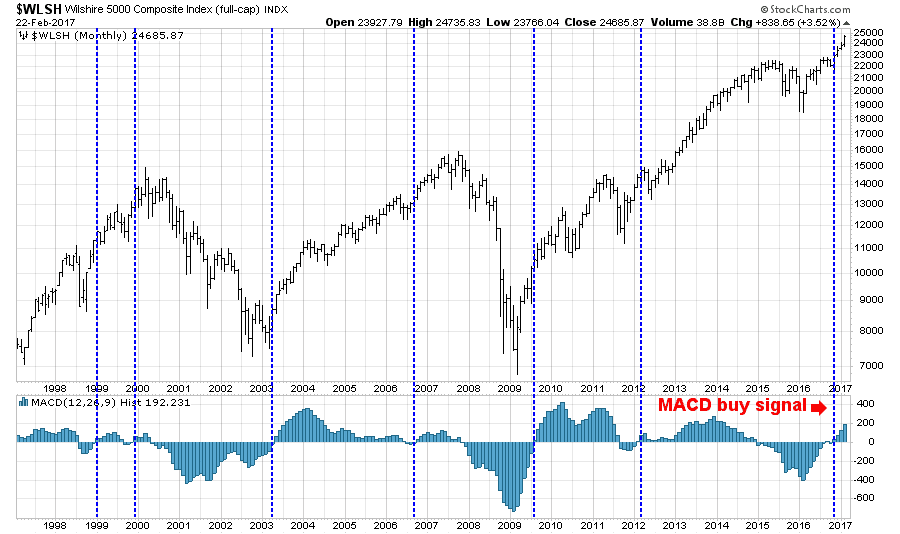
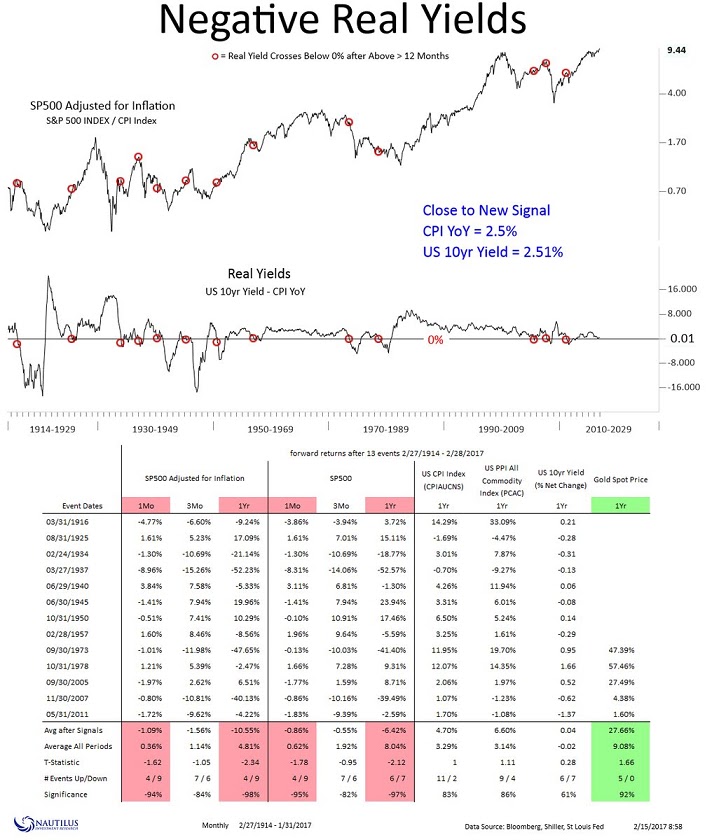
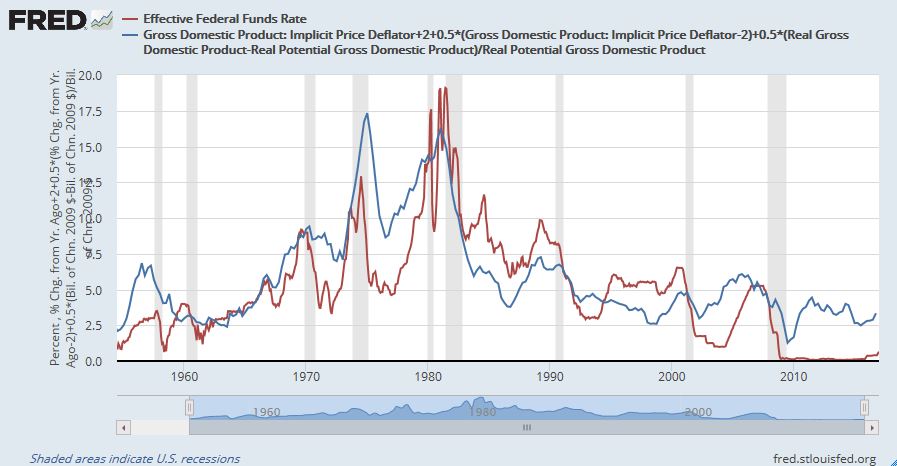
A reader asked me my opinion about this tweet by Nautilus Research. According to this study, equities have performed poorly once the inflation-adjusted 10-year Treasury yield turns negative. With real yields barely positive today, Nautilus went on to ask rhetorically if the Fed is behind the inflation fighting curve.
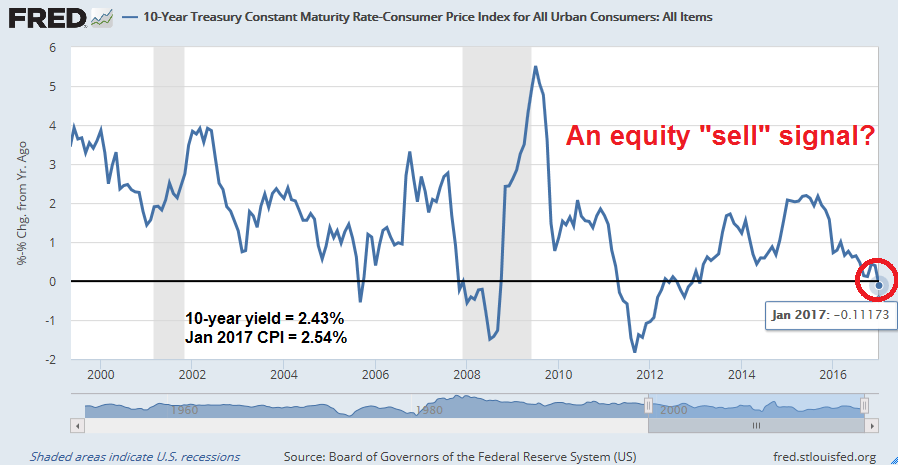
Since the publication of that study, The January YoY CPI came in at 2.5%, which was surprisingly high. The higher than expected inflation rate pushed the 10-year real yield into negative territory. So is this a sell signal for equities?
Well, it depends. The interpretation of investment models often depends a great deal on their inputs. In this case, the questions is how does we adjust for inflation? Do we use the headline Consumer Price Index (CPI), core CPI, which is CPI excluding volatile food and energy prices, or some other measure?
As I go on to show, how we adjust for inflation dramatically alters the investment conclusion for a variety of asset classes, like equities, gold, and the USD.
As is the case in the application any quantitative model, the devil is in the details.
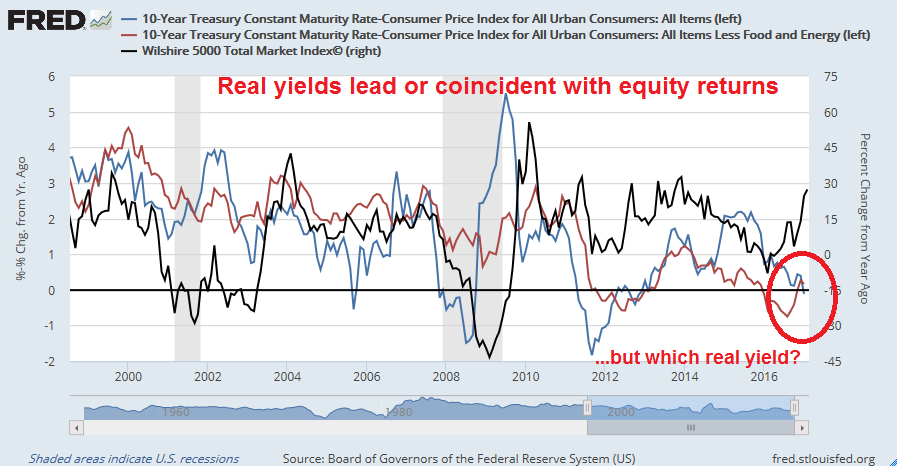
Real yields and equity returns
Consider the evidence. As the FRED chart below shows, history shows real yields indeed either lead or are coincidental with equity returns. If we adjust for 10-year Treasury with headline CPI, the outlook is equity bearish. On the other hand, adjusting with core CPI leads to a bullish conclusion.
Which inflation measure should we use?
Real yields and the USD
There is a more direct empirical relationship between real yields and the level of the US Dollar. As real yields rise, it puts upward pressure on the USD. So which inflation rate should we use?
Real yields and gold
Historically, the price of gold has been inversely correlated with the USD. Since gold is thought of as an inflation hedge, it is therefore no surprise that low real yields are gold bullish and high real yields are bearish (note the inverse scale for the gold price, right axis).
Our intermediate term outlook for these asset classes therefore crucially depend on the correct interpretation of the inflation adjustment factor. Do we use headline CPI, or the less volatile core CPI?
A “hot” CPI print
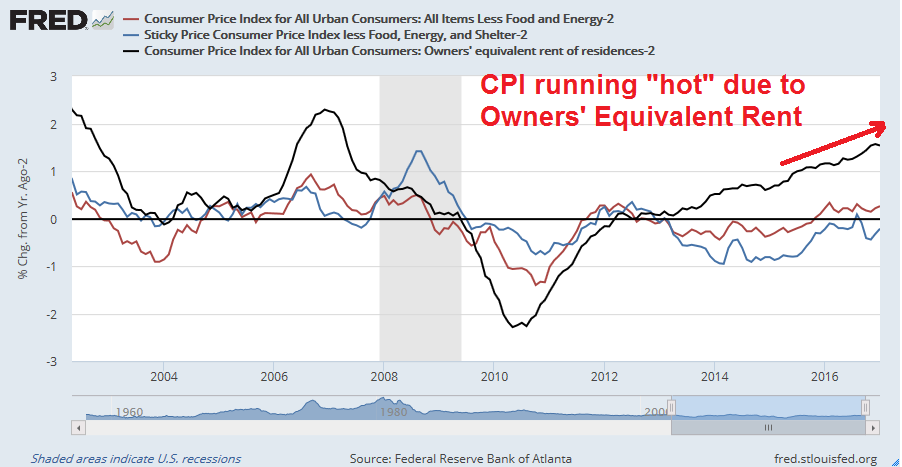
The CPI print last week came in ahead of expectations. YoY CPI was 2.5% (vs. 2.4% expected), and core CPI was 2.3% (vs. 2.1% expected). As I showed in my previous post (see Watch what they do, not just what they say), most of the strength in CPI was attributable to rising Owners’ Equivalent Rent (OER), which comprises of 25% of the weight of CPI and 31% of core CPI, according to the latest BLS figures. (Note that the chart subtracts 2% from each CPI metric so that we can easily see whether each is above or below the Fed’s 2% inflation target.)
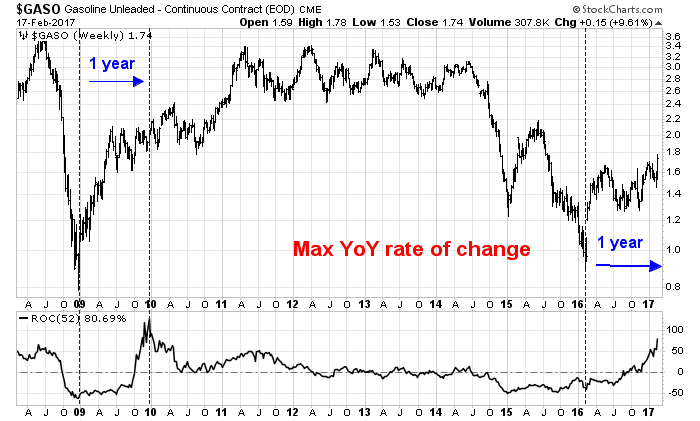
Much of the recent boost to headline CPI compared to core CPI is attributable to surging gasoline prices. As the chart below shows, YoY gasoline prices are due to peak and headline inflation should start to moderate in the months ahead.
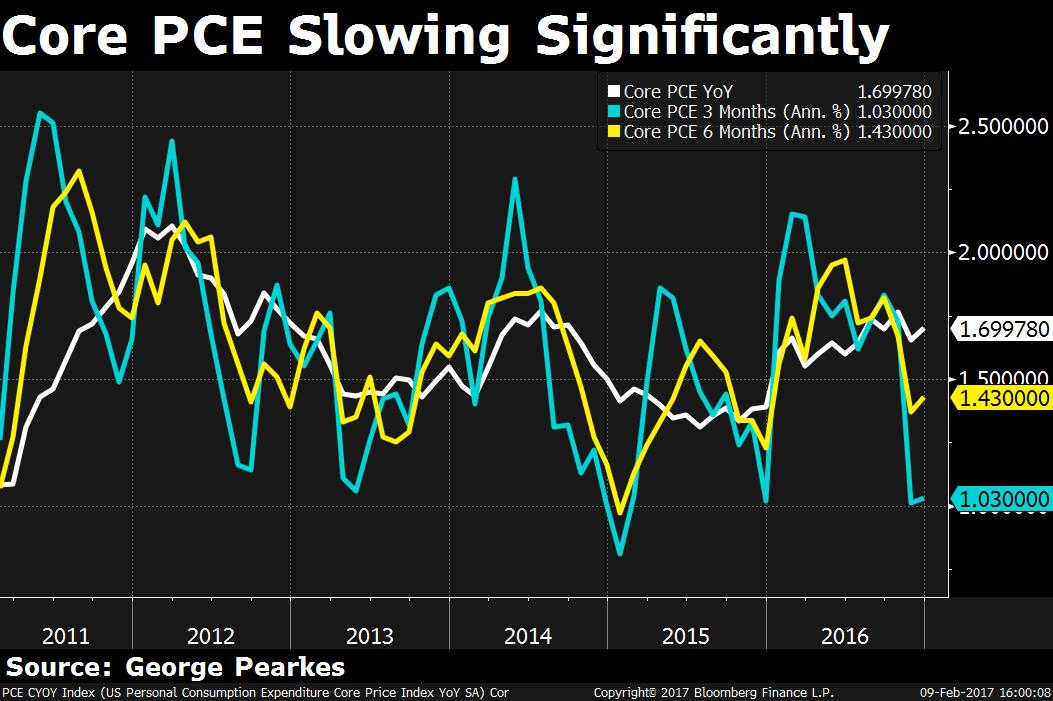
After dissecting the components of CPI, my conclusion is that inflation remains tame after stripping out the more volatile components and OER, which can be ignored for the purposes of this analysis. I have also highlighted past analysis from George Pearkes that core PCE, which is the Fed’s preferred inflation metric, has been slowing.
In conclusion, investors shouldn’t panic about negative real yields based on an erroneous interpretation of inflation. Unless conditions change dramatically, the intermediate term outlook for the USD and equities is bullish. Conversely, gold bulls will face headwinds from positive real yields.
Preface: Explaining our market timing models
We maintain several market timing models, each with differing time horizons. The “Ultimate Market Timing Model” is a long-term market timing model based on the research outlined in our post, Building the ultimate market timing model. This model tends to generate only a handful of signals each decade.
The Trend Model is an asset allocation model which applies trend following principles based on the inputs of global stock and commodity price. This model has a shorter time horizon and tends to turn over about 4-6 times a year. In essence, it seeks to answer the question, “Is the trend in the global economy expansion (bullish) or contraction (bearish)?”
My inner trader uses the trading component of the Trend Model to look for changes in the direction of the main Trend Model signal. A bullish Trend Model signal that gets less bullish is a trading “sell” signal. Conversely, a bearish Trend Model signal that gets less bearish is a trading “buy” signal. The history of actual out-of-sample (not backtested) signals of the trading model are shown by the arrows in the chart below. Past trading of the trading model has shown turnover rates of about 200% per month.
The latest signals of each model are as follows:
Ultimate market timing model: Buy equities
Trend Model signal: Risk-on
Trading model: Bearish
Update schedule: I generally update model readings on my site on weekends and tweet mid-week observations at @humblestudent. Subscribers will also receive email notices of any changes in my trading portfolio.
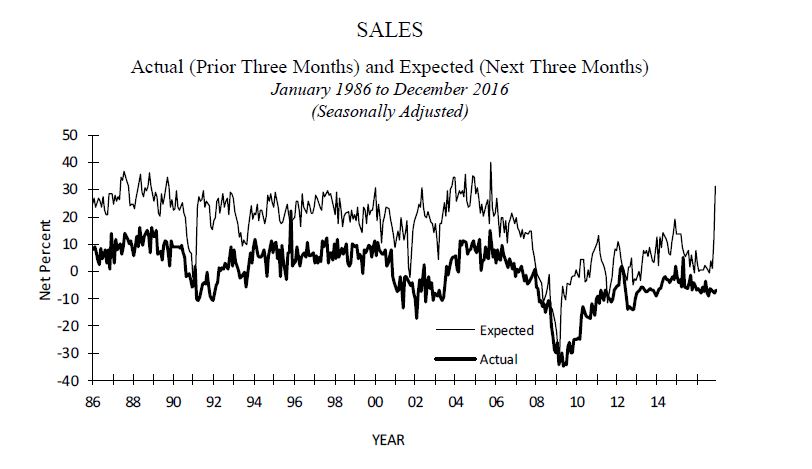
Great expectations
Bloomberg recently highlighted the huge gap between expectations and reality. As the chart below shows, soft (expectations) data has been surging, but hard (actual) data has risen, but it has not caught up with expectations.
The markets are pricing for perfection, which sets up a situation where minor disappointments could spark a market sell-off. BCA Research found that such divergences between “soft” expectations data and “hard” economic data has seen equity corrections in the past.
This week, I examine the details of how expectations have diverged from actual data on a number of dimensions.
Small business confidence
Corporate confidence
Consumer confidence
Federal reserve expectations
Wall Street’s tax reform expectations
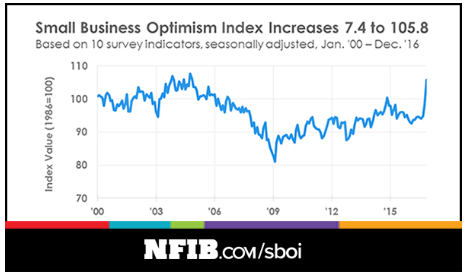
Small business euphoria
Last week`s release of the NFIB January small business confidence survey showed another upside surprise. Small business optimism continued to surge and rose to multi-year highs. As small business owners tend to be small-c conservatives who tend to tilt Republican, the election of Donald Trump has undoubtedly sparked a resurgence in business optimism.
However, the outpouring of optimism has not been matched by actual sales results. Even though sales ticked up last month, their rise lagged expectations. Since 1974, there have been five other episodes where expectations have surged. In two of those cases, sales rose to match expectations; in two others, they did not; and in 2009-10, sales saw eventually rose, but the surge was delayed by about a year (chart annotations are mine).
Small business capital expenditure plans have been relatively muted despite the surge in small business optimism.
One reason for the cautiousness could be attributable to rising labor costs. While labor costs have risen, business owners have not been able to raise prices to pass through higher compensation rates, which results in a margin squeeze.
I am keeping an open mind as to whether small business optimism will translate into more hiring and capital expenditures. But watch what small business owners do, not just what they say.
Corporate optimism
It’s not just the mood of small business owners that has become more upbeat. A simple word count of the word “optimistic” in earnings calls has surged to all-time highs.
But if management is so optimistic, then why have insiders been selling so much of their company’s shares (via Barron’s)?
Watch what corporate insiders do, not just what they say.
Can the consumer MAGA?
If Donald Trump is to Make America Great Again, then one of the key ingredients is strength in consumer spending. As the chart below shows, the US economy is seeing a divergence between rising consumer confidence (black line) and real wage growth (blue line). How can the consumer spend when real wages are stagnant? More worrisome is the observation that falling real wages have been precursors to recessions in the past, not booms.
Even though January retail sales rose and beat expectations, consumer spending is likely to disappoint in the short-term. That’s because after adjusting for inflation, real retail sales actually fell from December to January. In addition, Bloomberg reported that this year’s IRS anti-fraud tax refund procedural changes are delaying the timing of refund payments. This is likely to depress current consumer spending and push it out by several months.
New Deal democrat is becoming concerned. He wrote about the ways consumers cope if real wages don’t grow. When the consumer runs out of coping mechanisms, the economy slides into recession:
The theory is that if real average wages are not increasing, which for a long time beginning in the 1970s they were not, average Americans use a variety of coping mechanisms. From the 1970s through the mid-1990s, spouses entered the workforce, adding to total household income. Other methods have included borrowing against appreciating assets, and refinancing as interest rates declined.
Borrowing against stock prices ended in 2000. Borrowing against home equity ended in 2006. When interest rates failed to make new lows, the consumer was tapped out, and began to curtail purchases. Thus in September 2007, with the stock market peaking, house prices falling, interest rates having not made new lows in over 3 years, and real wage growth having stalled, I wrote that a recession was about to begin: http://www.dailykos.com/story/2007/09/25/389903/-Why-American-consumers-are-signaling-recession
So far, mortgage rates have not made a new low for quite some time, so forget housing prices as an ATM to fuel consumer spending. Another way of maintaining consumer spending is to reduce savings. The savings rate is dropping, but it is not at levels that have signaled recessionary conditions in the past. As major stock indices reach all-time highs, another way of coping is by taking profits on their stock portfolios , but only a small minority of households are invested in the equity market.
NDD concluded:
So the consumer fundamentals nowcast indicates that the expansion should continue for awhile, but if inflation eats up wage gains and the savings rate this year, then all we will need for the consumer to signal a recession is for asset prices to peak. I do not think that will happen until at least next year.
Don’t panic just yet, but risks are rising. Watch what the consumers do, not just what they say.
A hawkish Fed
What’s going on at the Fed? George Pearkes recently observed core PCE, the Fed’s preferred inflation metric, has been slowing.
So why did Janet Yellen take on a decidedly more hawkish tone in her Congressional testimony last week? In fact, the WSJ reported that Fed officials have fanned out across the country to reinforce the message that to expect three rate hikes in 2017, which is more hawkish than the market expectations.
To be sure, the Consumer Price Index (CPI) came in a bit “hot”, or ahead of expectations, both in the headline number and core CPI. But as the chart below shows, much of the increase can be attributable to Owners’ Equivalent Rent (OER). Core sticky price CPI, ex-OER has remained below the Fed’s 2% target (note I have subtracted 2% from all CPI figures in order to better graphically show how far different inflation metrics are from the Fed’s 2% target).
What’s going on? What is the Fed seeing that the rest of us don’t see? Is the Fed reacting in anticipation of the Trump administration’s fiscal stimulus plan? Sure that can’t be the case. Ben Bernanke recently penned a thoughtful essay about the FOMC’s decision making process. He indicated that Fed officials focus on the medium term outlook. While the effects of fiscal policy plays a part in the Fed’s deliberations, they tend to take a wait-and-see attitude to see the full details of the legislative proposals before modeling the effects.
Watch what the Fed does, not just what they say.
Where’s my tax cut?
Over on Wall Street, they are still waiting for Trump’s “tremendous tax plan”, which will probably get unveiled in Trump’s joint address to Congress on February 28, 2017. Equity markets have rallied partly in anticipation of Candidate Trump’s tax cut and offshore tax repatriation proposals. It is not clear, however, whether any tax cuts would actually materialize this year, or what kind of bitter pill the economy would have to swallow in order for the tax cuts to get passed.
So far, it seems that the only way that Trump can pay for his proposed tax cut would be through the imposition of a border adjustment tax (BAT). Without a BAT, the Trump tax cuts could cost up to $7 trillion, according to the Tax Policy Center (via CNN Money). Bloomberg reported that the latest tax reform proposal has been stalled in Senate because a lack of Republican support:
Not long after House Speaker Paul Ryan offered a full-throated affirmation of his tax-overhaul plan, an influential conservative group announced a grassroots campaign against it and a Senate leader said a key part of the proposal is “on life support.”
Senate Majority Whip John Cornyn was diagnosing Ryan’s plan to replace the U.S. corporate income tax with a new, “border-adjusted” levy on U.S. companies’ domestic sales and imports. The proposal has stirred sharp divisions among businesses: Retailers, automakers and oil refiners that rely on imported goods and materials oppose it, while export-heavy manufacturers support it.
So far, the opponents are winning, interviews with lawmakers, lobbyists and tax specialists show. As Congress prepares to depart Washington for a one-week break, Cornyn said he didn’t see the votes lining up for the House leaders’ plan.
Even if a BAT were to pass, I highlighted analysis by Barclay’s last week (via Sam Ro) showing the net effects of a tax reform package. The sheet size of the BAT would, by necessity, be extremely protectionist and such an initiative would invite a debilitating global trade war.
Here is what’s at stake for equity investors. John Butters from Factset pointed out that the market’s forward P/E of 17.6 is at levels last seen in 2004, a 13-year high. Investors would have to include the dot-com bubble era to make the case that the current forward P/E looks reasonable on a historical basis. In short, market expectations for tax cuts and offshore cash repatriation are extremely high and prone to disappointment.
Watch what Trump administration and Congress do, not just what they say.
The week ahead: Be a patient bear
Looking to the week ahead, I don’t want to repeat what I’ve have written over the past week. The points I made in my last post (see Why the SP 500 won’t get to 2400 (in this rally)) still stands. Fundamentals still look wobbly, sentiment remains excessively bullish and short-term technical indicators are flashing overbought readings.
The latest update from Factset shows that forward 12-month EPS stopped falling and rose last week, which is a positive sign for stock prices. But the 2 and 4 weeks rates of change remain negative. In the past, stock prices have struggled whenever forward EPS has been flat to down.
The 10-year weekly SPX chart below illustrates how overbought the market is. I have marked past instances when RSI-5 has risen to similar levels. The red vertical lines when the market has declined, and the blue lines when the market has continued to advance. In the last 10 years, there were six red lines and three blue lines. We now have another overbought signal, play the odds.
On a shorter term time frame, this Index Indicators chart of stocks above their 10 dma is starting to roll over from overbought territory. That’s a classic technical trading sell signal.
As well, these market internals of risk appetite look very iffy.
Tactically, bearish traders may want to be patient. Helene Meisler observed that the CBOE equity only put/call ratio (CPCE) has spent four consecutive days under 0.60. The market is certainly overbought on this metric.
I conducted a study of past episodes, which indicates that such overbought markets don’t necessarily decline. Short term returns have been weak, but still positive.
Returns are tilted to the downside once CPCE mean reverts and breaks up above 0.60.
My inner investor remains bullishly positioned, though he is getting a little nervous. Should the market correct, he will be watching to see the nature of the bearish catalyst before making any further investment decisions.
My inner trader moved to cash a couple of weeks ago and he is standing aside from this market volatility.
Mid-week market update: As the major market averages make new all-time highs, I conducted an informal and unscientific Twitter poll. I was surprised to see how bullish respondents were.
Let’s just cut to the chase – forget it. Neither the fundamental nor the technical backdrop is ready for an advance of that magnitude. Even though the earnings and sales beat rates for Q4 earnings season is roughly in line with historical averages, Factset reports that the 12-month forward EPS growth is stalling. Past episodes has seen stock price struggle to make significant advances under such conditions.
In addition, the technical condition of the market shows that it is vulnerable to a pullback.
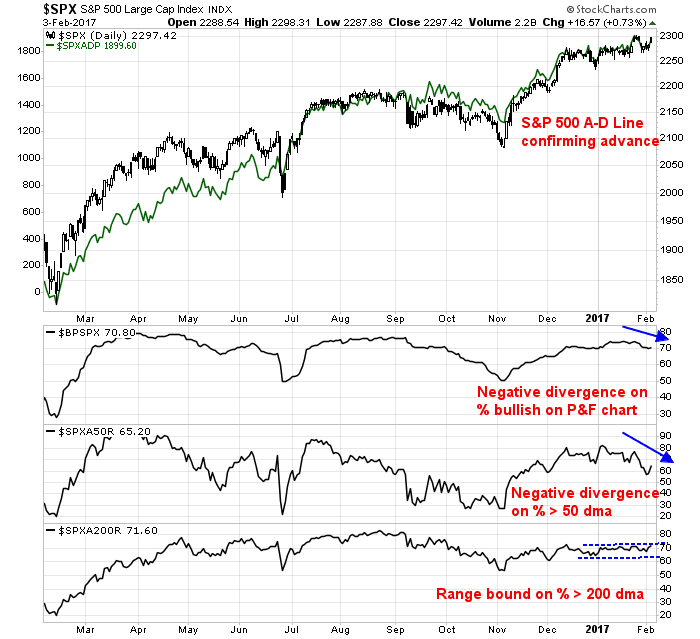
Breadth deterioration
This rally has raised a number of red flags. Schaeffer’s Research pointed out that the advance has been accomplished on deteriorating breadth, as measured by 52-week new highs.
If history is any guide, expect subpar returns pattern for the next couple of weeks.
Independent of the analysis from Schaeffer`s, this chart from Trade Followers shows that bullish Twitter breadth is also not advancing even as the market made new highs, indicating a different form of negative breadth divergence.
Sentiment too bullish
In addition, there are numerous instances of excessively bullish sentiment, which is contrarian bearish. The CNN Money Fear and Greed Index is at a level where stock prices have shown difficulty rising in the past.
The CBOE put/call ratio has fallen to levels that can only be described as giddy. Urban Carmel observed that short-term returns tend to be negative after such readings.
The option market is flashing other anomalous signals. Even as stocks rose today, both the VIX Index rose and the VIX term structure, as measured by the VIX/VXV ratio, flattened. Such behavior by the VIX are normally signs of rising caution. I did a study that went back to November 2007, when data for the VXV was first available. I found 117 non-overlapping similar instances. As the table below shows, historical returns were disappointing for the following week.
Overbought markets
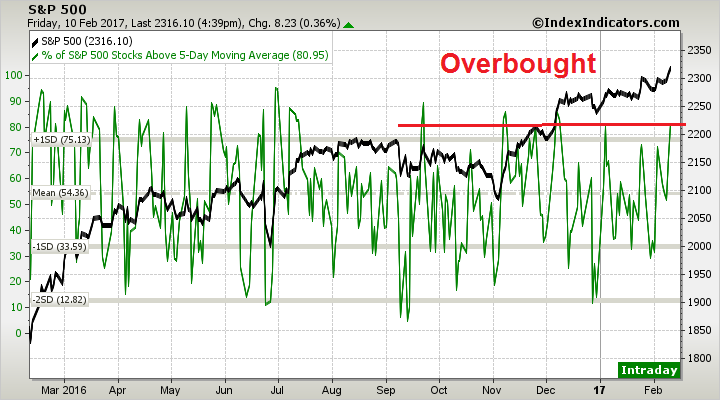
As stock prices have risen, it is no surprise that most overbought/oversold models are showing overbought readings. Consider, for example, this chart from Index Indicators of the 5-day RSI above 70, which is a short-term (1-2 day) trading model
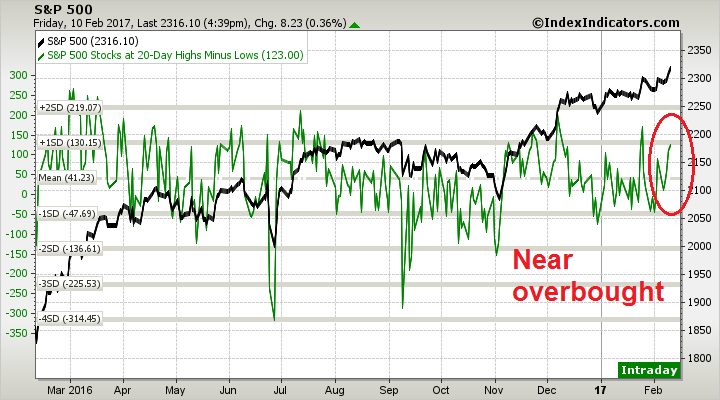
This chart of net stocks at 20 day highs-lows, which is a model with a longer term (1-2 week) time horizon, is also in overbought territory.
Overbought readings like those are to be expected as the market advances. There is nothing that says overbought markets can’t stay overbought. However, an alert reading sent me the following chart, which showed that the NASDAQ 100 is reaching overbought levels not seen since 1999, which was the top of the Tech Bubble.
Don’t get too bearish
Despite the combination of overbought and excessively bullish sentiment readings, my inner trader is not wildly bearish. Anecdotal evidence from independent sources of discussions with investment managers indicate that there is a lot of nervousness beneath the surface. This suggests to me that while stock prices may pull back in the near-term, any correction is likely to be shallow and should be bought.
Be cautious, but don’t go overboard on your short positions. My inner trader remains in cash and he is inclined to stay on the sidelines, for now.
The WSJ reported that the Trump administration is considering a new tactic in managing its trade relationship with China. Here is the Bloomberg recap for those without a WSJ subscription:
Under the plan, the commerce secretary would designate the practice of currency manipulation as an unfair subsidy when employed by any country, instead of singling out China, the newspaper reported. American companies could then bring anti-subsidy actions to the U.S. Commerce Department against China or other countries, it said.
The discussions are part of a strategy being pursued by the White House’s new National Trade Council to balance the goals of challenging China on certain policies while keeping broader relations on an even keel, the paper said. The Trump administration would avoid, at least for now, making claims about whether China is manipulating its currency, it said.
While such an approach may seem clever, it has the risk of sideswiping American relations with a whole host of other countries other than China. As well, the imposition of countervailing duties is subject to a challenge under WTO rules.
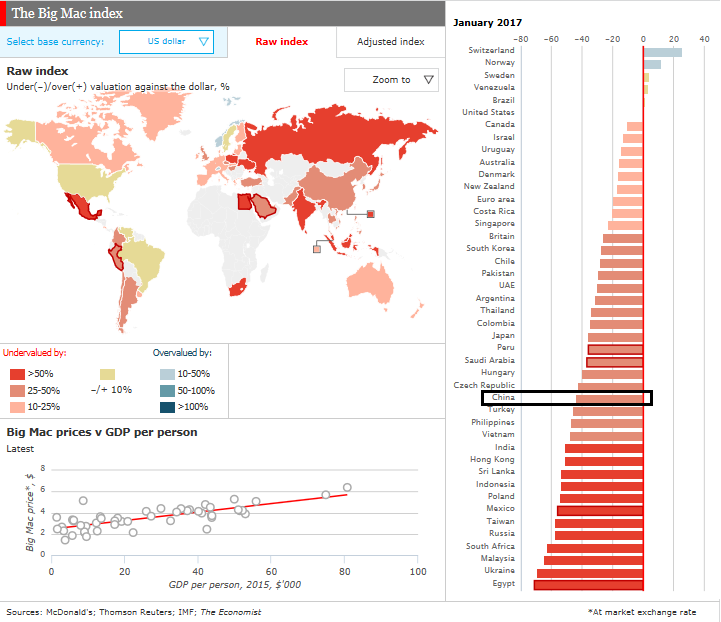
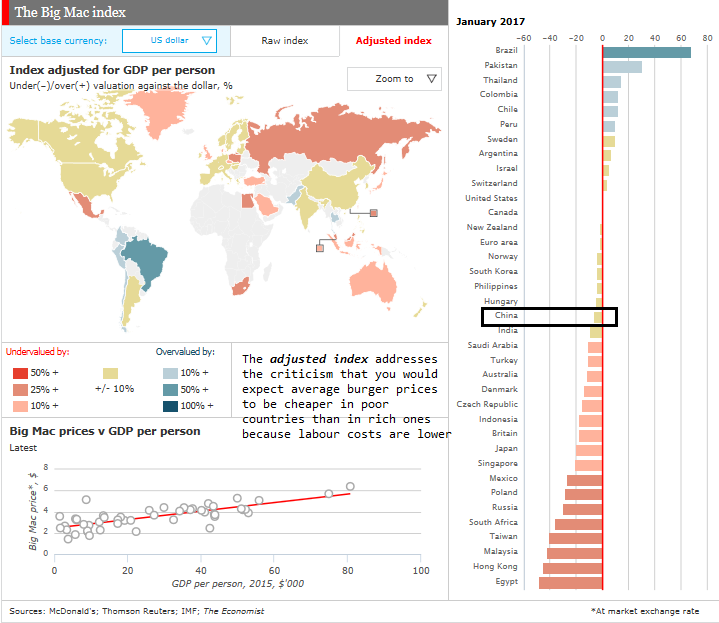
The Big Mac Index
One of the key questions is how you define an undervalued currency. There are many metrics, but consider the popular Big Mac Index, as compiled by The Economist.
If the idea of this initiative is to target China, then there are many other countries with undervalued currencies that will have to be targeted under this initiative. Starting from the bottom, the list includes the following countries before we get to China: Egypt, Ukraine, Malaysia, South Africa, Russia, Taiwan, Mexico, Poland, Indonesia, Sri Lanka, Hong Kong, India, Vietnam, the Philippines, and Turkey. A blanket rule that imposes countervailing duties on the exports from this list risks destabilizing a number of important geopolitical relationships, and it would signal the start of a global trade war.
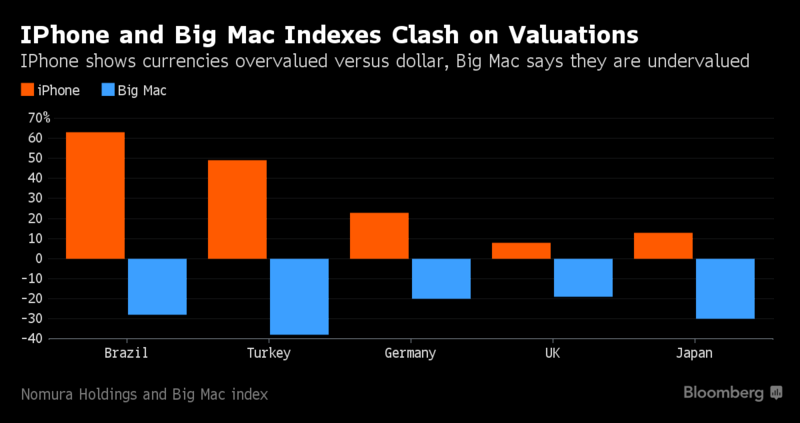
To be sure, the Big Mac Index has a number of flaws and it is not the only measure of purchasing power parity (PPP). Bloomberg reported that Nomura compiled an iPhone index because the price of Big Macs in poor countries can be distorted by low labor costs.
For years, many traders have used the Big Mac index — which is based on the price of a McDonald’s Corp. hamburger — along with an OECD gauge and measures based on consumer and producer prices, to determine currencies’ relative value. All of these show the dollar as broadly overvalued.
The iPhone index is better than its traditional peers because it uses the “defining product of the digital era,” Hafeez said. “IPhone is high-end tech,” he said. “That’s going to be the bigger driver in the future.”
Nomura found a number of notable differences between iPhone and Big Mac prices (data as of July 2016).
In response to these criticisms, The Economist unveiled the Big Mac Adjusted Index, which adjusts for labor costs in each country. Suddenly, China`s currency doesn’t look that undervalued anymore. On the other hand, a whole host of other countries would get targeted using this methodology: Egypt, Hong Kong, Malaysia, Taiwan, South Africa, Russia, Poland, and Mexico. While having Mexico on both the unadjusted and adjusted lists may serve the Trump administrations political aims, what about the other countries?
A trade war brewing?
I recognize that the “currency manipulation as unfair subsidy” represents a trial balloon by the Trump administration as a way of fulfilling its campaign promise of addressing the damage from “unfair trade”. The fact that the White House is even thinking about such broad based solutions are raising the risks of a global trade war.
Edward Harrison at Credit Writedowns believes that Donald Trump’s entrepreneurial risk taking personality makes him far more likely to start a trade war:
Now when you look at Trump the Entrepreneur through this prism, it explains not just his behavior on the campaign trail and in using Twitter, it also explains his “grab them by the pussy” mode of operating. I think it also explains how Trump the entrepreneur saddled four different businesses with so much debt that they were forced into bankruptcy. in short, Donald Trump is a man of action, who often leaps before he looks. That can mean unexpected success. But it means he is prone to getting things very wrong, and then having to improvise to clean up the mess.
This isn’t how traditional politicians operate, by the way. First of all, most politicians are frightened to death by uncertainty and assiduously avoid it to prevent tail risk. If you think about it from a decision tree perspective, a politician that has a choice between guaranteed but moderately bad outcomes and uncertain but potentially catastrophically bad outcomes is going to feel a lot of loss aversion pressure. Even a supposed maverick like Greek Premier Alexis Tsipras caved in 2015 – and went with a bad outcome to prevent a catastrophic outcome when the ECB threw down the gauntlet and threatened to collapse the Greek banking system.
But Trump is not that kind of guy. His overarching strategy is just the opposite – create uncertainty, be as unpredictable as possible and hopefully profit from this. He has even said this himself – multiple times.
By floating this trial balloon, the Trump administration has in effect let “slip the dogs of (trade) war”. Once you accept the principle of imposing countervailing duties on currency manipulation, why not border adjust for other reasons? FT Alphaville outlined a number of other proposals that have been floated, such as a carbon tax border adjustment:
So it’s interesting to read a proposal from Republican eminences arguing the government should tax carbon dioxide emissions, including from imported goods, and rebate the revenues to the public:
Border adjustments for the carbon content of both imports and exports would protect American competitiveness and punish free-riding by other nations, encouraging them to adopt carbon pricing of their own. Exports to countries without comparable carbon pricing systems would receive rebates for carbon taxes paid, while imports from such countries would face fees on the carbon content of their products.
How about labor standards in the name of “fair trade”?
If “border adjustment” is appropriate for discouraging pollution, why shouldn’t it also be used to uphold labour standards? What’s the point of having minimum wages, protections for collective bargaining, and occupational safety requirements if the jobs are just going to be offshored to countries — often less-than-democratic ones — with different priorities?
Indeed, slip loose the dogs of trade war. The kennel door is opening, and that would be very, very bearish for the global economy.
The chart below depicts the yield curve, as measured by spread between the 10-year and 2-year Treasury yields, (blue line) and equity returns (grey line). The yield curve has been an uncanny recession forecaster. It has inverted ahead of every single recession, and warned of major equity bear markets.
Unfortunately, this indicator may not work this time.
Tim Duy’s doubts
Fed watcher Tim Duy recently expressed some doubts as to the Fed’s policy of separating the process of rate normalization and the normalization of its balance sheet “because it risks financial destabilization by flattening the yield curve”:
Having tipped their toes in the water with two interest-rate hikes — and more expected to come — the Federal Reserve officials have begun the discussion about reducing the size of the central bank’s $4.45 trillion balance sheet. To date, they have tended to look at interest rate-policy as separate from balance-sheet policy. Once the former is heading toward normalization, then they can begin the latter.
I tend to be skeptical of that strategy, largely because it risks financial destabilization by flattening the yield curve, or the difference between short- and long-term bond rates. I would prefer an explicit policy strategy that incorporates both interest-rate and balance-sheet tools acting jointly not with the goal of “normalizing” either of those components, but aimed at meeting the Fed’s dual mandates of full employment and stable prices. Under such a framework, for example, the Fed wouldn’t need to follow through with additional rate hikes before to balance-sheet reduction. There would be no preconceived notion of the “correct” order of operations.
If the Fed’s QE programs distorted the shape of the yield curve by intervening in the bond market, then the process of separating the process of rate normalization and balance sheet normalization will also create another distortion. Duy prefers the approach favored by St. Louis Fed president Bullard:
Bullard still sees the balance sheet as a mechanism to normalize policy even if policy rates remain low. The problem with the current policy stance is that the Fed is flattening the yield curve by raising expectations of higher short-term rates while a large balance sheet places downward pressure on long rates. Bullard doesn’t see a theoretical justification for maintaining this twist operation as the Fed responses to changing economic conditions.
As Janet Yellen faces Congress this week, she will likely face questions about her approach to the Fed’s balance sheet. This will be an important policy issue as it has wound down QE and begun raising interest rates.
The Fed vs. Trump
In addition, I pointed out in my last post that how pivots in monetary policy by new Trump appointees have the potential to send shock waves through the economy and the markets (see A blow-off top, or a wimpy top?).
Fed officials are just preparing for a possible battle over the future direction of Fed policy. Vice chair Stanley Fischer* pushed back against the idea of using a mechanical rule to set interest rates in a speech on February 11, 2017. In that speech, Fischer used the FOMC August 2011 decision as case study:
And what do I take from this episode? The interest rate decision taken in August 2011 was unusual in that a decision was made about the likely path of future interest rates. Most often, the FOMC is deciding what interest rate to set at its current meeting. Either way, in reaching its decision, the Committee will examine the prescriptions of different monetary rules and the implications of different model simulations. But it should never decide what to do until it has carefully discussed the economic logic that underlies its decision. A monetary rule, or a model simulation, or both, will likely be part of the economic case supporting a monetary policy decision, but they are rarely the full justification for the decision. Sometimes a monetary policy committee will make a decision that is not consistent with the prescriptions of standard monetary rules–and that may well be the right decision. Further, in modern times, the policy statement of the monetary policy committee will seek to explain why the committee is making the decision it is announcing. The quality of those explanations is a critical part of the policy process, for good decisions and good explanations of those decisions help build the credibility of the central bank–and a credible central bank is a more effective central bank.
The next few months could be an important turning point for the Fed. Watch this space!
* Fischer can be regarded as a highly respected and grizzled veteran of central banking. He was on the thesis committee for both Ben Bernanke and Mario Draghi. IMHO, he was a leading candidate for Fed chair ahead of Yellen, but he could not be appointed because his former position as the head of the Israeli central bank. Instead, he was invited to become vice chair to act as a congliere to Yellen.
Preface: Explaining our market timing models
We maintain several market timing models, each with differing time horizons. The “Ultimate Market Timing Model” is a long-term market timing model based on the research outlined in our post, Building the ultimate market timing model. This model tends to generate only a handful of signals each decade.
The Trend Model is an asset allocation model which applies trend following principles based on the inputs of global stock and commodity price. This model has a shorter time horizon and tends to turn over about 4-6 times a year. In essence, it seeks to answer the question, “Is the trend in the global economy expansion (bullish) or contraction (bearish)?”
My inner trader uses the trading component of the Trend Model to look for changes in the direction of the main Trend Model signal. A bullish Trend Model signal that gets less bullish is a trading “sell” signal. Conversely, a bearish Trend Model signal that gets less bearish is a trading “buy” signal. The history of actual out-of-sample (not backtested) signals of the trading model are shown by the arrows in the chart below. Past trading of the trading model has shown turnover rates of about 200% per month.
The latest signals of each model are as follows:
Ultimate market timing model: Buy equities
Trend Model signal: Risk-on
Trading model: Bearish (downgrade)
Update schedule: I generally update model readings on my site on weekends and tweet mid-week observations at @humblestudent. Subscribers will also receive email notices of any changes in my trading portfolio.
So many questions, so few answers
Regular readers know that I have been calling for a cyclical market top in 2017 (see The roadmap to a 2017 market top). Outside of the risk of permanent loss from war or insurrection, severe bear markets have been mainly associated with economic recessions. My analysis has been based on the likely path of the US economy, and the timing of the next recession.
My base case, call it the “blow-off top” scenario, goes something like this:
The economy, which is in the late stages of an expansion, starts to overheat.
Investors and traders get enthusiastic about growth and bid stock prices up to unrealistic levels (hence the “blow-off”)
The Fed responds by raising rates to cool off the economy, but find it’s behind the curve…
Which results in a recession and bear market.
The blow-off top scenario would see the SPX reach the 2500-2600 level this year as it tops out.
I have been considering an alternative, call it the “wimpy top” scenario, where the market may have topped out already.
The economy, which is in the late stages of an expansion, starts to overheat.
Investors and traders get enthusiastic about the prospects for cuts cuts and deregulation under the Trump tax reform plan, which is what has happened so far.
Tax reform gets tied up in Congress and gets delayed until 2018.
Trump appoints hawks to the Federal Reserve board (now there are three vacancies with the resignation of Daniel Tarullo).
The new Trump appointed Fed governors, composed of hard-money advocates, becomes more aggressive, tightens monetary policy, and pushes the economy into recession.
An equity bear market is the result.
The wimpy top scenario is based on a double whammy of fiscal policy disappointment and a pivot to a more hawkish Fed policy. In that case, Current stock index price levels are roughly as good as they get.
The key differences between the two scenarios are the likely path of fiscal and monetary policy. Those are the big questions to which we have no answers. This week, I explain the risks and offer some suggestions of how to watch which scenario is the more likely one to unfold.
Geopolitical tail-risk
The risk of permanent loss from war or insurrection is the greatest toxic risk to an equity portfolio. The most likely potential US conflicts are with China, Iran, and North Korea. Reports such as this one from USA Today that indicated that Trump advisor Steve Bannon believes that the America and the western world are engaged in a war of civilizations against Islam, as well as the inevitability of war in the South China Sea are likely to spook markets.
Relax! Peter Lee (@chinahand on Twitter) reported that SecDef James Mattis signaled that the Trump administration is walking back much of its tough talk on China, North Korea, and Iran (use this link if the video is unavailable). At a minimum, any shooting war is unlikely in 2017.
There are also other hopeful signs that of a Sino-American thaw. Bloomberg reported that China has reached out the Trump administration through the Jared Kushner-Ivanka Trump back channel. Trump also sent a letter to Xi Jingping seeking “a constructive relationship” (via Bloomberg). What’s more, Trump told Xi in a phone call that the US would honor the “one-China policy”.
Tensions are being defused. The risk of war is off the table, at least for now.
A late cycle expansion
The economy is in the late stages of an economic expansion. The chart below depicts the latest initial jobless claims data normalized by population is at an all-time low. Further fiscal stimulus is likely to spark a round of wage driven cost-push inflation that forces the Fed to raise rates faster than market expectations.
The combination of a late cycle expansion that is starting to overhead, and rising interest rates from Fed policy are the key ingredients of a classical market top.
Doubts over Trump
I have also detected a rising level of anxiety over the Trump administration and the post election Trump rally. One prominent example was the New York Times profile of the legendary value investor, Seth Klarman:
In his letter, Mr. Klarman sets forth a countervailing view to the euphoria that has buoyed the stock market since Mr. Trump took office, describing “perilously high valuations.”
“Exuberant investors have focused on the potential benefits of stimulative tax cuts, while mostly ignoring the risks from America-first protectionism and the erection of new trade barriers,” he wrote.
“President Trump may be able to temporarily hold off the sweep of automation and globalization by cajoling companies to keep jobs at home, but bolstering inefficient and uncompetitive enterprises is likely to only temporarily stave off market forces,” he continued. “While they might be popular, the reason the U.S. long ago abandoned protectionist trade policies is because they not only don’t work, they actually leave society worse off.”
In particular, Mr. Klarman appears to believe that investors have become hypnotized by all the talk of pro-growth policies, without considering the full ramifications. He worries, for example, that Mr. Trump’s stimulus efforts “could prove quite inflationary, which would likely shock investors.”
These worries are nothing new, but concerns over protectionism, and the inflationary effects of fiscal policy are becoming more visible. Business Insider also outlined the reservations over Donald Trump voiced by well-known investors and analysts such as Ray Dalio, Nouriel Roubini, David Einhorn, and several others.
Don`t count Trump out
I would caution any Trump opponents and Never Trumpers not to allow their politics to get in the way of their investing. Even Paul Krugman, who styles himself as the “conscience of a liberal”, had a warning for investors who might be getting overly bearish.
Supposing that you thought that Donald Trump is destined to be another Adolf Hitler (not a view that I endorse), the historical record shows that the DAX actually performed well under much of Hitler’s reign. Investors just had to watch for the bearish trigger and to get out at the right time.
Tax reform: Bullish or bearish?
Even if we were to eliminate the tail-risk of a shooting war, investors need to consider a number of factors before taking either a bullish or bearish outlook on stocks.
Consider, for example, Trump’s headline program of tax cuts and tax reform. The economic effects of Trump’s proposed tax reform proposals are highly inter-connected and their effects are multi-dimensional. It is therefore difficult to forecast their effects without knowing all the program specifics.
Here is the bull case. Brian Gilmartin highlighted analysis from BCA and BAML which indicated that the combination of a Border Adjustment Tax and offshore cash repatriation would add roughly 10% to SP 500 earnings. Marketwatch reported that JPM’s estimates of BAT would add 6% to earnings, everything else being equal.
The key phrase here is “everything else being equal”. But everything else isn’t equal.
The bear case can be observed from the macro analysis from Barclay’s estimated fiscal effects of a likely tax reform package (via Sam Ro). Sure, there will be significant stimulus in the form of tax cuts, but most of it will be paid for by a Border Adjustment Tax. If enacted, the sheer size of the BAT indicates that these measures are hugely protectionist. Not would it bring the multi-decade globalization trend to a halt, it would play havoc with the global supply chains of American multi-nationals and likely devastate their operating margins. While brokerage firm analysts have modeled the first order effects of BAT, I have not seen anyone model those second and third order effects of protectionism and likely trade war.
Watch for the details of how the tax reform proposals might evolve. We will no doubt see lots of negotiations within the Republican Party before this process is complete.
What Wall Street wants
The reaction from Wall Street to the rising level of uncertainty is instructive. As an example, Goldman Sachs has become more cautious about the how the market has priced in Trump’s proposed tax cuts and deregulation (via CNBC):
In a note to clients on Friday, the investment bank noted President Donald Trump’s agenda was already running into bipartisan political resistance, with doubts growing about potential tax reform and a repeal of the Affordable Care Act, among other marquee Trump administration initiatives.
Just two weeks into his tenure, “risks are less positively tilted than they appeared shortly after the election ,” Goldman wrote. Growing resistance to Trump’s executive orders on immigration and financial reform has galvanized opposition while dividing members of the president’s own Republican Party.
In effect, Wall Street is asking Washington, “Where are my tax cuts?” Barry Ritholz wrote that, in order to succeed, Trump needs to focus on his economic agenda:
The disastrous roll out of President Donald Trump’s clampdown on refugees and visitors from majority-Muslim countries wasn’t how his supporters were expecting his administration to begin. While it was a cornerstone of his election campaign, it was poorly thought out, with little consideration given to the inevitable legal challenges, protests and political backlash.
If this seems somewhat familiar, you need only recall President Barack Obama’s disastrous launch of the Affordable Care Act, a piece of legislation the administration strained to get through Congress. The website was unusable and crashed constantly, and was widely recognized as a costly and avoidable error. It was obvious that the people in charge hadn’t thought this through and failed to stress test the site. It tarnished perceptions of both the program and the administration’s cherished reputation for competence…
By failing to act boldly on financial reform, the Obama team allowed a smoldering resentment to take hold and build among the public. The massive taxpayer wealth transfer to bankers who should have lost their jobs sowed the seeds of the backlash that fueled the rise of the Tea Party, and led to the huge electoral losses for the Democratic Party and Trump’s November victory.
Fast forward to 2017. It looks as if Trump is making a similar error by focusing on immigration first — and in an ill-considered and misguided way — instead of making tax reform his biggest priority.
Edward Harrison echoed Ritholz’s remarks and he believes that Trump is likely to fail in his first term if he stays a “cultural warrior”:
Early on in President Trump’s new administration, too much of his energy is being placed on divisive ‘cultural’ issues and not enough attention is being paid to economic policies. To the degree Trump has turned to the economy, much of his policy has been focused on issues that will not yield long-term economic benefits but contain considerable risk, like trade with Mexico and China. And so, while Donald Trump is only a few weeks into his presidency, I think we can begin to take stock of what his presidency will mean for the US economy…
“A successful Trump who keeps his campaign promises would work with McConnell, Ryan, Sanders, and Pelosi to get an infrastructure bill through Congress. Meanwhile he would force US allies to increase their military spending and purchase of US weaponry while the US pares back its own defense spending. And finally, a successful Trump would cut the FICA tax that supposedly ‘funds’ social security, something that is both a cost for employers and for employees and therefore a highly regressive tax. Cutting business taxes or lowering the top tax bracket won’t get that job done. But those kinds of tax cuts will increase income inequality…
“A failed Trump who bought lock, stock and barrel into Republican orthodoxy would go back on his pledge to leave social security and medicare alone and focus on privatizing or cutting social security as a way of lowering the deficit. And he would focus on killing TTIP and TPP or extracting the US from NAFTA. You could make ideological arguments on these issues after robust growth and lower broad unemployment have returned. But, by then we would see whether economic and job growth had changed the path of debt and deficits and unemployment demonstrably. Moreover, none of these goals would immediately stimulate growth in the short term. They could mean recession and doom his presidency, if they became his signature economic goals.”
The latest political developments yield a mixed picture. On one hand, Reuters reported that Trump promised a “tremendous tax plan” in the next 2-3 weeks. On the other hand, the WSJ reported that Trump downgraded the position of chair of the Council of Economic Advisers (CEA) as he won’t be part of the cabinet. This development is a worrisome sign over the medium term for the health of the economy.
Assume a Clinton presidency
What if there is no Trump tax reform, or the legislation gets stalled until 2018? CNBC reported that Goldman Sachs had fretted about the possibility that Trump’s tax reform package might get stalled in Congress:
In a note to clients on Friday, the investment bank noted President Donald Trump’s agenda was already running into bipartisan political resistance, with doubts growing about potential tax reform and a repeal of the Affordable Care Act, among other marquee Trump administration initiatives…
“While bipartisan cooperation looked possible on some issues following the election, the political environment appears to be as polarized as ever, suggesting that issues that require bipartisan support may be difficult to address,” the bank added.
The balance of risks “are less positively tilted than they appeared shortly after the election,” Goldman said, which may blunt the force of future growth.
Amid reports that top GOP members are reportedly becoming nervous about the impact of a full-fledged repeal of health care, that political pushback “does not bode well for reaching a quick agreement on tax reform or infrastructure funding, and reinforces our view that a fiscal boost, if it happens, is mostly a 2018 story.”
To model the effects of a stalled tax reform plan, imagine that the status quo candidate, Hillary Clinton, had won the election. The world would still have undergone a global reflationary recovery, which was in place regardless of who had won. Market fundamentals on a backward looking basis would not be very different today in a Clinton victory scenario.
We observe today`s market’s forward P/E ratio from Factset is 17.3, which is quite elevated when compared to its own history. US equities would be regarded as expensive, especially in light of the lack of the promise of tax cuts and deregulation in the near future. Deflate prices by about 12%, and valuations fall to its 5-year historical average.
Now return from your alternative universe of a Clinton victory to today’s Trump presidency, should you freak out about a correction potential of about 12% if tax reform is delayed by a year? In all likelihood, the decline would be less as the market will still look ahead to the potential benefits from future tax cuts.
Changes at the Fed?
Friday’s news of the resignation of Fed governor Daniel Tarullo was a surprise. There are now three vacant seats on the Fed board, which gives the Trump administration an opening to dramatically shape the course of monetary policy.
Here is the big question: Who will Donald Trump appoint? Will the low interest loving Trump seek out doves to accommodate his expansionary fiscal policy, or will he stick with Republican supply-side orthodoxy and appoint hard-money hawks? Names like John Taylor and Kevin Warsh have been floated as possible future Fed chairs to replace Janet Yellen. If so, then watch for their names to be appointed to the board as a first step. Both Taylor and Warsh can be considered to be more hawkish than Yellen.
To illustrate my point about Taylor, here is a chart of the interest rates under the Taylor Rule, proposed by John Taylor. Taylor has been an advocate of a rules based approach to setting monetary policy. Taylor Rule rate assumptions are based on a 2% real rate and 2% target rate. As the chart shows, the target rate is considerably higher than current Fed Funds rate, which imply a tighter monetary policy under a Taylor Fed.
Kevin Warsh was a hawk when he was a Fed governor. In a speech he made on September 25, 2009, about a year after the Lehman collapse, he made it clear that he was itching to tighten monetary policy.
Ultimately, when the decision is made to remove policy accommodation further, prudent risk management may prescribe that it be accomplished with greater swiftness than is modern central bank custom. The Federal Reserve acted preemptively in providing monetary stimulus, especially in early 2008 when the economy appeared on an uneven, uncertain trajectory. If the economy were to turn up smartly and durably, policy might need to be unwound with the resolve equal to that in the accommodation phase. That is, the speed and force of the action ahead may bear some corresponding symmetry to the path that preceded it. Of course, if the economy remains mired in weak economic conditions, and inflation and inflation expectation measures are firmly anchored, then policy could remain highly accommodative…
In my view, if policymakers insist on waiting until the level of real activity has plainly and substantially returned to normal–and the economy has returned to self-sustaining trend growth–they will almost certainly have waited too long. A complication is the large volume of banking system reserves created by the nontraditional policy responses. There is a risk, of much debated magnitude, that the unusually high level of reserves, along with substantial liquid assets of the banking system, could fuel an unanticipated, excessive surge in lending. Predicting the conversion of excess reserves into credit is more difficult to judge due to the changes in the credit channel.
Here is what’s at stake. The chart below shows the US federal debt, which has exploded in the past decade.
How will the federal budget handle those payments if interest rates were to rise? In the chart below, debt service is estimated as the total debt times the 10-year Treasury yield as an approximation (black line). To estimate the impact of a tighter monetary policy, I added the differential between the Taylor Rule rate and the Fed Funds rate (see above chart) to the 10-year rate. I assumed that rates either rise by one-half of the differential (blue line), or the full differential (red line). For added perspective, the purple line shows total tax receipts as a percentage of GDP. If we were to accept the Republican supply-side orthodoxy that tax rates are too high, the dotted line represents the linear regression of tax receipts, which I defined as “normalized” tax receipts. (All data was downloaded from FRED, calculations are mine).
As the above chart shows, if rates were to rise to even half of the Taylor Rule adjustment, debt service costs would surge dramatically. A full Taylor Rule adjustment would raise debt service charges to 2.6 times the current rate. The federal deficit would explode in the absence of offsetting revenues.
The chart below depicts debt service costs as a percentage of normalized federal tax receipts (dotted line in the previous chart). If rates were to rise to between 50% and 100% of the Taylor Rule adjustment, debt service costs would become 30-40% of total tax revenues. Yikes!
I recognize that there are a number mitigating factors to this study. Firstly, interest rates would not adjust immediately and rise to a Taylor Rule rate, but would occur over a longer period. As well, tax revenues could increase under the Trump fiscal stimulus plan because of increased tax receipts from better economic growth. On the other hand, the history of Republican tax cuts have not turned out to be revenue neutral but ballooned the debt (see total debt chart above).
In summary, a hawkish pivot of Federal Reserve monetary policy would result in a surging federal deficit, and make a 2018 recession a virtual certainty. I am not sure if Trump fully grasps the implications of his Fed appointments just yet. His actions to downgrade the chair of CEA from a cabinet post indicates that he has little respect for economists. Has anyone pulled him aside and explained the implications of Fed governor appointments? If he opts to steer the Fed toward a dovish course, can he find enough governors who are as dovish as the current board?
Watch this space!
Where we stand today
I wrote at the beginning of this post that there are more questions than answers. The market faces a number of key policy uncertainties. What is this “tremendous tax plan” that Trump promised, and will it pass muster with the deficit hawks in the Republican caucus?
Who will he appoint to the board of the Federal Reserve? So far, none of the three vacant posts at the CEA have been filled. Even some CEA appointments could give some hint as to possible policy direction.
So many questions, so few answers.
Here is what I am watching. First, the direction of fiscal policy by way of the reception of the Trump team’s tax reform proposals is important. Equally important, but more ignored, are hints about who might be appointed to the Fed board.
Fortunately, the probability of a recession in 2017 is low to nonexistent. On the other hand, a recession in 2018 is still an open question. New Deal democrat is starting to see a few dark clouds on the horizon in his monitor of high frequency economic indicators, and that’s before all of the possible policy effects that I discussed:
The interest rate components of the long leading indicators have improved enough to be neutral. The yield curve and money supply remain positive (but with the positivity in real M2 decelerating). Purchase mortgage applications are neutral. Refinance mortgage applications remain quite negative. The important change this week is that growth in real estate loans has decelerated enough to turn from positive to neutral…
While the shorter term 6 month forecast remains strongly positive (barring a trade war), The 12 month + forecast is shading even more neutral to negative, with money supply, the yield curve, and spreads being the remaining positives.
The markets are forward looking discounting machines. Market trends can therefore provide clues as to whether the cyclical top is in. My approach of applying trend following techniques to a variety of asset classes across different geographic regions gives a holistic picture of global macro conditions, as well as investor risk appetite. To be sure, trend following models are always late and they will never get you out at the exact top. They are, however, designed to avoid the worst of any bear market and allow investors to take appropriate action to protect themselves.
Still, I am hopeful that the market will follow the blow-off top path. The wimpy top scenario just doesn’t “feel right”. While every market cycle is different, we are not seeing the kind of investor and trader giddiness that accompanies a typical cyclical top. The more likely scenario calls for a benign resolution of these tax reform proposals, followed by a rally where market participants pile into stocks and move into a crowded long position on risky assets. That’s when I will signal “sell” and be derided for being an idiot, a Never Trumper, or something worse.
Near-term risks
In the interim, the market faces a number of near-term risks. The uncertainty over the tax reform proposals and the risk of rising protectionism are factors that will spook the markets.
In addition, Jeff Hirsch at Almanac Trader observed that we are entering the most bearish part of the first 100 days of a new presidential administration. In particular, Republican presidents have had a tougher time that Democrats.
The latest update from John Butters of Factset shows that Wall Street is pulling back on the earnings growth outlook. While earnings and sales beat rates for Q4 are roughly in line with historical averages, the negative guidance rate edged up from last week. More importantly, forward 12-month EPS deflated by 0.12% in the week. These are all signs for traders and investors to brace for some near-term turbulence.
Another warning comes from a combination of mild overvaluation and insider activity. The charts below shows a mild overvaluation of stock prices of 3%, from Morningstar’s fair value estimate, and several weeks of consistent insider selling (via Barron’s). Under these conditions, stock prices are likely to face headwinds until the details of the fiscal stimulus proposals are not clear.
Still, there is no reason to panic. All of these factors are only mildly bearish. They can be resolved with a shallow pullback. Bear markets are caused by either by growth disappointments or rising interest rates. Unless we see evidence of full scale protectionism, or if the Fed stomps on the monetary brakes, the equity outlook remains benign.
So don’t freak out.
The week ahead: Brace for turbulence
Looking to the week ahead, I stand by my tactically bearish trading view in my last post (see What’s wrong with the VIX?). Even though major market averages all achieved all-time highs on Friday, the move may be interpreted as exhaustive.
The lack of confirmation of the new high by the junk bond market is worrisome from a cross-asset basis, as junk bonds is a key metric of the market’s risk appetite.
This Index Indicators chart of stocks above their 5 dma (1-2 day time horizon) is flashing an overbought reading, which suggests that a near-term pause is in order.
This Index Indicators chart of net 20 day highs-lows (1-2 week time horizon) is showing a near overbought reading, indicating that upside potential is limited at current levels.
My inner investor remains bullish on equities. He is unlikely to turn bearish in the absence of a recession warning, which is not present, or significant technical deterioration in the major market indices.
My inner trader moved to cash last week. Even though the trading model flashed a “sell” signal, it is not a high conviction call. He is therefore staying on the sidelines for now.
Mid-week market update: Increasingly, I have seen cases being made for an equity market correction. This Bloomberg article, “Five charts that say not all is well in the markets” summarizes the bear case well.
Uncertainty is at a record high: The number of news stories using the word “uncertainty” is surging.
Wall Street vs. Washington: While the Global Economic Uncertainty Index is elevated, the VIX Index remains low by historical standards.
The price of hedging tail-risk is rising: Even as the VIX remains low, the CBOE SKEW Index, which measures the price of hedging extreme events, is high. Which is right?
Gold is rising: Gold is often thought of as a safe haven in times of stress and the gold price has recently been inversely correlated with equity prices.
Watch for gold and bond yields to rising together: “Gold may prove the “tell,” according to Chris Flanagan, also at Bank of America. He advises investors to watch “for the combo of rising yields and rising gold prices to signal impending market volatility.” Three consecutive quarters of rising benchmark bond yields and gold prices preceded previous market falls including the 1973-1974 bond market crash and Black Monday in 1987, he says. The yield on the benchmark 10-year U.S. Treasury has risen to 2.44 percent from 1.77 percent since Trump’s election win. Gold has moved sideways.”
Much of the anxiety can be summarized as, “What’s wrong with the low level of the VIX Index? Isn’t the VIX supposed to be a fear gauge?”
Why aren’t stock prices falling if actual fear is so high?
The VIX explained
To answer those questions, let’s start with the definition of the VIX Index. The VIX Index measures the at-the-money implied volatility of SP 500 options. Now remember the diversification effect. An index of stocks is less volatile than the aggregate volatility of its individual components because the returns of the components don’t all move together. In other words, they are diversifying.
Joe Wiesenthal showed how correlations of stocks within the index have been falling. As correlation falls, the diversification effect gets magnified and therefore puts downward pressure on index volatility, or VIX.
If you are convinced that stock prices are destined to drop dramatically, one way for institutional investors to capitalize on this is to trade correlation (see this GSAM presentation). Kids – don’t try this at home. Unless you fully understand the math, the subtleties of trading correlation can be highly detrimental to your net worth.
A rolling correction
Here is a a far simpler explanation of why stock prices aren’t falling. The market has been moving sideways since December and it is undergoing a rolling correction. The chart below shows the RRG chart by sector. Cyclical sectors such as energy, material, and industrials have been correcting. Financial stocks, which had been market leaders, have retreated from a leadership position to the weakening category. By contrast, formerly weak sectors, such as consumer staples, healthcare, and utilities, are rising. More importantly, the heavyweight technology sector, which comprises 21.3% of the weight of the index, has been strengthening as well.
In order for the index to weaken significantly, we would have to see some evidence of stalling by technology stocks. So far, that’s not happening.
The top panel of the chart below shows that the high beta vs. low volatility ratio falling through its relative uptrend, which is a sign of falling risk appetite. However, the bottom panel shows that the relative performance of momentum stocks, which are mostly the glamour FANG names, have taken the baton of leadership.
In addition, I am watching whether the financial stocks can stabilize at these levels in light of the Trump administration to backtrack on Dodd-Frank. As well, the relative performance of this sector has historically been correlated to the shape of the yield curve. Will the yield curve steepen (bullish for financials) or flatten (bearish)?
If these two heavyweight sectors hold up, then it would be difficult to see how stock prices could correct significantly given the relative strength support of emerging sectors such as consumer staples, healthcare, and utilities.
More sideways consolidation
Having said all this, the recent technical violation of the SPX uptrend is not good news for the bulls. On the other hand, I find it difficult to make a case for a significant market correction under the current circumstances. There seems to be significant support at the 2260-2270 level. Until that zone is breached, the most likely scenario is a period of choppy sideways market action
My inner investor remains bullish on stocks. I outlined my intermediate term bull case in my weekend post (see Still bullish after my chartist’s round-the-world trip). My inner trade sold all of his long position and moved to cash today. The trading model has flashed a weak sell signal, but he is staying in cash due to the low conviction nature of the signal.
Technical analysts often use the magazine cover indicator as a contrarian indicator. When an idea has become so commonplace that it becomes the cover of a major magazine, the public is all-in and it’s time to sell.
The Economist reported on an ad hoc study by Greg Marks and Brent Donnelly at Citigroup using covers from The Economist and did find contrarianism works, even though The Economist is not really a popular mainstream magazine:
Interestingly, their analysis finds that after 180 days only about 53.3% of Economist covers are contrarian; little better than tossing a coin. After 360 days, the signal is a lot more reliable—68.2% are contrarian. Buying the asset if the cover is very bearish results in an 18% return over the following year; shorting the asset when the cover is bullish generates a return of 7.5%.
Now consider the following Time magazine cover and accompanying story on Steve Bannon, who is said to be the man behind the Donald Trump presidential throne.
There is also this cover from The Economist within the same week.
Still not convinced? How about this cover from Der Spiegel. You don’t even have to read German to understand the idea.
It isn’t just me, Helene Meisler raised the same question about magazine covers, which was answered by Liz Ann Sonders at Schwab.
Here at Humble Student of the Markets, our mission to focus on investing and try to remain apolitical. Like most on Wall Street, we don’t protest political developments, we trade them.
Rather than interpreting these magazine covers as just peak Trump, as he will be POTUS for the next four years, the contrarian message may be “peak populism”. Nate Silver recently wrote an article called “14 versions of Trump’s presidency, from #MAGA to impeachment”, where he laid out a variety of scenarios of how Trump’s presidency might proceed.
I would like to offer some details of how the reversal of peak populism might work. As well, there is a possible trade for contrarian investors who are willing to bet on the “peak populism” theme.
Yes, Minister
Back in the early 80s, the BBC aired a satirical series called Yes, Minister which told the story of a government minister’s struggles against the civil service, and vice versa. New political initiatives that upset the status quo would be met with, “Yes, Minister. But…”
Why did limited government and ‘constitutionalism’ (the rule of law, constitutional rules, and political representation) evolve in some societies but not others? Guided by history, this paper examines why this evolution reflects dependence on administrators to implement policy choices including those affecting them. Limited government and constitutionalism are manifestations of equilibria in which the administrators have the power to influence choices. The thesis that constitutionalism reflects an equilibrium among the powerful differs from the prevailing one, which asserts that it reflects gains to the weak from constraining the powerful. Analyzing the determinants and implications of administrative power reveals its impact on trajectories of economic development. Distinct administrative-power equilibria have different impacts on the security of the non-elite’s property rights; intra-state and inter-state violence (e.g. civil wars and wars, respectively); policies; entry barriers to new technologies and economic sectors; the nature of political conflicts; and the means to resolve conflicts concerning political rights.
Happily ever after?
This post isn’t just about the unconventional approach of the Trump administration, but how the rise of populism has upset the status quo in developed economies. This is also the story of how new governments with revolutionary ideas fall down in implementation. Just because you won an election doesn’t mean that you will necessarily live happily ever after.
Consider the problems of the myriad of details surrounding the Brexit process, which is another political initiative that upset the status quo. Here is FT Alphaville on the latest UK government Brexit white paper:
The UK government’s white paper on exiting the European Union was published on Thursday. Unfortunately, it doesn’t have much detail — or at least nothing like the sort of detail that might provide a picture of how Britain will actually end 43 years of EU membership, replace the entire body of adopted EU legislation, and re-build a trading regime with its biggest overseas market…
Malcolm Barr, an economist at JP Morgan, is simply aghast:
Resources in many government departments have been focused on the Brexit issue since the referendum result back in June. That should be generating a repository of granular, sector level detail that was available to be drawn on for this publication. As a distillation of the state of knowledge within the UK government six months after the vote, and with the beginnings of a time-compressed negotiation just weeks away, the shallowness of the analysis and absence of detail are matters of great concern, in our view.
There’s no discussion of continued EEA membership, no discussion of Britain’s share of EU liabilities, no list of what new regulatory authorities Britain will need, and no real detail on how migrant flows might work.
Call it what you want. Maybe the civil service is resisting change. On the other hand, the government may not simply be prepared for all the operational details of its political initiatives.
Over on this side of the Atlantic, the implementation of Trump’s travel ban is also instructive of how a neophyte government is learning the ropes of administration. Sure, there were protests, which were to be expected given the radical nature of the announcement. What was more disturbing were the reports of confusion by Homeland Security over the details of the directive, which is a sign that the lack of preparation by the civil service, and the courts upholding the legal challenges, which is a sign that the directive was not well written. These are all indications that the government was unprepared for the nitty-gritty of implementation.
Struggles of the political leadership against the bureaucracy is nothing new. In China, Beijing’s stated goal of re-balancing the economy towards consumer spending and away from credit driven infrastructure growth represents a direct attack on the wealth and power of many Party cadres. That’s one of the reasons behind Xi Jingping’s anti-corruption campaign. He wants to control the bureaucracy and eliminate opposition to the policy goals of economic re-balancing.
Politico featured an insightful interview with James Baker, who served in the Reagan and Bush I administrations, about how to manage the bureaucracy. Much of it is about getting the right management structure in place:
When he reigned in the Washington of the 1980s as its premier backstage power broker, Baker took as his personal motto the saying, “prior preparation prevents poor performance.” Clearly, the Trump White House is not yet delivering on the prior preparation part, a problem that Baker says may well be because Trump comes from decades of running his own company exactly as he wished. “Running a business and running the government are two entirely different functions, quite frankly, and process matters,” says Baker, who tells me he has also given his advice directly to Trump, Tillerson and Trump’s new chief of staff Reince Priebus. And presumably also Vice President Mike Pence, who was seated next to Baker at last night’s Super Bowl in Houston. “Process matters a lot in order to avoid mistakes, controversy.”
Already, he is struck by a White House that he worries is set up for internal conflict, division and miscommunication. “The White House that they have constructed has a lot of chiefs,” he says. “In this White House, it seems to me, you’ve got at least four, maybe five, different power centers, so we are just going to have to wait and see how it works in practice.”
Baker believes that you have to understand the process of governing involves dotting the i’s and dotting the t’s. That is a lesson that the neophyte Trump administration, which is mainly composed of outsider, is still learning.
Jim Baker was so invaluable to the Reagan Revolution not because he helped the Gipper blow up Washington but because he knew how to work its institutions. And that included first and foremost the White House, where Baker as chief of staff quickly figured out how to gain control despite being a newcomer to the president’s inner circle who was viewed suspiciously by Reagan’s longtime aides and ideologists like Ed Meese.
In our conversation, Baker makes a point of drawing a distinction between Trump and Reagan on just this point.
“In fact, Ronald Reagan’s administration had a lot of people in it who had been there before,” he says. “And we knew how Washington worked and what didn’t work. Consultation and not surprising people is important if you want them to support the policy and Ronald Reagan was very good at understanding that. He was ideological, there’s no doubt about it… but in terms of how you got there and what you did, he wanted to do it in a way that made it work, so that you could accomplish it. And that’s what he did,” Baker says. “He was to some extent an ideologue but people don’t appreciate the extent to which he was really pragmatic. If he told me once he told me a thousand times sitting there in the Oval Office with him… he would say, ‘Jim, I’d rather get 80 percent of what I want than go over a cliff with my flag flying.’”
Big Bold Ideas are great, especially if you have the political mandate. It’s perfectly ok to want to implement political initiatives, such as “keep the country safe from terrorists”, “leave the European Union and chart our own course”, or “re-balance the economy to a more sustainable growth path”. What is not acceptable a government fumbling their implementation of a Big Bold Idea. Repeat those mistakes enough times, and you will lose credibility and result in the slow death of your populist movement.
Buy the French panic
If you believe that the populism is at or near its high tide mark, a trading opportunity can be found in Europe. In France, support for the socially and fiscally conservative presidential candidate François Fillon is slipping quickly in light of “Penelopegate”, where Fillon put his wife and children on the government payroll without any apparent work performed. The spread between French OAT and German 10-year Bunds are blowing out. This presents an opportunity for contrarians to buy the “French panic”.
Fillon’s failings leaves a clear shot for upstart centrist Emmanuel Macron, who appears to have the best shot to win the election against Marine Le Pen, the populist anti-establishment candidate. Macron was a minister in the Hollande’s socialist government, but as this Guardian profile shows, he’s not very “socialist” at all. He is best characterized as a left-winger in the Tony Blair centrist mold.
He says he is “of the left”, but keen to unite people from across the spectrum, including the right. Economically liberal and pro-business, Macron was tasked by Hollande with opening up France’s sclerotic economy; the loi Macron reforms that bear his name were so unpopular they had to be forced through by decree. But he is also fiercely progressive on social issues – eager to stimulate growth and free up business while protecting the country’s strong social safety net.
The latest polling averages show that Marine Le Pen ahead in the first round, but Macron would beat her 64-36 in the second round (via Macro Monitor). Moreover, he outperforms all of the other candidates. If Macron were to win, he would go to the Elysée Palace without Fillon`s Moscow friendly tilt. A Macron victory would be bullish for French and European assets.
For investors who want to play the contrarian “peak populism” trade, buy French OATs. In the alternative, there is also the long France/short Germany equity ETF pair.
Preface: Explaining our market timing models
We maintain several market timing models, each with differing time horizons. The “Ultimate Market Timing Model” is a long-term market timing model based on the research outlined in our post, Building the ultimate market timing model. This model tends to generate only a handful of signals each decade.
The Trend Model is an asset allocation model which applies trend following principles based on the inputs of global stock and commodity price. This model has a shorter time horizon and tends to turn over about 4-6 times a year. In essence, it seeks to answer the question, “Is the trend in the global economy expansion (bullish) or contraction (bearish)?”
My inner trader uses the trading component of the Trend Model to look for changes in direction of the main Trend Model signal. A bullish Trend Model signal that gets less bullish is a trading “sell” signal. Conversely, a bearish Trend Model signal that gets less bearish is a trading “buy” signal. The history of actual out-of-sample (not backtested) signals of the trading model are shown by the arrows in the chart below. Past trading of the trading model has shown turnover rates of about 200% per month.
The latest signals of each model are as follows:
Ultimate market timing model: Buy equities
Trend Model signal: Risk-on
Trading model: Bullish
Update schedule: I generally update model readings on my site on weekends and tweet mid-week observations at @humblestudent. Subscribers will also receive email notices of any changes in my trading portfolio.
Confusing macro cross-currents
Last week, I wrote that investors should tune out the political noise and focus on the fundamentals of growth (see A focus on growth). Still, the markets appear to be confused.
On one hand, Friday’s positive surprise from the January Jobs Report told the story of an American economy that is on a solid non-inflationary growth path. Indeed, the latest update from ECRI shows their Weekly Leading Indicator has surged to an all-time-high.
Urban Carmel pointed out that the macro outlook is strong in virtually all respects, and I agree. Moreover, the upturn is global in scope, which suggests that this recovery has staying power because of the breadth and scope of the advance.
On the other hand, the new Trump administration is starting to give Wall Street the jitters. Josh Brown summarized the anxiety well this way:
All the investment guys want the tax cuts and repatriation to happen. They want the 4% GDP growth. They want the infrastructure push to actually work. But, they’re definitely afraid. They don’t like the tweets, the executive orders, the daily mass protests or the shady people who seem to be accumulating power and influence.
I know of no conventional way to resolve the interplay between the bullish macro backdrop and bearishness from policy uncertainty. One approach to cut through the noise is to just ignore it. Instead, use technical analysis to understand what the markets are discounting.
This week, I will dispense with my usual macro and fundamental analysis and take a chartist’s tour around the world. Let’s see what the markets are telling us.
A chartist’s world tour
We begin with a chartist’s tour around the world using an intermediate term framework. Starting in the US, we can see that the SPX is in a solid uptrend, defined as trading above its upward sloping 50 dma and 200 dma, and testing overhead resistance.
Crossing the Atlantic, we can see that UK FTSE 100 is also in a uptrend, though it has pulled back just above its 50 dma.
Across the English Channel, the Euro STOXX 50 shows a similar picture of a pullback within an uptrend.
So far, so good. All of these markets are in uptrends. Each of the indices are above their 50 dma, which is above their 200 dma. In addition, the 50 and 200 dma lines are all sloping upwards.
I found an exception in Asia. The Shanghai Composite is trading below its 50 dma, but above its 200 dma. However, the stock indices of all of China’s major Asian trading partners are all above their 50 dma.
The weakness in Shanghai Composite can be somewhat discounted because the Chinese stock market functions more as a casino rather than a serious capital market. The trends seen in the other regional exchanges can be better measures of market expectations of Chinese growth.
Commodity prices are also good indicators of Chinese growth, largely because China is such a voracious consumer of raw materials. Callum Thomas of Topdown Charts found a high degree of correlation between copper prices and Chinese PMI.
With that in mind, the chart of industrial metals, which is a broader measure of cyclical metals than just copper, shows a solid uptrend.
Similarly, the CRB Index is also trading above its 50 and 200 dma. The CRB is less reliable global cyclical indicator as it has a heavy energy weight and therefore subject to the specifics of the supply-demand dynamics of the oil market.
Healthy risk appetite
In addition, my measures of risk appetite remains bullish. As the chart below shows, equity risk appetite, as measured by high beta stocks vs. low volatility stocks, and small vs. large cap stocks, are in solid relative uptrends.
The bond market is also telling a similar story of rising risk appetite. The price performance of junk bonds against their duration equivalent Treasuries are confirming the equity uptrend.
When I put it all together, global equity and commodity markets, as well as US market internals, are telling a story of reflationary rebound. The nascent strength was indicated by last year’s MACD buy signal on the Wilshire 5000, which should be respected.
Mixed breadth reading
While the intermediate term investment outlook for equities looks solid, the picture is less clear for traders with a shorter term perspective. In particular, market breadth is presenting a mixed picture.
The top panel of the chart below shows the SP 500 Advance-Decline Line, which is not showing any negative divergence against the index. I prefer using this indicator over the more popular NYSE A-D Line as the former has the same components as the index and it is therefore an apples-to-apples breadth comparison. However, other breadth metrics, such as % bullish and % above their 50 dma, are exhibiting negative divergences against the index. On the other hand, the longer term % above their 200 dma is range bound. I interpret these readings as the intermediate term bull trend being intact, but the market may need to pause and consolidate its gains.
The chart below of the NYSE common-stock McClellan Summation Index (middle panel) is also flashing a cautionary signal. The index is exhibiting a negative divergence against the SPX, though that is not necessarily very worrisome as past negative divergences have not resolved bearishly. More problematical is its stochastic (top panel) not oversold enough to signal a bottom. The NYSE McClellan Summation Index (bottom panel, which includes all NYSE issues such as closed-end funds) is only starting to top out, indicating possible weakness ahead. These readings suggest that the markets are not ready to stage a sustainable rally to new highs just yet.
In addition, the latest update from Barron’s of insider activity shows that this group of “smart investors” has been selling heavily. The last episode of insider selling resolved itself with a period of sideways consolidation and minor pullback.
Arguably, the negative data point from insider activity is offset by the news that Warren Buffett, another “smart investor”, had bought $12b of equities since the election.
Measuring the Trump factor
Another concern I have is the fading effects of the so-called “Trump rally”. While I believe that the main reason behind the recent equity market strength is a global reflationary rebound, there is nevertheless a Trump enthusiasm effect.
One way of measuring this “Trump factor” would be through a paired trade of long Russia, which is enjoying friendlier relationship with Washington, and short Mexico, which is being pressured by Trump on trade and immigration. As the chart below shows, this pair has strengthened since the election, but it has started to roll over in early 2017.
One of the drawbacks of using a long Russia/short Mexico pair to measure the “Trump factor” is the large differences in sector weights between the stock markets of the two countries. The Russian market is heavily tilted towards energy and mining, while the Mexican market is far more diverse. Therefore any performance difference between the Russia/Mexico pair could be attributable to sector effects, in addition to the “Trump factor”.
A better paired trade might be a long Russia/short Australia position. Like Russia, Australian market is more exposed to resource extraction industries, which mitigates much of the sector effects found in the Russia/Mexico pair. In addition, Australia is highly sensitive to the Chinese economy, which is another country that is likely to come under pressure from the Trump administration. As the chart below shows, the Russia/Australia pair does not have the upward sloping bias of the Russia/Mexico pair, which may be indicative of a partial neutralization of sector effects. The pairs trade did rally in the aftermath of Trump’s electoral win, but it has steadied and it began to trade sideways starting in December.
Bottom line, the Trump rally is fading.
Rolling corrections = Consolidation?
In light of the above analysis, a case could be made for the stock market to consolidate and trade sideways as it digests its post-election gains. Under such a scenario, a rolling correction is the most likely outcome. As leadership sectors weaken, other sectors rise and take up the baton of market strength. Under these circumstances, the key to market direction would be the weights and performance of weakening sectors and emerging sectors within the index.
In a previous post, I highlighted the phenomena of the rolling sector correction (see The contrarian message from rotation analysis). As the RRG chart below shows, emerging sectors (Consumer Staples, Healthcare, and Utilities) comprise 26.2% of the weight in the index. Weakening sectors (Energy, Financials, and Industrials) comprise 32.0%. On a net basis, the index weight of the weakening sectors beat the emerging sectors by 5.8%, which argues for a bout of limited market weakness.
However, if the Technology sector, which is in the “lagging quadrant” and a heavyweight at 21.3% of the index, were to be re-defined as an “emerging sector”, the relative weight of rising sectors would overwhelm the relative weight of weakening sectors. In that case, the market could rally to new highs. Indeed, the relative performance of this sector appears to be highly constructive and supportive of such an outcome.
The week ahead
I have no idea what the stock market will do in the short-term. The above intermediate term analysis indicates that, barring any major White House policy or geopolitical surprises, any correction is likely to be shallow.
Here are some questions to ponder in the days ahead:
The SPX briefly violated an uptrend line last week. Further violations will likely signal a period of sideways action or mild correction.
The absolute level of the VIX Index (bottom panel) is low. Watch for rallies of the VIX above its upper Bollinger Band (BB) as potential short-term buy signals (see my VIX study in Watching the USD for clues to equity market direction).
Also watch for expansion of the VIX BB. That could also be a signal of rising uncertainty and sideways choppy market action.
Can a major sector like Technology strengthen sufficiently to take the mantle of market leadership? Can Financials turn around in light of Trump’s dismantling of the Dodd-Frank regulatory regime, or both? These heavyweight sectors have the potential to push the major market averages to new highs.
My inner investor remains bullishly positioned and he is overweight equities. My inner trader is also long the market, but he has some dry powder to buy any possible dips.
Wikipedia explained the island reversal formation this way:
In stock trading and technical analysis, an island reversal is a candlestick pattern with compact trading activity within a range of prices, separated from the move preceding it. This separation is said to be caused by an exhaustion gap and the subsequent move in the opposite direction occurs as a result of a breakaway gap.
I had grown up with trading aphorisms and folklore like this, so I decided to test out whether the island reversal formation had any trading information. The results were surprising, and it was another lesson in how asymmetric signals were at tops and bottoms (see The ways your trading model could be leading you astray).
Asymmetry strikes again
My study used the daily open, high, low and close data of the SPX going back to January 1, 1990. I looked for instances of island reversals and calculated the returns of each episode. There were, on average, 1.5 reversals per year. As the table below shows, the results were surprising.
Bullish reversals, where the island reversed upwards, did not perform very well. The index saw a one day bounce and went on to underperform going out about a week. Bearish reversals performed a lot better than expected. Absolute returns were positive whatever time horizon you chose, though the index underperformed on a 2-3 day time horizon.
This gave me another lesson in the asymmetry of trading models. In the current instance, we are ending the three day underperformance window. If history is any guide, then stock prices should see better returns in the days ahead.
Mid-week market update: With stock prices pulling back to test its technical breakout to record highs, it is perhaps appropriate to watch other asset classes for clues to equity market direction, especially on a day when the FOMC made its monetary policy announcement.
From a cross-asset perspective, there is much riding on the direction of the USD. As the chart below shows, the USD Index has weakened after making a high in December. It is now testing a key support zone, as well as a Fibonacci retracement level. Despite the pullback, the uptrend remains intact.
The other panels of the chart shows the UST 2-year yield and its rolling 52-week correlation with the USD. As well, I show the price of gold and its rolling correlation to the USD. The correlation charts show that the relationship between the USD and these two assets have been remarkably stable. The USD has been positively correlated to interest rates, as measured by the 2-year UST yield, and inversely correlated to gold prices.
As well, please be reminded that gold and equity prices have recently shown a negative correlation. In the past few months, stock prices have risen when gold fell, and vice versa.
With these cross-asset, or inter-market, relationships in mind, what happened to the USD in the wake of the Fed announcement?
Nothing. Sure, the greenback weakened a bit in response to the FOMC decision, but soon bounced back. The same could be said of interest rates, and stock prices.
That leaves investors and traders waiting for a decisive break for clues to stock market direction. Equities are mildly oversold, but my metrics of risk appetite remains in an uptrend. I am inclined to give the bull case the benefit of the doubt, but with reservations.
A mildly oversold condition
Regular readers know that I watch the VIX Index closely for clues of short-term market direction. As the chart below shows, past instances when the VIX Index has risen above its upper Bollinger Band (blue lines) have been reasonably good buy signals. Interestingly, the opposite condition, when the VIX has fallen below its lower BB (red lines), have been less useful as sell signals (see my past comment about asymmetric signals in How your trading model could lead you astray). The market got close to a buy signal on this indicator on Tuesday when it traded above its upper BB, but did not close there.
I conducted a study of this signal going back to 1990 shows that the market tends to see an oversold bounce under these conditions.
Even relaxing the rule to the VIX rising above 1.5 standard deviations, instead of the usual 2 standard deviations in BB analysis, showed positive results. Call this a mild oversold condition, which is what happened on Tuesday.
Indeed, analysis from Index Indicators confirm my assessment of the market’s mild oversold condition. This chart of stocks above their 5 day moving average (1-2 day time horizon) shows a mild oversold reading, with the caveat that oversold markets can get more oversold.
This chart of net 20-day highs-lows, which is a trading indicator with a 1-2 week time horizon, also shows a mild oversold condition where stock prices have bounced in the past.
In addition, measures of risk aversion shows that their uptrends remain intact.
In conclusion, the SPX mildly oversold, risk appetite still bullish, and testing a key support zone centered at 2270. I am therefore inclined to give the bull case the benefit of the doubt.
However, my inner trader will be carefully watching these bearish tripwires over the next few days.
This is the second in an occasional series of posts on how to build a robust investment process. Part 1 was addressed to the individual investor and trader (see The ways your trading system could lead you astray). This posts explores the issues that face the professional and institutional investor.
I had illustrated in the past why managers closet index. That`s because even a single misstep in an individual position could sink portfolio performance (see How Valeant revealed the dirty little secret of fund management). In this post, I would like to focus on how style and factor exposures affect business risk.
I recently came upon a study by Research Associates, which showed the tradeoffs between investment returns and business risk. The authors modeled a series of hypothetical portfolios with different styles, namely value, growth, momentum, quality, and random selection, which they called the “4 Orlandos”, for the period 1967-2016. As it turns out, the styles that showed the best performance also had the highest chance of getting a manager fired.
The termination criteria for a manager (which they called an “agent”) is detailed below and roughly reflects the patience level of institutional sponsors:
We select two highly stylized rules for a hypothetical investment board to use in evaluating the agent’s performance:
1) Fire the agent if more than 50% of funds selected by the agent underperform the benchmark in a given period.
2) Fire the agent if the equally weighted portfolio aggregated from the selected funds underperforms the benchmark by more than 1%.
In the light of these results, the big question for institutional investors is, “We all want good performance, but how far do you want to stick your neck out?”
When should you fire a manager?
Imagine that you are a hypothetical board member of a pension or endowment fund. You are reviewing the performance of a value manager, which is shown in the chart below. As the top panel of the chart shows, the manager underperformed the index for three years since 2009 and returns have been roughly flat ever since. Is there any reason to be patient with this manager? The initial knee-jerk reaction to this analysis is the board has been far too patient with this manager and it’s time for a new one.
The manager’s name is Warren Buffett.
The bottom panel of the chart shows a better picture, as Buffett has been steadily beating his style benchmark, the Russell 1000 Value Index. Nevertheless, the bottom chart begs the question of whether the board should be patient with this particular investment style.
Your pain threshold isn’t your client’s pain threshold
Take the example of the value manager. According to the Research Associates study, long-term returns have been stellar over the study period, but the manager is taking a 30% chance of getting fired over any single three-year horizon. I have met a number of dyed-in-the-wool managers of various styles who steadfastly refuses to change their stripes, arguing that “our clients hire us for style X”. But time horizons are shortening very quickly in this business, and the investment risks that the manager takes in his portfolio may not be compatible with the goal of business survivability.
In other words, your pain threshold is different from your client’s pain threshold. A CIO may choose to construct a portfolio with certain style and factor tilts in order to maximize the returns to his style and investment approach, but he also has a responsibility to the employees of the firm. Do the employees want to take the same level of business risks that the CIO wants to take? During the difficult periods of performance, the firm may have to downsize and people will lose their jobs (as an example, see Grantham’s GMO cuts 10% of workforce as assets shrink). Are the employees’ pain thresholds the same as the CIO’s?
The rush into passive funds
In addition, the investment industry faces a challenge as investors re-allocate their cash flows into index funds and ETFs. This chart from the Investment Company Institute’s 2016 Investment Company Fact Book tells the story.
Equity Fund cash flows
This trend of a wholesale re-allocation from active to passive funds raises a few questions, with my thoughts in brackets:
Much of the allocations are based on robo, or robo-like algorithms. Will investors be disciplined enough to buy back into equities in the next bear market? [Knowing human nature, probably not]
If not, then will the next bear market be the acid test for active management? [Best guess: Yes]
If your answer to the above question is “yes”, will you survive long enough in the profession to see that turn?
Controlling business risk
Investment fads go in cycles. There is no doubt that if you have the combination of a successful investment discipline and enough patience from investors, you will prosper as an investment professional.
Stop me if you’ve heard a story like this. In my youth, I met a successful investment manager. Let’s call him M. M began working as a trust officer, and over the course of time, cultivated a lot of relationships and gathered many clients. He eventually struck out on his own and founded his own investment firm. Returns were good, and success followed. When I met him, M was the “it” manager and assets were rushing in the door as people clamored to become his clients. Then events started to spiral downwards. M made a big bet on the bond market and performance suffered. He was so sure of his conviction that he doubled down on his exposure. It didn’t work. Clients left and the firm eventually shut its doors. A number of years later, I spoke to one of his former partners who ruefully told me, “Our biggest mistake was we were out past the 90th percentile in bond allocation when compared to the SEI median”.
In other words, M showed the courage of his conviction and the firm went over a cliff. For us mortals not named Buffett, we have to manage business risk in order to survive into the next cycle.
There are a number of ways that I can suggest to control business risk and enhance returns, all without changing your alpha generation secret sauce:
Set an investment benchmark that reflects your business risk: For example, if you are a manager of a certain style that is also evaluated against the market benchmark, why not set your neutral weight between your median competitor’s weight and the market benchmark weight? That way, you will beat either your competitor or the market.
Distill and control your bets: Identify what you are good at and maximize your intended bets to a specified risk level. Then minimize or eliminate your unintended bets.
Optimize your trading to fit your style: Trading is often relegated as an afterthought in many investment firms, but it is an essential part of the investment process. Optimize the way you trade based on the reasons why you are trading. Sample reasons include alpha generation (information trading), risk control and cash re-allocation (information-less trading). Treat each trade differently. The spread between a top quartile and median manager for a large cap US equity mandate over a 10-year time horizon comes to about 1%. A good trading desk that can squeeze 50bp out of trading can mean the difference between below median and above median performance.
Portfolio implementation and shortfall analysis: I find that an organization learns the most when it encounters subpar performance. That’s when the investment team pores over its analytics and finds the places where it fell short.
Process integration: Ask yourself if all parts of the investment process work together like a well-engineered Deming Process, or did they clash with each other? Did the portfolio construction process undo many of the intended bets that came out of alpha generation? Was the trading desk not properly incentivized, or did it mis-understand the reasons for trading and left performance on the table?
This is just a basic outline, but it should be enough to get anyone started.
For anyone who is interested, I am also part of a consulting practice that conducts investment process tuneups that optimizes investment performance without any changes in the formulation of the “secret alpha generation sauce”. We also offer other services, such as estimating the macro exposure of your competitors in real-time so that managers can better control the business risks in their portfolios. For more information, please contact Ed Pennock at Pennock Idea Hub.
I had been meaning to write about a preview of the upcoming FOMC meeting. Here are the elements of the Yellen Labor Market Dashboard, courtesy of Bloomberg.
As you can see, many of the components have either fully or nearly recovered from the depths of the GFC, with the glaring exception of a subpar labor force participation rate. These factors put pressure on the Fed to start normalizing rates.
However, there is one important exception that may cause the Fed to have a slightly more dovish tilt than the market expects.
Stalling PCE inflation?
The chart below depicts Fed Funds rate, along with the number of times in the last 12 months that the annualized monthly core PCE, the Fed`s preferred inflation metric, is above the inflation target of 2%. Historically, the Fed has tended to start rate hike cycles when the count hits six.
I have been watching this chart for some time, and the count has been stalled at 5 for five months. December`s annualized monthly core PCE came in at 1.4%. November was 0.2%. In fact, most of the clusters of high readings occurred about a year ago, in January and February 2016. If the January 2017 rate comes in at below 2%, then the count will drop from 5 to 4; and from 4 to 3 if the February figure is tame.
Even if core PCE inflation were to start to come in “hot” in the next few months, these readings suggests that we may have to wait until the May-June meetings before seeing the next rate hike.
Wow, Trump’s political honeymoon didn’t last very long! In the past few days, there have been numerous objections of Trump’s Executive Orders. I’ll spare you the details of the protests and demonstrations, particularly from the Left. What stood out were the objections from the Right and within the GOP. As an example, Eliot Cohen, who served under Condeleeza Rice, fretted about the threats that Trump posed to the American Republic:
I am not surprised by President Donald Trump’s antics this week. Not by the big splashy pronouncements such as announcing a wall that he would force Mexico to pay for, even as the Mexican foreign minister held talks with American officials in Washington. Not by the quiet, but no less dangerous bureaucratic orders, such as kicking the chairman of the Joint Chiefs of Staff out of meetings of the Principals’ Committee, the senior foreign-policy decision-making group below the president, while inserting his chief ideologist, Steve Bannon, into them. Many conservative foreign-policy and national-security experts saw the dangers last spring and summer, which is why we signed letters denouncing not Trump’s policies but his temperament; not his program but his character.
Precisely because the problem is one of temperament and character, it will not get better. It will get worse, as power intoxicates Trump and those around him. It will probably end in calamity—substantial domestic protest and violence, a breakdown of international economic relationships, the collapse of major alliances, or perhaps one or more new wars (even with China) on top of the ones we already have. It will not be surprising in the slightest if his term ends not in four or in eight years, but sooner, with impeachment or removal under the 25th Amendment. The sooner Americans get used to these likelihoods, the better.
Cass Sunstein objected to Trump’s economic approach by invoking Fredrich Hayek:
If American conservatives have an intellectual hero, it might well be Friedrich Hayek — and rightly so. More clearly than anyone else, Hayek elaborated the case against government planning and collectivism, and mounted a vigorous argument for free markets. As it turns out, Hayek simultaneously identified a serious problem with the political creed of President-elect Donald Trump.
Sunstein worried aloud about Trump’s conservative credentials and autocratic tendencies:
In “The Road to Serfdom” and (at greater length) in “The Constitution of Liberty,” Hayek distinguished between formal rules, which are indispensable, and mere “commands,” which create a world of trouble, because they are a recipe for arbitrariness. When formal rules are in place, “the coercive power of the state can be used only for cases defined in advance by law and in such a way that it can be foreseen how it will be used.”
Like the rules of the road, formal rules do not name names. They are useful to people who are not and cannot be known by the rule-makers — and they apply in situations that public officials cannot foresee.
Commands are altogether different. They target particular people and tell them what to do. (Think Hitler’s Germany, Stalin’s Soviet Union, Mao’s China, Castro’s Cuba.) They require the exercise of discretion on the spot. As examples, Hayek pointed to official decisions about “how many buses are to be run, which coal mines are to operate, or at what prices shoes are to be sold.”
Forgive me for being cynical, but blah blah blah…None of this matters very much.
The main objective of these pages is to make money for my readers. I try very hard to divorce my investment views from my political views. As the chart below shows, the stock market can prosper under both Democratic and Republican presidents.
With that preface in mind, here are some key metrics to watch that Donald Trump needs to achieve in order to politically prosper in his first term.
The Newt Gingrich criteria
Newt Gingrich laid it all out in a recent New York Times interview:
“Ultimately this is about governing,” said former House Speaker Newt Gingrich, who has advised Mr. Trump. “There are two things he’s got to do between now and 2020: He has to keep America safe and create a lot of jobs. That’s what he promised in his speech. If he does those two things, everything else is noise.”
“The average American isn’t paying attention to this stuff,” he added. “They are going to look around in late 2019 and early 2020 and ask themselves if they are doing better. If the answer’s yes, they are going to say, ‘Cool, give me some more.’”
Bloomberg Intelligence economic criteria
Assuming that Trump can “keep America safe” (see the reactions from this recent BBC report), Bloomberg Intelligence chief economist Carl Riccadonna compiled a list of five economic metrics to watch as signs of American prosperity, all without resorting to “phony” statistics like GDP and the unemployment rate.
Prime age labor force participation rate: If prime age discouraged workers can return to the labor force in size, then score a win for Trump (if you want to follow along at home as the data updates, see this FRED chart).
Full time workers as a % of the labor force: Trump promised good jobs. That means full-time jobs (FRED chart).
Manufacturing workers in the economy: The point behind bashing Mexico and China on trade was the disappearance of manufacturing jobs, which tend to be well paying. As the chart below shows, these jobs have been in secular decline. Can they come back? (FRED chart)
Capital expenditures: One of the puzzles of this economic expansion has been the tepid pace of capital expenditures. Trump’s proposal of a one-time tax holiday for the repatriation of offshore corporate cash is intended to address this problem. (FRED chart)
Net business births: Net business births is a useful bottom-up derived of economic confidence and business dynamism. Unfortunately, I can’t find any regularly reported statistics of business formation, but I have substituted the NBIB small business confidence index as a proxy (link to NFIB). Small business confidence has soared in the wake of Trump’s electoral win.
However, the rise in optimism has not been matched by any observable increase in small business sales yet. I discussed this disconnect extensively in a previous post (see Main Street bulls vs. Washington bears).
For investors, the question is slightly different. Incidents like the most recent one over objections to the ban on entry of foreign nationals from seven selected Middle East countries can serve to weaken Trump’s Congressional support among Republicans. In that case, it would either make more difficult the task of passing his promised fiscal package of tax cuts, which is a boost that Wall Street desperately wants. In the past, parties with control of the White House and both houses of Congress have struggled with passing legislation.
In conclusion, I urge my readers to cut through the political noise and watch the aforementioned five key indicators of whether Donald Trump can keep his promises to his political base. As well, keep an eye the reaction from Republican members in Congress as a measure of whether the new administration can successfully pass legislation. Then you can either go back to being jubilant (if you are a Trump supporter), or get into a rage (if you are a never-Trumper).
Preface: Explaining our market timing models
We maintain several market timing models, each with differing time horizons. The “Ultimate Market Timing Model” is a long-term market timing model based on the research outlined in our post, Building the ultimate market timing model. This model tends to generate only a handful of signals each decade.
The Trend Model is an asset allocation model which applies trend following principles based on the inputs of global stock and commodity price. This model has a shorter time horizon and tends to turn over about 4-6 times a year. In essence, it seeks to answer the question, “Is the trend in the global economy expansion (bullish) or contraction (bearish)?”
My inner trader uses the trading component of the Trend Model to look for changes in direction of the main Trend Model signal. A bullish Trend Model signal that gets less bullish is a trading “sell” signal. Conversely, a bearish Trend Model signal that gets less bearish is a trading “buy” signal. The history of actual out-of-sample (not backtested) signals of the trading model are shown by the arrows in the chart below. Past trading of the trading model has shown turnover rates of about 200% per month.
The latest signals of each model are as follows:
Ultimate market timing model: Buy equities
Trend Model signal: Risk-on
Trading model: Bullish (upgrade)
Update schedule: I generally update model readings on my site on weekends and tweet mid-week observations at @humblestudent. Subscribers will also receive email notices of any changes in my trading portfolio.
It’s not all about Trump
In the past few weeks, market analysis in these pages have been all Trump, all the time. As America`s 45th president assumed his first full week in office, his administration made a number of rookie mistakes that gave the impression of a government in disarray.
Politico reported that many of presidential executive orders were drafted by Trump aides Stephen Miller and Steve Bannon without consultation with the relevant departments or Congress. These actions made the implementation of some aspects of the executive orders difficult, impractical, or possibly illegal. CNBC reported that the Trump aides were leaking stories as a sign of infighting between different factions. Not only that, the Washington Post reported that most of the senior bureaucrats at the State Department, most of whom had served both Democrat and Republican administrations, had resigned en masse, which deprived the department of years of experience in the nuts-and-bolts of foreign policy.
So how did the stock market react to these events? The Dow proceeded to rally above 20,000 to make an all-time high, as did the SPX. This kind of market reaction in the face of negative political news is bullish. Moreover, it showed that investors and traders had turned their focus to the most important metric of equity performance, namely the growth outlook.
Indeed, analysis from Deutsche Bank showed that macro growth surprises have been the biggest driver of equity prices for the last 15 months (via Bloomberg).
The reflation trade continues
It’s earnings season, and the market is turning its focus to the earnings growth outlook. I had an inkling that Q4 earnings season was going to come in reasonably well when Thomson-Reuters observed that there were an unusually low number of negative Q4 pre-announcements:
The more positive outlook by analysts is also supported by Q4 guidance with a negative to positive ratio of 2.0, which is more positive than the long-term (since 1995) historical average of 2.7.
The latest update from John Butters of Factset shows that, with 34% of the SP 500 having reported, the earnings and sales beat rates were roughly in line with their 5-year historical averages. Despite these slightly below par beat rate readings , they improved substantially from last week’s reports. More importantly for future stock performance, the Q1 guidance rate has been upbeat when compared to its history, and forward 12-month EPS continued to rise.
Other cyclical indicators, such as the Chemical Activity Barometer that is a leading indicator of industrial production, were showing signs of strength (via Calculated Risk).
Even the Q4 GDP report turned out to be a solid result despite missing Street expectations. Much of the shortfall could be attributed to the rising USD during that period.
New Deal democrat was particularly impressed with the trend in proprietors’ income (blue line), which is a more timely proxy for corporate profits (red line):
This tells us that domestic US businesses with little exposure to foreign exchange issues continue to improve their top lines. Now that the strong 2015 US$ has disspiated, he likelihood is that corporate profits will follow. Needless to say, this is a positive for the next 12 months.
I wrote last week that I was seeing signs of a global reflationary rebound from equity and commodity prices (see Global market rally = Dow 20K). Jurrien Timmer at Fidelity Investments also saw a similar trend of a synchronized global recovery.
Is it any wonder the markets adopted a risk-on stance? The New York Fed found that there was a dramatic turnaround in Republican voters as to their outlook for the economy and stock prices. The chart below shows the net change in expectations that stock prices would be higher after the election, sorted by political leaning. While the Republicans show much greater optimism, expectations from Democrats are lower but still positive.
This evidence of the reawakening of “animal spirits” raises the odds of a market melt-up in 2017 (see my post last week Could “animal spirits” spark a market blow-off?). This chart from Jeffrey Kleintop at Charles Schwab shows that individual investors have shown a habit of chasing returns. As equity returns start to improve, watch for the equity stampede to begin.
Breakout or fake out?
Still, I have this nagging feeling that we may be seeing a false upside breakout and what we are seeing is a bull trap. Jeff Hirsch of Almanac Trader found that stock prices tend to make a short term peak in early February in the first year of a new presidential term, followed by a correction into March. This seasonal analysis suggests that the market high window will occur some time next week.
This chart from Dwaine van Vuuren of Recession Alert (via Jeff Miller) shows that the readings of weekly leading indicators are at extreme level. Could these signs of macro improvements be as good as they get?
The same could be said of the Citigroup US Economic Surprise Index, which measures whether economic releases are beating or missing expectations (annotations are mine).
In addition, the wildly bullish tone of Barron’s front page and lead story flashed a contrarian sell signal.
As well, the latest update of insider activity from Barron’s shows that this group of informed investors were not showing confidence in the market. To be sure, the last episode of high insider selling resolved itself in a sideways market with little upside.
By contrast, Mark Hulbert highlighted an insider study by Nejat Seyhun, which eliminates trading activity by large holders of stock, that came to a bullish conclusion.
What are to make of these conflicting conditions? Are we seeing an honest to goodness upside breakout that will take stock prices to further new highs, or is this a fake out, which will be followed by a February correction? I have no idea. Sometimes you are faced with two contrary scenarios, they defy analysis, and you have to be open to all outcomes.
Who knows, maybe mommy really is a superhero.
The week ahead
Here are some of the signs that I am monitoring in the week ahead. Market internals of risk appetite are holding up well so far. Any breaches of these relative uptrends would be a signal of the start of a correction.
The behavior of high yield, or junk, bonds is also confirming the narrative of a rising risk appetite. Similarly, I am watching for negative divergences, which have not occurred so far.
The SPX broke out to new highs early last week and the index has consolidated sideways. It would be no surprise to see it pull back to test the breakout level at 2280. Should stock prices race ahead and melt up, I am watching if the VIX Index (bottom panel) breaks down through its lower Bollinger Band. Such episodes have typically marked overbought conditions and short-term tops.
I am also monitoring the copper/gold ratio for signs of faltering macro momentum. This ratio is important as copper has both cyclical and hard asset characteristics, compared to gold, which is mostly a hard asset play. Should this ratio roll over, then it will be a real-time signal of faltering macro growth momentum.
My inner investor remains bullishly positioned. My inner trader covered his short SPX position last week and nervously went long the market.
Disclosure: Long SPXL
About cookies on this site
Our site uses cookies and other technologies so that we, and our partners, can remember you and tailor your user experience on our site. See our disclaimer page on our privacy policy, how we manage cookies, and how to opt out. Further use of this site will be considered consent.