Preface: Explaining our market timing models
We maintain several market timing models, each with differing time horizons. The “Ultimate Market Timing Model” is a long-term market timing model based on research outlined in our post Building the ultimate market timing model. This model tends to generate only a handful of signals each decade.
The Trend Model is an asset allocation model which applies trend following principles based on the inputs of global stock and commodity price. This model has a shorter time horizon and tends to turn over about 4-6 times a year. In essence, it seeks to answer the question, “Is the trend in the global economy expansion (bullish) or contraction (bearish)?”
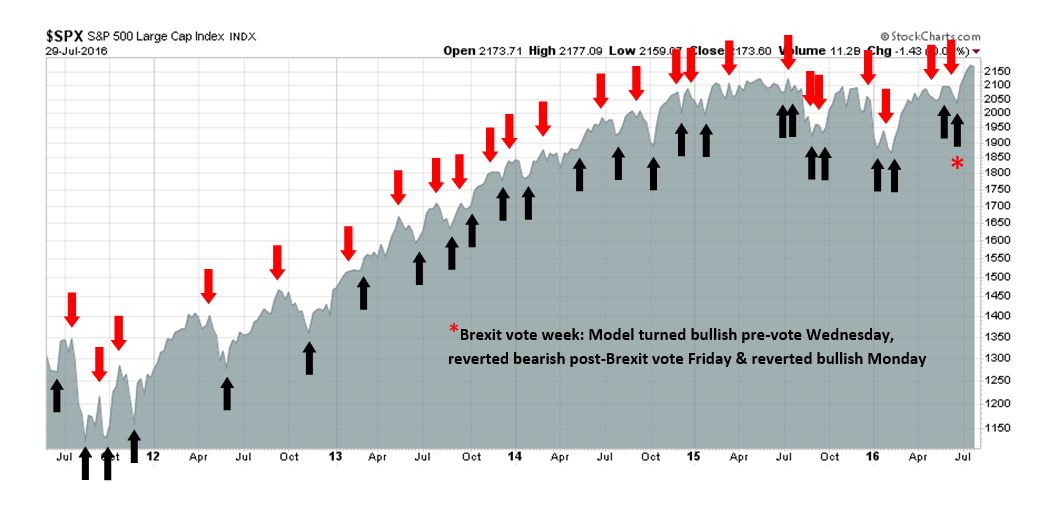
My inner trader uses the trading component of the Trend Model to look for changes in direction of the main Trend Model signal. A bullish Trend Model signal that gets less bullish is a trading “sell” signal. Conversely, a bearish Trend Model signal that gets less bearish is a trading “buy” signal. The history of actual out-of-sample (not backtested) signals of the trading model are shown by the arrows in the chart below. Past trading of the trading model has shown turnover rates of about 200% per month.
The latest signals of each model are as follows:
- Ultimate market timing model: Buy equities
- Trend Model signal: Risk-on
- Trading model: Bullish
Update schedule: I generally update model readings on my site on weekends and tweet any changes during the week at @humblestudent. Subscribers will also receive email notices of any changes in my trading portfolio.
A brighter tomorrow
No, the “brighter tomorrow” of the title does not refer to the better future promised by American politicians during this election season, but the brighter future for equity prices over the next 6-12 months. It appears that the market bubble scenario that I outlined a few weeks ago is well on its way to becoming a reality (see How to get in on the ground floor of a market bubble). The following factors are combining to create an environment that could see the market melt-up:
- Positioning: Investors have been caught leaning the wrong way. They are just starting to play catch-up, but sentiment remains overly skeptical.
- Growth surprise: A US recovery has caught most people off-guard (though I in the minority when I was bullish during the market panic in January, see Buy! Blood is in the streets!).
- Central bank accommodation: The Federal Reserve has been ultra-cautious in its policy of interest rate normalization, which is an enabling factor for equity price gains.
A skeptical market
Intermediate-term sentiment models are showing a high level of skepticism despite the SPX bouncing around in a narrow range within 1% of its all-time high. The groupings of sentiment can be divided into four categories, of which three are flashing contrarian bullish signals:
- Retail: Neutral to mildly bearish, indicating skepticism about the rally to all-time highs
- Advisors: Very bullish, all-in
- Institutions: Still cautious
- Hedge funds (fast money): Bearish
Let’s start with the retail investor and trader. With the market touching all-time highs, can someone please explain to me why Rydex fund flows are tilted towards a mildly bearish reading and AAII sentiment is neutral? Moreover, why does AAII bullish sentiment (bottom panel) fall after only a couple weeks of sideways consolidation? Are individuals that skittish?
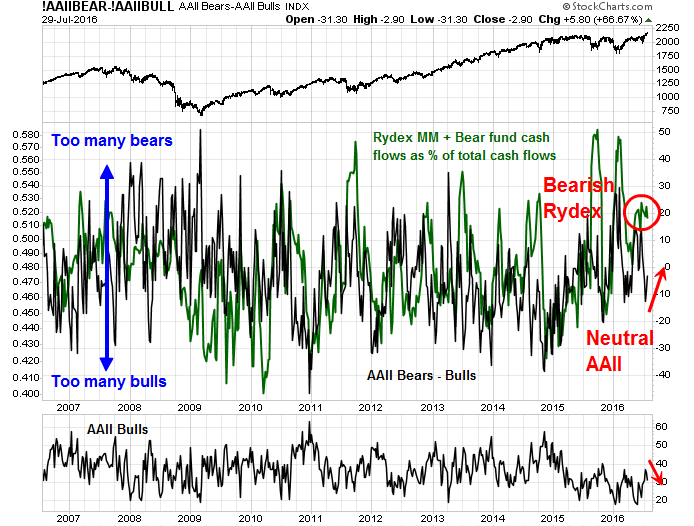
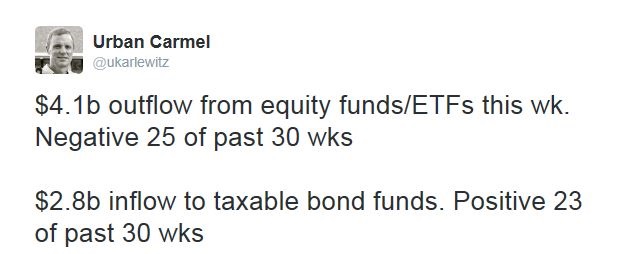
Urban Carmel also pointed out that last week’s mutual fund and ETF flows resumed their defensive tone again. Market tops tend to be characterized by buying stampedes, not switches from equity into bond funds.
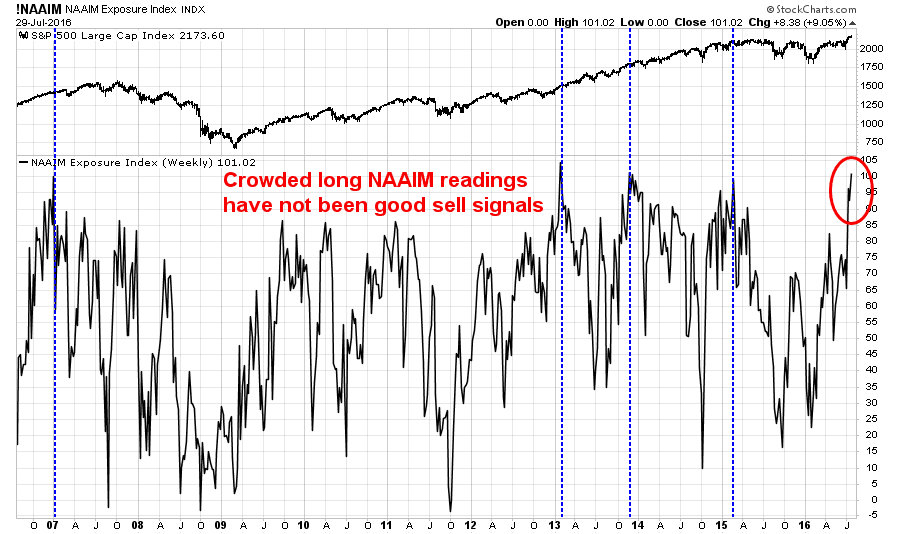
To be sure, the NAAIM survey of RIA sentiment shows that advisors are extremely bullish, but the historical record shows that past crowded long readings have not been very good contrarian sell signals.
As for institutional sentiment, I detailed last week how the BoAML Fund Manager Survey (FMS) showed global institutions were neutrally weighted equities and they were madly buying US stocks, which set up the potential for a FOMO (Fear Of Missing Out) rally (see In the 7th or 8th inning of the bull market).
Additional anecdotal evidence of excessive institutional cautiousness came from Andrew Garthwaite of Credit Suisse. Garthwaite had turned cautious on equities last December, but when he made the rounds of institutions in the US, Europe and South Africa, he found that institutional accounts were on the whole even more bearish that he was.
Clients are close to being as bearish on equities as we can remember. Clients do not find equity valuations attractive enough to compensate for the macro, political, earnings and business model risks. We think that clients are too pessimistic. The ERP is marginally cheap (on our model) while bonds, credit and real estate look abnormally expensive. Liquidity and positioning are also supportive of equities.
He also found that a lot of people were grumpy and lost because of subpar returns.
We have come across almost no one who seems to have outperformed or made decent returns this year. Data from Morningstar suggests, for example, that in the year to July 1st, just 29 out of 242 funds in the Investment Association UK All Companies sector beat the performance of the FTSE All Share. Moreover, the Dow Jones Credit Suisse Long/Short equity index, which tracks hedge fund performance, fell by 5% year-to-date. In passing, we have never had so many client meetings starting with statements such as ‘we are totally lost’.
In effect, institutions were bearish and got caught offside by the post-Brexit risk-on environment. Garthwaite, who had been bearish, concluded that it was time to turn contrarian bullish for the following reasons:
- The lack of an alternative (“government bonds, corporate bonds and real estate appear very expensive in most parts of the world” and “the riskless return on bonds is in our view becoming returnless risk, driving investors into other instruments”);
- Positioning (“the non-financial corporate sector in the US has bought $2.6trn of US equity since the market low in Q1 2009… or c.15.0% of market cap… while households have sold c.$62bn and institutions have sold by c.$1.1trn of equities over the same period”);
- Excess liquidity is still strong; and
- We might (just might) actually get an easier fiscal policy (fiscal QE is mentioned) at some point.
With individuals and institutions off-side on their positioning in the face of a growth surprise, the potential for a FOMO melt-up is high.
The growth surprise continues
Early last week, Bill McBride at Calculated Risk wrote a post called The Future is still Bright. In that post, he outlined the macro conditions that are still supportive of growth. McBride cited the following positive factors for US economic growth:
- Progress in residential construction and housing starts, which are the best leading indicator for the economy;
- State and local governments have stopped shedding jobs and they’re starting to hire again, which is positive for employment;
- A better outlook for the US federal deficit;
- The end of household deleveraging as debt service ratios hover near record lows. Household debt is rising again, which fuels consumer spending;
- Positive labor force demographics, as the prime working age group is rising again; and
- Improving life expectancy.
Near-term, the Q2 GDP miss that was announced Friday morning was a blemish to my growth surprise scenario. Headline Q2 GDP came in at an anemic 1.2%, which was a huge miss compared to the consensus 2.6% expectation.
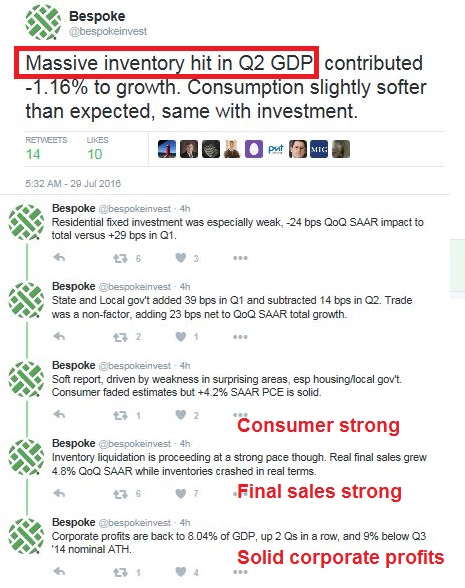
However, an analysis of the internals show that Q2 GDP wasn’t that bad. Most of the miss can be attributable to a negative inventory adjustment, while consumption remains extremely strong.
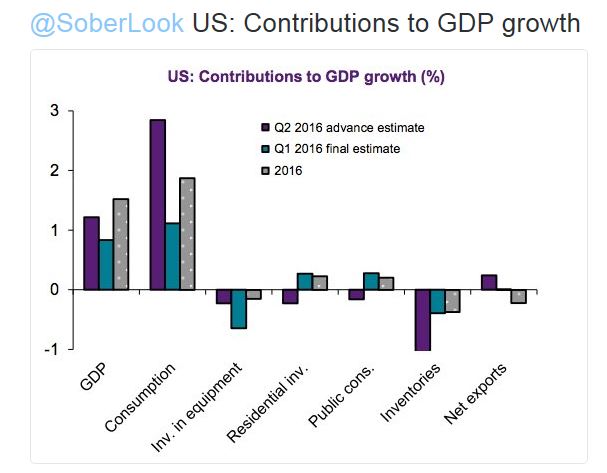
Here is how Bespoke broke down the components of the Q2 GDP report (annotations in red are mine):
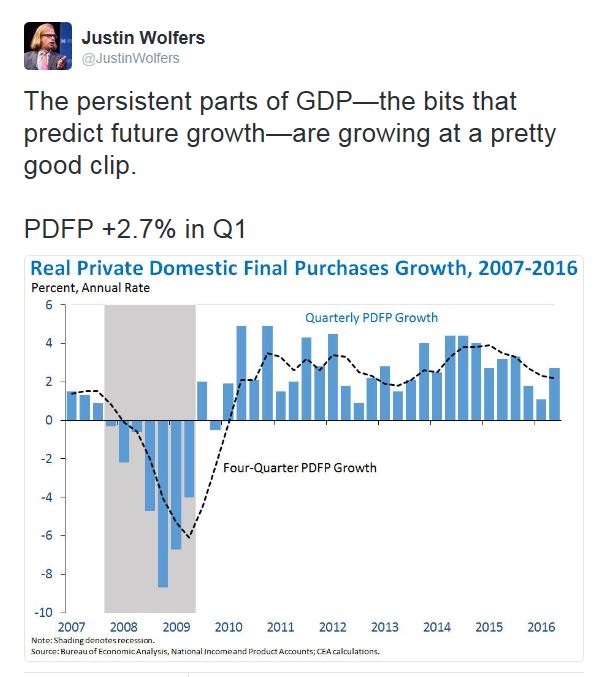
More importantly, final demand was healthy (via Justin Wolfers).
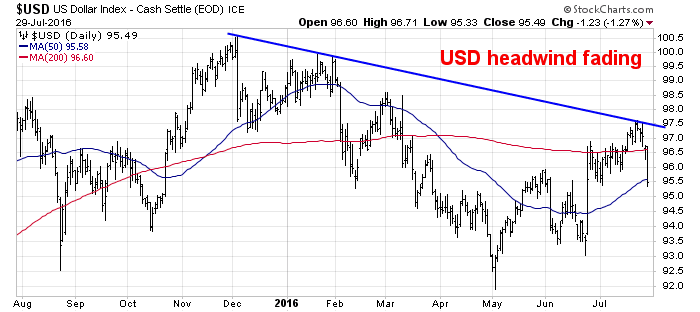
Despite the disappointing headline Q2 GDP figure, the growth story appears to be intact. The one silver lining of the GDP miss has been the weakness in the US Dollar. USD strength had posed a headwind to corporate earnings growth and the USD Index had neared a key resistance level a week ago. The combination of a no-surprise FOMC statement and a weak GDP report resulted in currency weakness, which alleviated my concerns about the of USD strength on the economy.
A strong earnings outlook
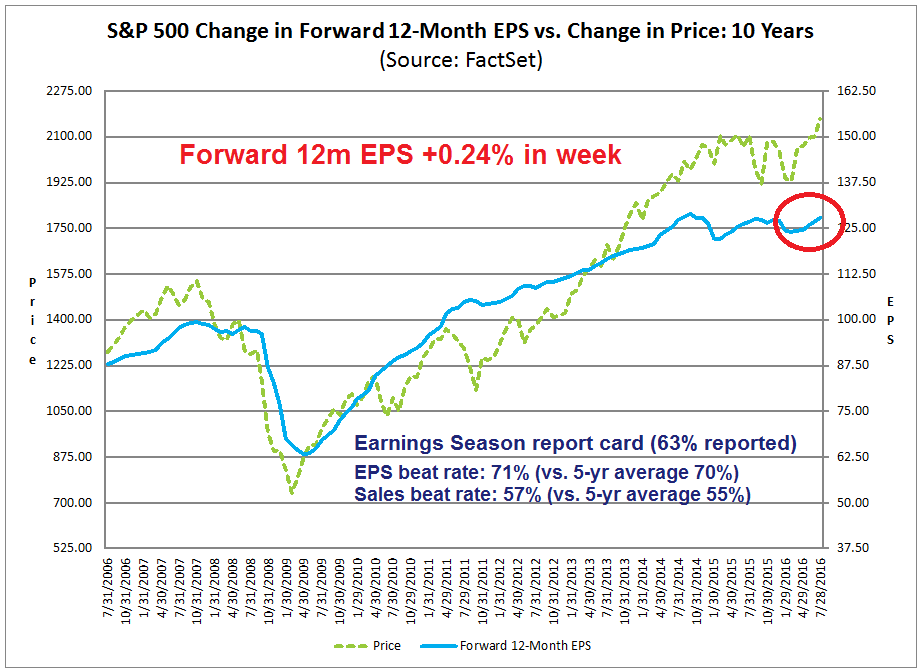
Switching focus from top-down macro economic analysis to bottom-up company analysis, the latest update from John Butters of Factset shows earnings internals are also healthy. With 63% of the SPX having reported, both earnings and sales beat rates are slightly above their historical averages. Moreover, forward EPS continues to rise, which reflects continuing optimism from the Street.
The upside surprise to the operating outlook didn’t just catch investors by surprise, it caught some CEOs by surprise as well. The latest summary of earnings calls from Avondale summarized the outlook as getting less bad, which formed the basis for “the surprise”.
This Week’s Post: No One Ever Called This Expansion
Although there are a lot of reasons to be more optimistic about the global economy, CEOs this week found plenty of reasons to be pessimistic too. Even the companies that felt like they were executing well cited a slow economic backdrop, with “anemic” growth. At least it is growth though, and +1 feels good when you were running at -2 before.
A dovish Fed?
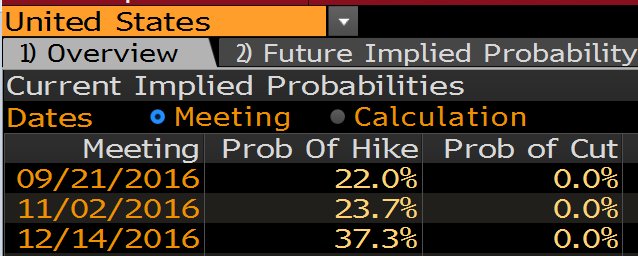
The combination of overly bearish sentiment and growth surprise form a sufficient basis for a risk-on melt-up in equity prices. Add to that mix a cautious Federal Reserve as it embarks on a tightening cycle and we have additional fuel for a bull run. In the wake of the disappointing Q2 GDP report, Fed Fund futures of a rate hike this year has dropped to 37.3%.
The instant reaction in the wake of the GDP report may be overly dovish and we should wait for more Fedspeak to get a better understanding of Fed policy. Nevertheless, the scenario of a Federal Reserve that declines to take away the punch bowl as the party gets out of hand is becoming a definite possibility. Such a policy response sets the ground for a market blow-off later this year, before Yellen et al step in to addresses the excesses created by an overly dovish policy.
Throw caution to the wind?
I am not alone in postulating a stock market mania, BCA Research recently speculated about a blow-off in global equities, citing the following possible catalysts:
First, the character of the equity market advance may shift and a rotation out of defensives and into cyclicals could transpire. Since the previous market peak, defensive stocks have handily outperformed due to the drubbing in global bond yields. As the global bond bull market goes on hiatus at least for a while – a view that BCA’s Global Investment Strategy service has posited – defensive sectors may feel the heat.
Second, investors’ perceptions of improving global growth may be enough to move the needle in the still extremely oversold and under-owned cyclical sectors.
Third, there appears to be ample sidelined cash to flow back into stocks if a bear capitulation occurs and investors throw in the towel in order to participate in an advance.
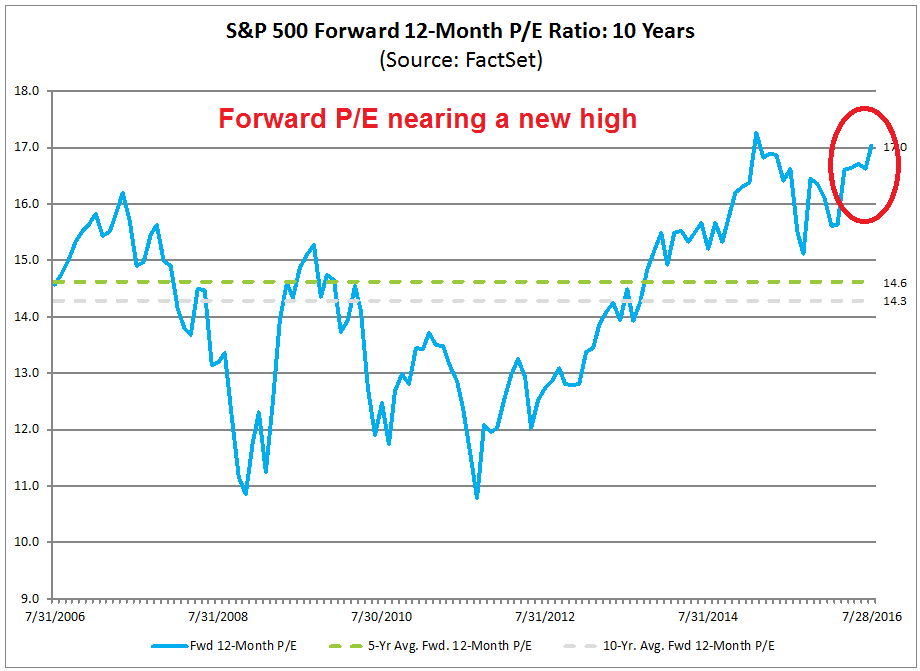
BCA Research concluded that while a market blow-off may be possible, “further equity strength should be characterized as a high-risk, liquidity-driven overshoot phase in global stocks”. I agree. Valuations are getting stretched. The latest Factset data shows forward P/E nearing a new high, which is disconcerting for value oriented investors (chart annotations are mine).
Despite these reservations, the combination of a growth surprise, wrong-footed market positioning and a market-friendly Fed may mean that it`s time to throw caution to the wind and get set for a “high-risk, liquidity-driven overshoot” in stock prices.
The week ahead: Don’t short a dull market
As the market continues to consolidate sideways, I will be tactically watching whether the SPX can break out of its trading range. In addition, I am monitoring the relative performance of the High beta ETF/Low volatility ETF pair as a measure of risk appetite (bottom panel). Should that pair break up through its relative downtrend, the risk-on upside could be substantial.
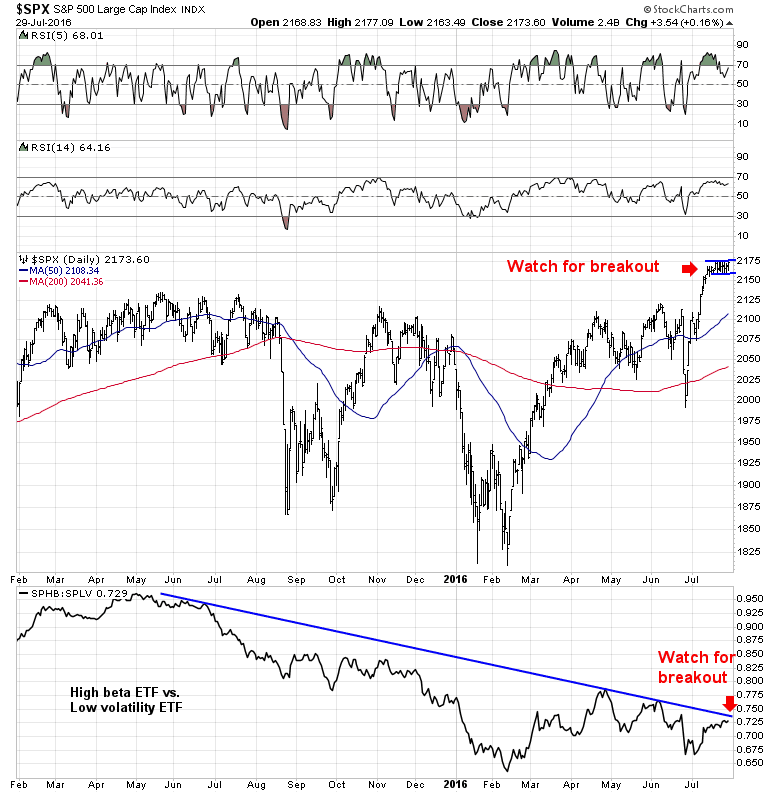
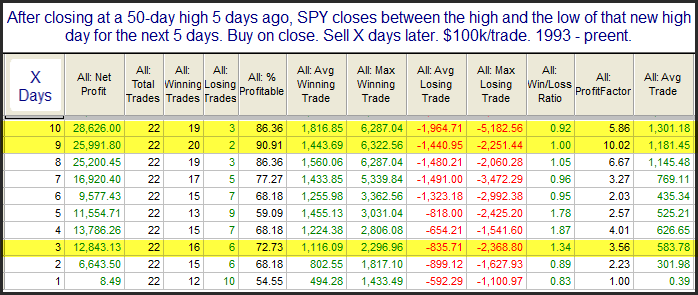
In all likelihood, the trader’s adage of “don’t short a dull market” will hold true in the current circumstances. Nautilus Research found that, historically, such periods of tight consolidations have resolved themselves to the upside.
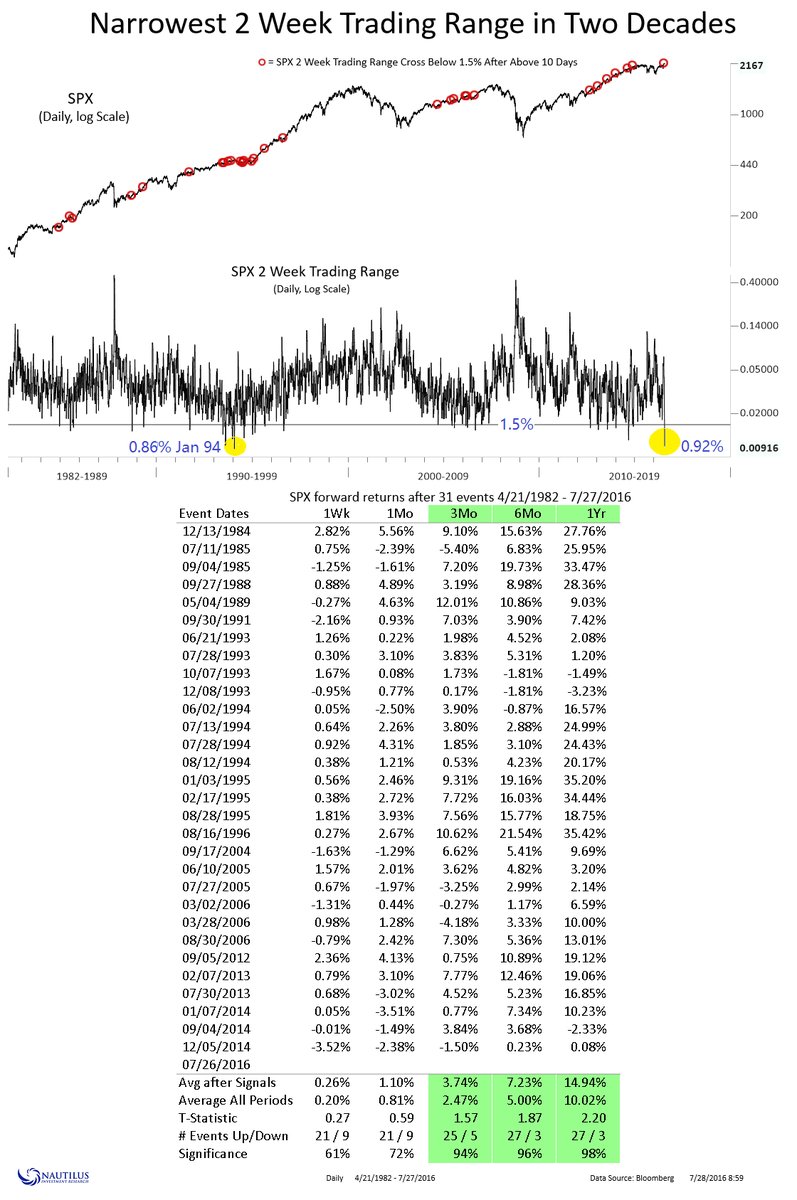
Rob Hanna at Quantifiable Edges found a similar effect when he studied past market behavior of tight consolidation after new highs.
My inner investor has been comfortably bullish on stocks for some time. My inner trader took an initial position in small cap stocks on Thursday in the belief that small caps would serve as high beta leadership for a potential advance.
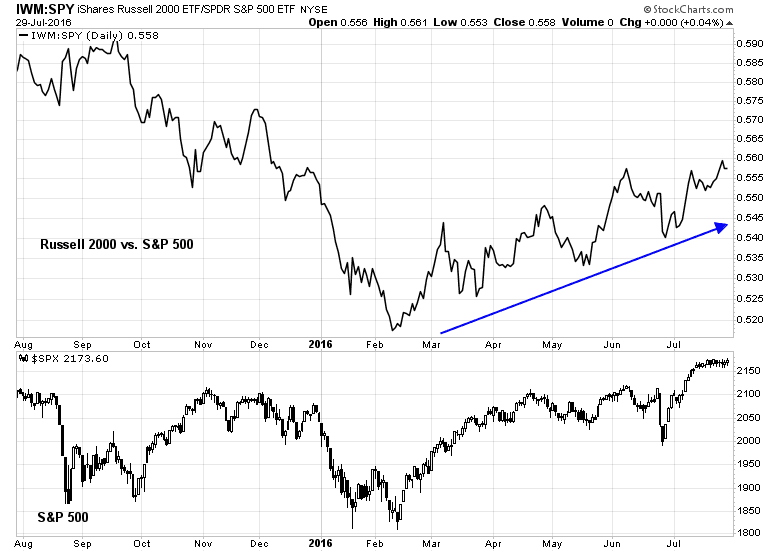
Should the market break out to the upside, he plans on adding to his long position. Should it break down, downside risk is likely to be limited, first at its 20 dma, which is rising quickly and closed on Friday at 2159. Additional secondary support exists at the breakout level of 2120.
Disclosure: Long TNA
Is it not simpler?
QE effect is at least appearing and will drive up stock prices beyond reason.
The weak GDP number will reinforce the ‘lower for longer’ meme that has been driving stocks since the new bull market started early this year.
The shock of interest rates dropping in January started a number of developments outside the simultaneous rise in bond prices. The U.S. dollar fell, dividend stocks surged, commodities and commodity currencies soared and worries about higher rates hurting the American economy receded.
These same dynamics take another surge with this latest weak GDP number indicating the Fed will stay on hold. This will carry us on the next leg in this new bull market.
From a dividend yield perspective the U.S. stock market and most other countries are very cheap. That gives lots of room for gains before bubble valuations on a yield basis come into play.
Cam, the NDX chart is outdated. the updated position actually large speculators are very very long, the biggest long since jan 2014. 120k contracts, as of 26Jul.
You are correct. I apologize for the error as I was looking at the wrong data set.
Large specs are quite long.
with TNA, I made a good 3% profit in less than a week. Thank you, Cam!