Preface: Explaining our market timing models
We maintain several market timing models, each with differing time horizons. The “Ultimate Market Timing Model” is a long-term market timing model based on research outlined in our post Building the ultimate market timing model. This model tends to generate only a handful of signals each decade.
The Trend Model is an asset allocation model which applies trend following principles based on the inputs of global stock and commodity price. This model has a shorter time horizon and tends to turn over about 4-6 times a year. In essence, it seeks to answer the question, “Is the trend in the global economy expansion (bullish) or contraction (bearish)?”
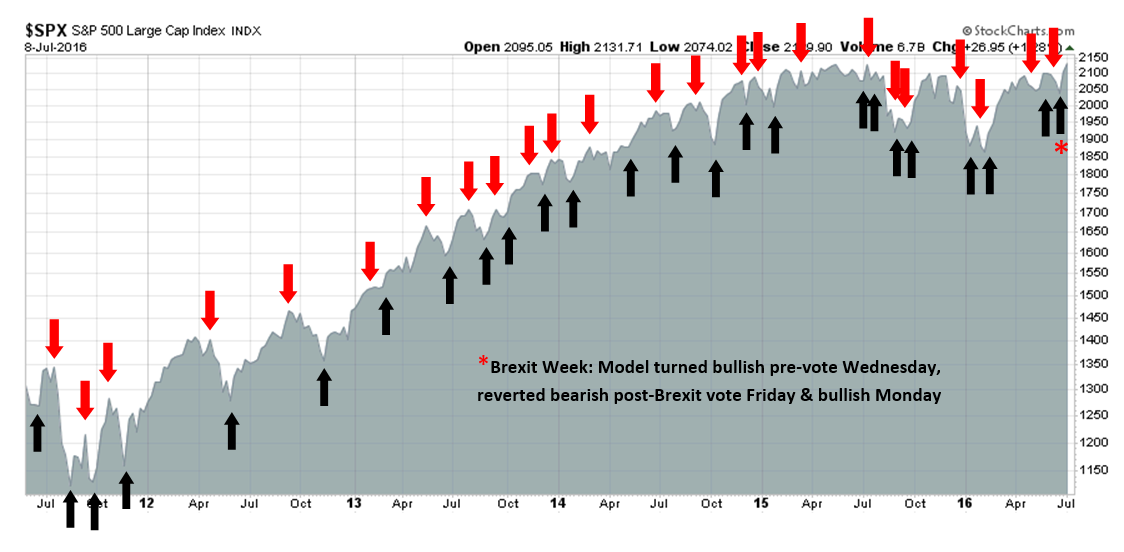
My inner trader uses the trading component of the Trend Model to look for changes in direction of the main Trend Model signal. A bullish Trend Model signal that gets less bullish is a trading “sell” signal. Conversely, a bearish Trend Model signal that gets less bearish is a trading “buy” signal. The history of actual out-of-sample (not backtested) signals of the trading model are shown by the arrows in the chart below. Past trading of the trading model has shown turnover rates of about 200% per month.
The latest signals of each model are as follows:
- Ultimate market timing model: Buy equities
- Trend Model signal: Risk-on
- Trading model: Bullish
Update schedule: I generally update model readings on my site on weekends and tweet any changes during the week at @humblestudent. Subscribers will also receive email notices of any changes in my trading portfolio.
A nascent bubble
Cullen Roche wrote an article last week in Marketwatch making the case that the US equity and real estate market is ripe for the formation of a market bubble.
What’s even more interesting is that this environment appears (at least in my view) to be ripe for a financial-asset bubble. That is, as weakness abroad drives yields lower in the U.S., stocks and real estate look increasingly attractive. Stocks have clearly benefited from this “reach for yield,” as have certain types of higher-risk bonds.
Indeed, as government bond yields turn negative around the world, US Treasury assets seem to be the only yield game in town. Investors are rewarded with the additional bonus of steady US growth. Stocks should benefit as falling UST yields translate into P/E expansion.

Roche continued:
But we haven’t seen the big boom in real estate yet (with the exception of, maybe, San Francisco). But could we be there? I am not certain, but here in Southern California the chatter is starting to get a little crazy again. As rents rise rapidly and future returns on stocks and bonds just don’t look that great, many people are turning to real estate.
The other day I was talking to one of the most rational and intelligent guys I have ever known. I was talking about all of this and how absurdly low mortgage rates are. He said: “Yes, that’s why you buy a house in today’s market and then go out and buy another one.” Now, this is an Ivy League econ PhD talking here, not your average stripper circa 2006 from “The Big Short.”
When rational people start saying irrational things, my ears perk up. And it makes me wonder (still) if we’re not on the precipice of something that looks a lot more like 1999 than 2008. Add it all together and it makes you wonder: Are we ripe for a big financial-market bubble, thanks in large part to foreign economic weakness? It might seem paradoxical, but don’t discount that risk.
While a market bubble is not my base case scenario and I don’t like to bet on market bubbles because the thesis depends on the Greater Fool Theory of investing, what Roche says deserves some consideration. I would like to expand on the points made and explore how a bubble could form based on the following factors:
- Better than expected growth
- Skeptical sentiment turning into greedy sentiment
- A market friendly Federal Reserve
The return of growth
The blowout June Jobs Report on Friday was certainly a shocker and may have signaled a more positive environment for US growth. Several days before the results were released, Jim Paulsen of Wells Capital Management made the case that stock prices were due to perk up because of better than expected growth. The Bloomberg US Economic Surprise Index, which measures whether economic releases were missing or beating expectations, was on the rise.
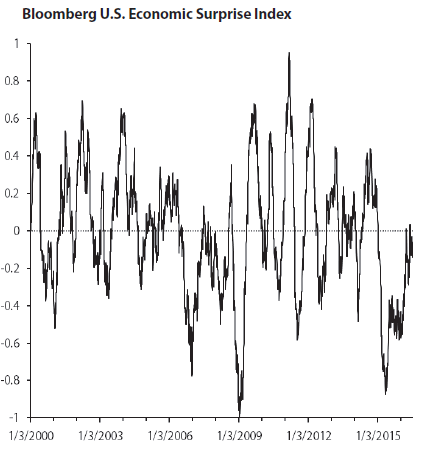
The rebound has also been confirmed by the Citigroup Economic Surprise Index:

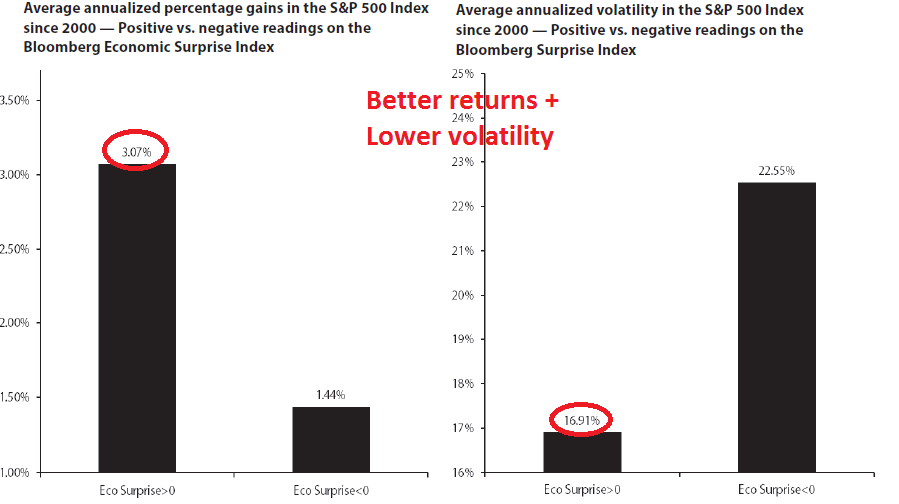
Paulsen also found that when growth surprised on the upside, equities enjoyed a favorable environment of higher returns and lower risk, as measured by volatility (annotations in red are mine).
Burt White of LPL Financial confirmed Paulsen’s findings when he found that improvements in the ISM Manufacturing Index tends to lead earnings growth by six months.
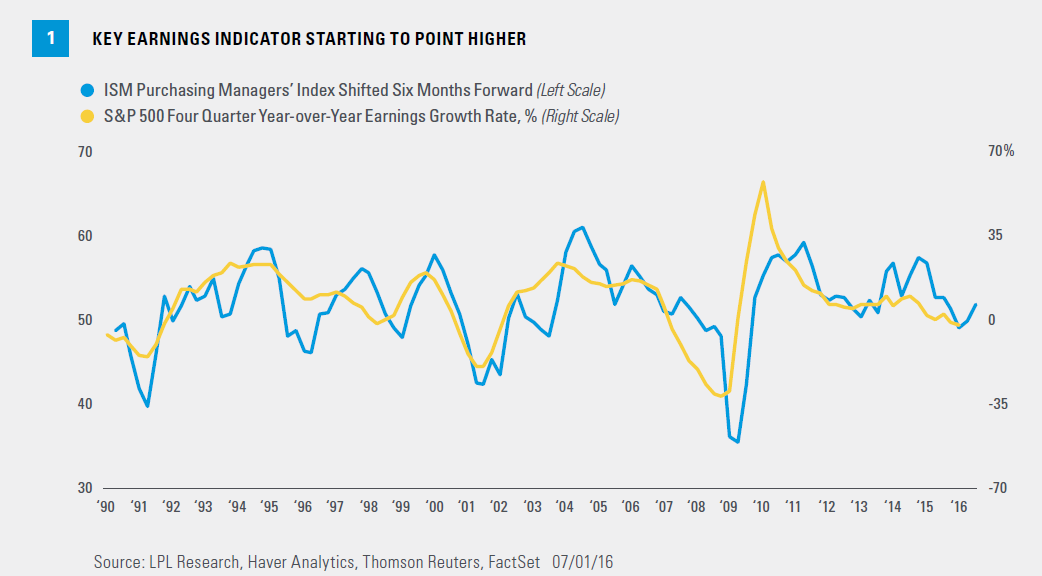
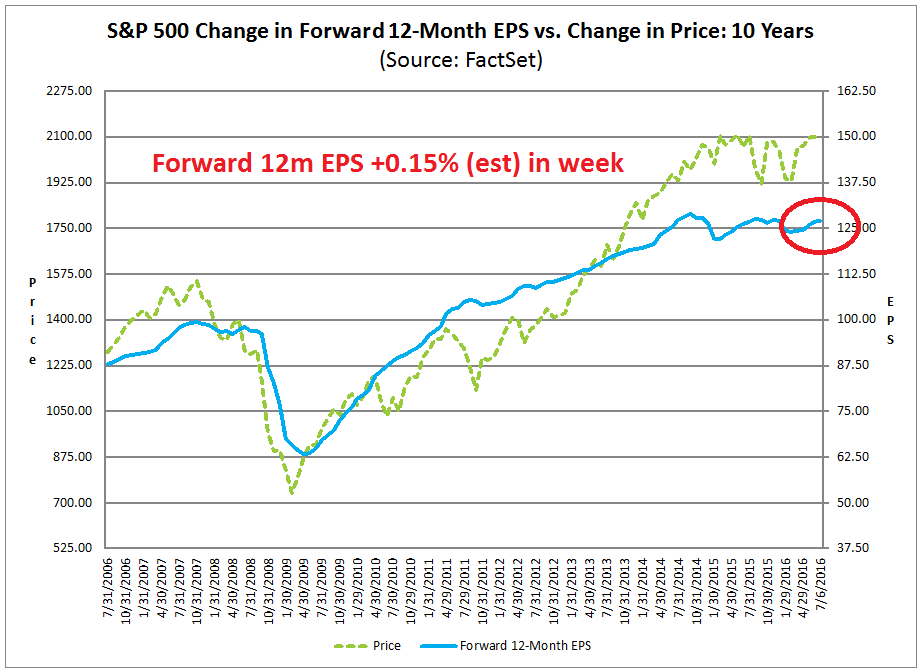
Expectations about EPS growth has so far been confirmed by the latest readings from Factset (annotations in red are mine).
How foreign money could pour into US assets
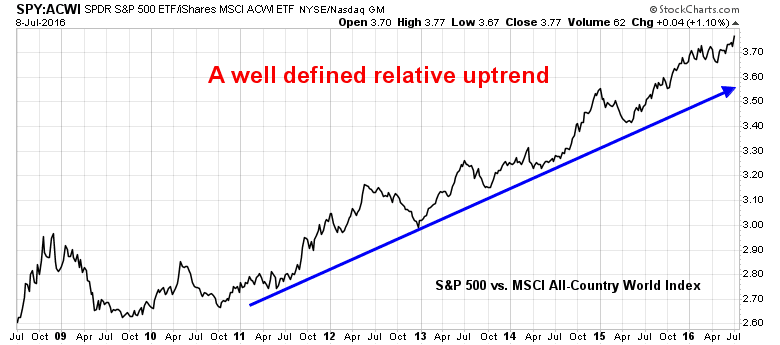
When I couple the research from Paulsen and White with the observation that the US is becoming an island of growth and stability in an uncertain world, we have a potential setup for a mad rush for US financial assets, though the WSJ reported that a recent study by the National Association of Realtors indicate that non-US buyer interest is receding, not increasing. On the other hand, portfolio flows are supported by the fact that US equities have been steadily outperforming global equities for many years..
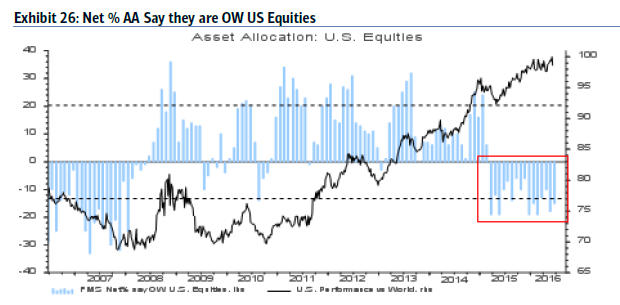
The latest BoAML Fund Manager Survey shows that global asset managers are underweight US equities.
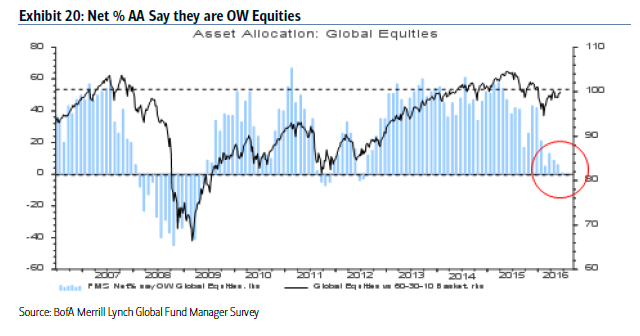
…though they are roughly neutral weight equities in general.
In short, these factors combine to create pent-up demand for US stocks from overseas.
From skepticism to irrational exuberance?
The start of an asset bubble begins with a rational reason for rising prices, such as funds flow demand from foreigners for growth and stability. It first feeds on disbelief and ends with rising greed and irrational exuberance.
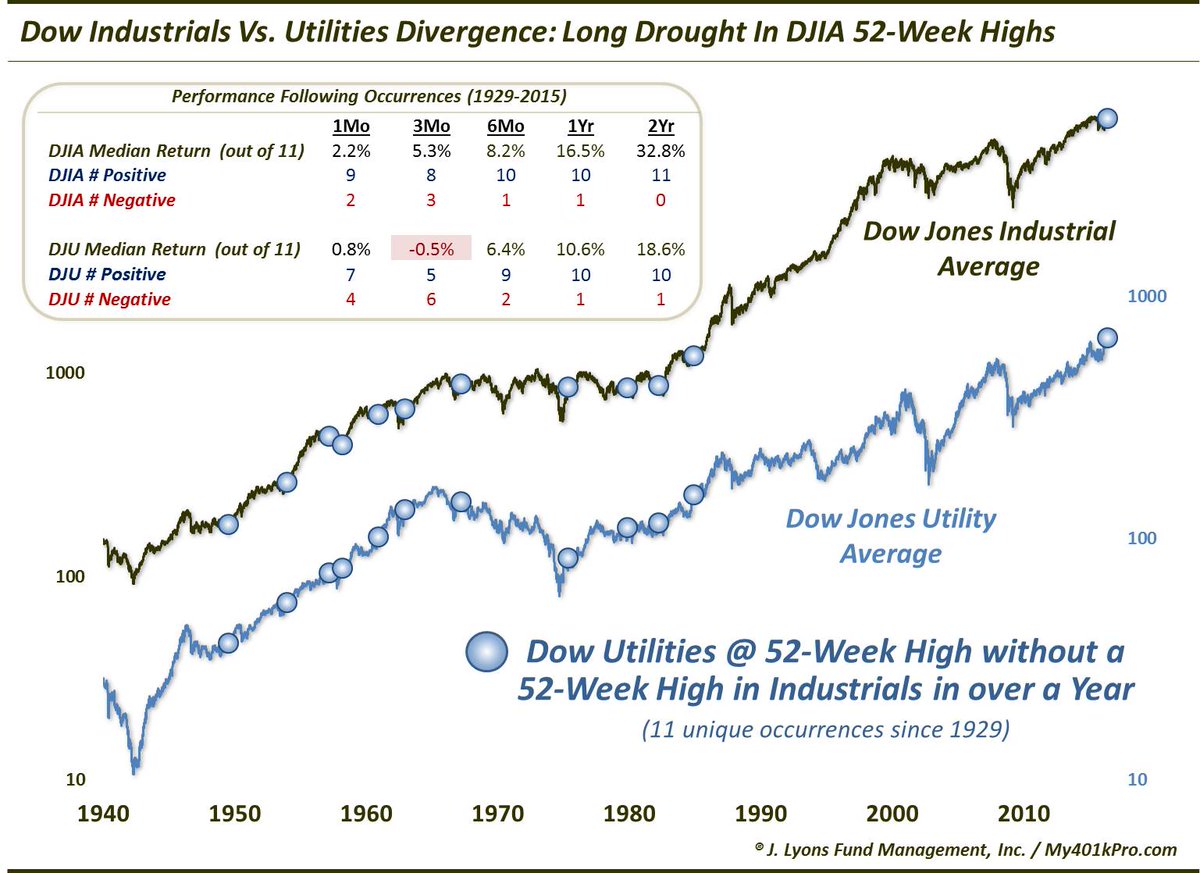
Right now, there is considerable skepticism about the upside potential of US equities. Josh Brown had pointed out that investors were being “chicken bulls” (my term, not his) by reluctantly putting money to work in stocks by buying low-volatility funds and ETFs, which are considered to be low risk. If there is a bubble forming right now, it seems to be occurring in Utilities as the forward P/E of this slow-growth but defensive sector trades at a premium to the market (via Marketwatch):

Dana Lyons pointed out that when Utilities outperform, it tends to be positive for DJIA returns.
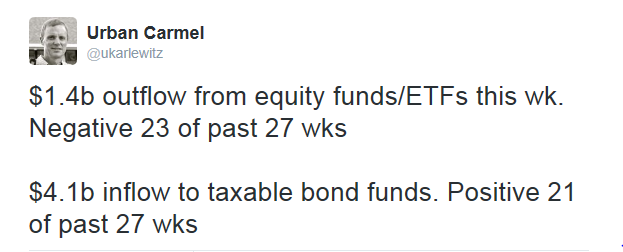
Urban Carmel also noted that funds flows continues to be negative for equities and positive for bonds, which is hardly the picture of unbridled greed and irrational exuberance,
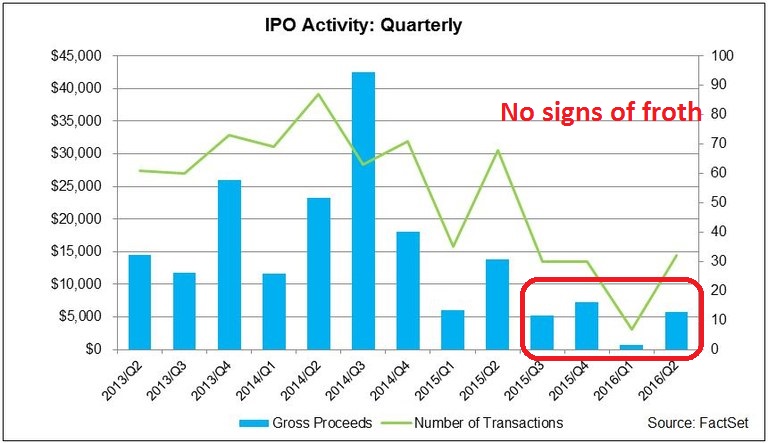
The IPO market has been moribund, which is another indication that there are few excesses in the market.
At an anecdotal level, I am still encountering a lot of bearish objections as I made my bull case in the last few months. Virtually all of these comments show heightened fear that either a major bear market or a market crash is just around the corner. For some context on downside risk, Business Insider reports that the Citi Bear Market checklist is not flashing any major cautionary signs.
Citi’s Bear Market checklist consists of a series of 18 factors that would signal the beginning of a sustained stock market downturn. Included in this group are measures such as earnings per share valuations, the US Treasury yield curve, growth in the number of IPOs, and more.
At this point, the checklist has only 3 factors in dangerous “red” territory and one in cautious “yellow” territory, for a total score of 3.5 out of 18. By comparison, the checklist hit 17 of the 18 before the 2000 crash and 13.5 before the financial crisis sell-off.

In summary, long-term sentiment metrics are supportive of higher stock prices and bubble blowing.
Central banks as enablers
The Fed is another actor that could contribute to bubble formation. The minutes of the June FOMC meeting indicated that the Yellen et al wanted to adopt a wait and see attitude on monetary policy normalization as the May Jobs Report was extraordinarily weak. Despite the blowout jobs growth exhibited by the June report, the Fed will undoubtedly want to wait a few months to look through the data volatility before making a definitive decision on interest rates. In all likelihood, the strength in the labor market will continue as Gallup`s Good Job Rate has also registered a new high.

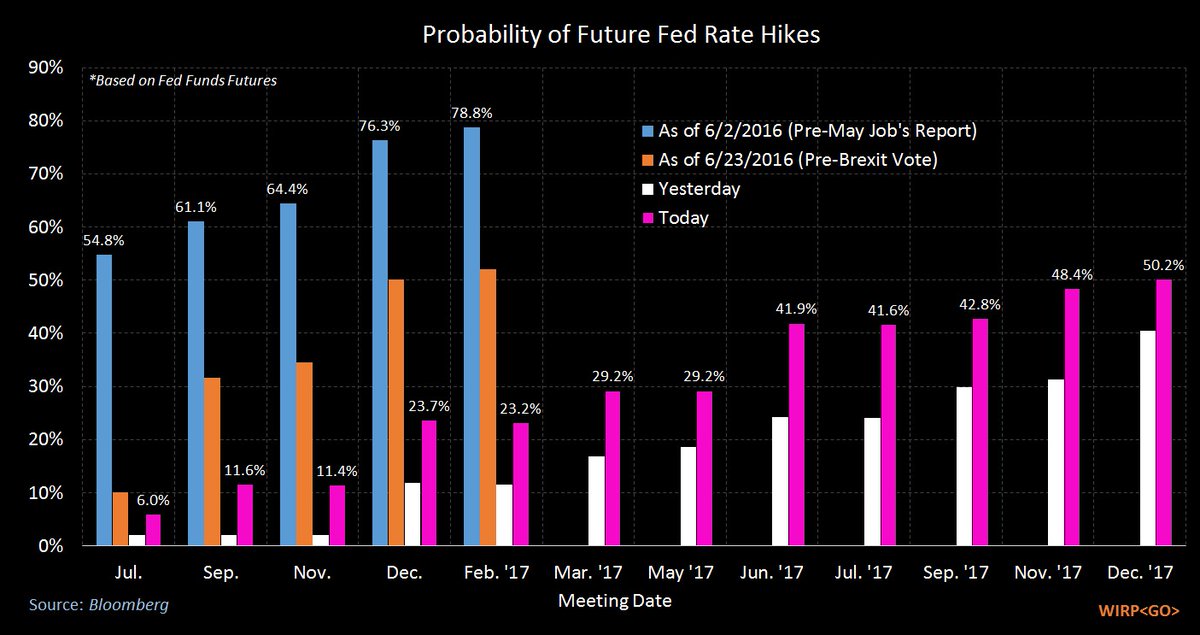
The chart below (via Michael McDonough) shows the evolution of Fed Funds expectations, pre-May Jobs Report, pre-Brexit vote, pre-June Jobs Report and Post-Jobs Report. Even though the probability of rate hikes jumped after the blowout June report on Friday, the market is still not expecting a rate hike until well into 2017.
A dovish Fed can therefore be another factor contributing to the formation of a US equity market bubble. While I am not saying that an asset bubble is a sure thing, as there are many moving parts to this story, the potential is certainly there for a bubble to form, especially when the ECB, the BoJ and SNB drive yields into the red and USD assets become increasingly attractive to non-US investors.
The week ahead
Looking to the week ahead, you can tell a lot about the short-term direction of a market by the way it responds to news. I believed that the Brexit panic and sell-off would take several weeks to resolve itself with a W-shaped bottom in stock prices (see Brexit panic: A gift from the market gods?), but I was wrong. Even before the good news presented by the June Jobs Report, stock prices weren’t responding very much to bad news. The market ignored concerns over the political disarray within the British establishment in the wake of the Brexit vote. It also proceeded to shrugged off worries about the stability of the Italian banking system.
Sentiment readings from Rydex data, which measures what retail traders are doing with their money rather than opinion surveys, show that the public is still tilted towards bearish positions. This suggests that a growth surprise will likely catch the bears off-guard and the test of technical resistance at the SPX all-time highs will be resolved bullishly in the near future.

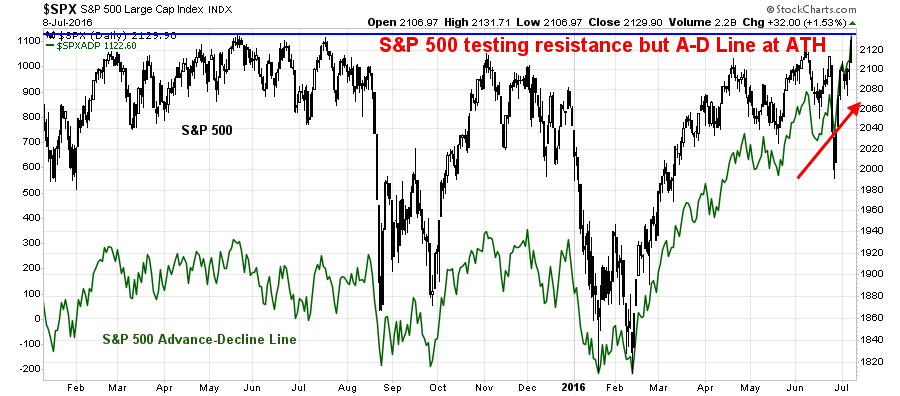
Breadth indicators are also supportive of high stock prices. The SPX Advance-Decline Line has already made an all-time high, which is a positive divergence.
However, very short-term indicators with a 1-3 day time horizon such as this one from IndexIndicators of % of stocks above their 10 dma are showing an overbought reading, which points to a temporary pullback or consolidation early next week.

On the other hand, longer term trading indicators such as the net 20-day highs-lows suggests that this advance has more room to run on a 1-2 week time frame.

Under these circumstances, a buy the dip strategy would be appropriate for both investors and traders who missed the initial rally.
Upside targets
I began this week`s analysis by postulating what would happen should stocks get caught up in a market bubble. One of the key questions is, “What`s the upside potential on a move like this?”
Let`s begin with a non-bubble analytical framework. Jim Paulsen recently appeared on CNBC and gave a relatively modest SPX target of 2200 before year-end. That 2200 figure is also consistent with the year-end forecast of former Value Line research director Sam Eisenstadt. So call 2200 the non-bubble “rational” target for December.
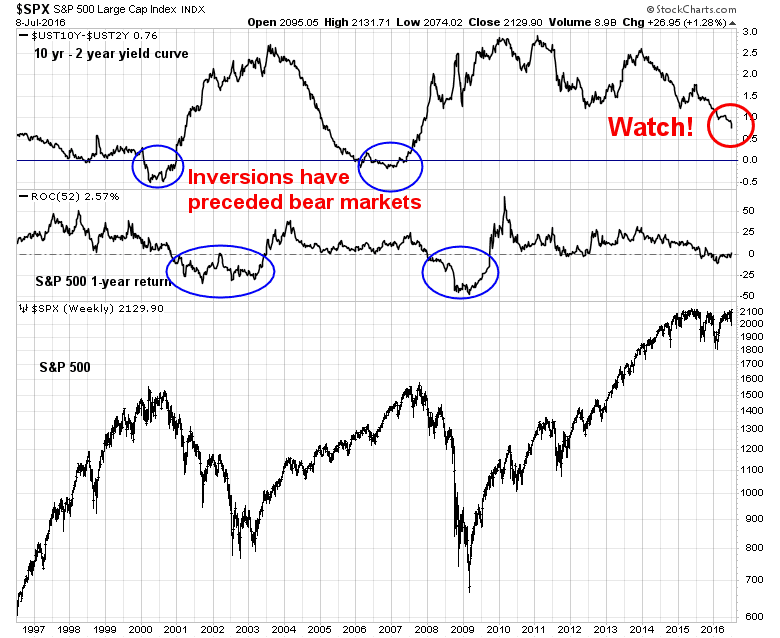
On the other hand, bubbles are “irrational” and they can run much further than anyone expects. Should a non-US buying stampede materialize, I will be watching for contra indications that the party may be coming to an end. As an example, the shape of the yield curve has historically been a good indicator of recessions and bear markets. While the yield curve is flattening right now, it is nowhere near inversion.
My inner investor has been bullishly positioned for quite some time and he is carefully watching the above chart for a sell signal. My inner trader thought that it was prudent for him to step aside as he started a two-week holiday last week. Some time ago, we caught our daughter hiding under the covers listening to *gasp* Puccini (all parents should have such problems). We have therefore undertaken an operatic tour of Europe this summer. Here I am atop the Eiffel Tower.,,

…and at the British Museum in London:

My inner trader was itching to put on a long position early in the week had he not been going on holiday. Had he missed the move, he would be watching for a pullback next week to buy the market. However, he is staying in cash as he doesn’t have the time to be tactically watching the markets while on holiday.
Disclosure: No trading positions
Ken is going to get very excited when he reads this post. That’s my prediction.
Amy, you are so right.
I believe we have started a new global bull market in February after finishing defined (negative 20%) bear markets in every country outside of America.
The bull will be driven by yield hungry retirees and institutions that are gradually realizing that interest rates will stay ‘lower for longer’. Stocks offer a very generous yield.
Veteran investors like us were shocked when rates fell instead of going up after the Fed raised rates in December. Unleashing artificially low rates was supposed to start the ramping up of rates. But they fell instead. We have the belief that rates will mean revert back to some ‘norm’. Investors will gradually lose that belief. Even the St. Louis Fed has stopped forecasting long term and just looks two years ahead. Their forecast is for low rates for the two year ‘regime’. The ‘lower for longer’ meme will be going viral sometime soon.
I foresee a market grinding higher as investors buy stocks for yield and sell bonds. So no bubble. But it may seem like a bubble to all us experienced folks who only value stocks by earnings. Take Cam’s example of utility stocks. They have higher than long term norms of PE but and it a key but their PD ratio (price to dividend) is very generous given today’s interest rates.
The yield on the S&P 500 is 2%. Going to 1.5% would mean a 25% higher price plus dividends are projected to rise by 7% plus the 2% yield equals a 34% total gain. Seems absurd, right? It will seem obvious when we look back in a couple of years.
Internationally the picture is even better. Europe and British stocks yield 4% with yields negative on many bonds. Canadian stocks yield 3% with a tax credit that makes it equal to a 4% bond. Absurdly cheap.
So prepare for a bull market where the market indexes are dragged grudgingly higher by quality dividend payers that always seem too high on the basis of historic PEs.
And yes Amy thus will be done in a Moonless investment world.
My suggestion is to buy dividend ETFs. They yield double the general index and you don’t have the angst of buying individual stocks that seem too high on the basis of earnings.
Next summer, Marion Cotillard is playing the lead in Honegger’s “Jeanne D’Arc au bûcher” in my home town of Frankfurt. I think it will be a beautiful production but tickets are already scarce. Cam, if you want to treat your daughter, let me know and I’ll see if my contacts may bear fruit.
We almost got to Munich as there is an opera festival on there, but there was a ticketing problem and we never got seats for the performances we wanted. Instead we went to Covent Gardens in London for Il Travotore, as well as Paris for Aida.
If you can fly to Calgary, I’ll get you tickets to the Stampede rodeo finals on Sunday! Watching bulls with horns on their heads is better than heavy lady opera singers with horns on their Viking helmets. LOL
Have a great time in Europe. It’s a well-earned break!
Here is a good article showing the performance of dividend paying stocks in the S&P 500 versus non-payers. It’s an eye opener. It also tracks the performance of two excellent dividend ETFs.
http://advisoranalyst.com/glablog/2016/07/11/dividend-stocks-have-been-outperforming-non-paying-stocks-ytd.html/print/
If one is predisposed to thinking the market should go down, one could say that the outperformance is behind us now and the future is a reversion to some nastier norm where defensive high dividend payers fall in price so their PEs go back below the general market PE. But momentum theory says that won’t likely happen. When a shock of new information occurs and a new momentum trend starts (and I believe the shock of rates falling after the December hike rather than going up is a huge shock.) a long term trend begins. Depending on the nature of the new information, the trend can be long or short. Apple’s iPhone was a shock to Blackberry and it took a few years for Blackberry to go from $140 to $6. A new uptrend takes time because it’s easy to sell a rising stock and hard to buy because it seems expensive versus where it was priced recently (anchoring bias). All this to say, the trend of performance of dividend stocks is just starting.
Directors and CEO’s of companies seeing these trends will want to raise dividends to spur the price of their stock. It’s a virtuous circle.
The underlying dynamic is dividend yields with yield starved investors. Not earnings.
On my computer is glued a short note reminder that says, “Successful investing is about having people agree with you later.”