Preface: Explaining our market timing models
We maintain several market timing models, each with differing time horizons. The “Ultimate Market Timing Model” is a long-term market timing model based on research outlined in our post Building the ultimate market timing model. This model tends to generate only a handful of signals each decade.
The Trend Model is an asset allocation model which applies trend following principles based on the inputs of global stock and commodity price. This model has a shorter time horizon and tends to turn over about 4-6 times a year. In essence, it seeks to answer the question, “Is the trend in the global economy expansion (bullish) or contraction (bearish)?”
My inner trader uses the trading component of the Trend Model to look for changes in direction of the main Trend Model signal. A bullish Trend Model signal that gets less bullish is a trading “sell” signal. Conversely, a bearish Trend Model signal that gets less bearish is a trading “buy” signal. The history of actual out-of-sample (not backtested) signals of the trading model are shown by the arrows in the chart below. Past trading of the trading model has shown turnover rates of about 200% per month.
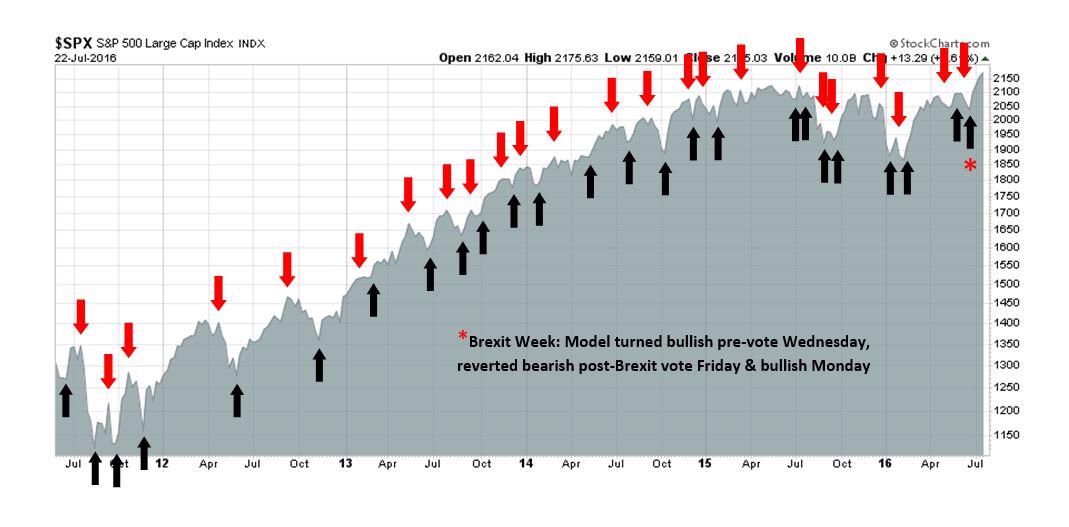
The latest signals of each model are as follows:
- Ultimate market timing model: Buy equities
- Trend Model signal: Risk-on
- Trading model: Bullish
Update schedule: I generally update model readings on my site on weekends and tweet any changes during the week at @humblestudent. Subscribers will also receive email notices of any changes in my trading portfolio.
Value meets Growth and Momentum
No, I am not turning bearish on stocks despite the title of this post. However, the value side of my inner investor is starting to get a little nervous. The market has risen to a level that can be described as either fair value or slightly overvalued. In addition, the behavior of “smart” investors like insiders are also raising cautionary flags that serve as early warning signs of limited upside potential.
On the other hand, the US economy is undergoing a growth revival, which is helpful for higher stock prices. In addition, the market is experiencing powerful momentum in the form of a FOMO (Fear of Missing Out) rally that’s still in its early stages. The irrational exuberance scenario that I postulated two weeks ago (see How to get in on the ground floor of a market bubble) is becoming my base case. Under those circumstances, stock prices can rise further than anyone expects.
My preliminary conclusion is we are seeing the late stages of a market blow-off that will ultimately mark the top of the bull market that began in March 2009. We are in the 7th or 8th inning* of this bull and there are still gains to be made, but longer term investors should start to begin to exercise some caution.
* For readers unfamiliar with baseball, a normal game lasts 9 innings. If the score is tied after the 9th inning, then extra innings are played until a winner is determined.
The bull case
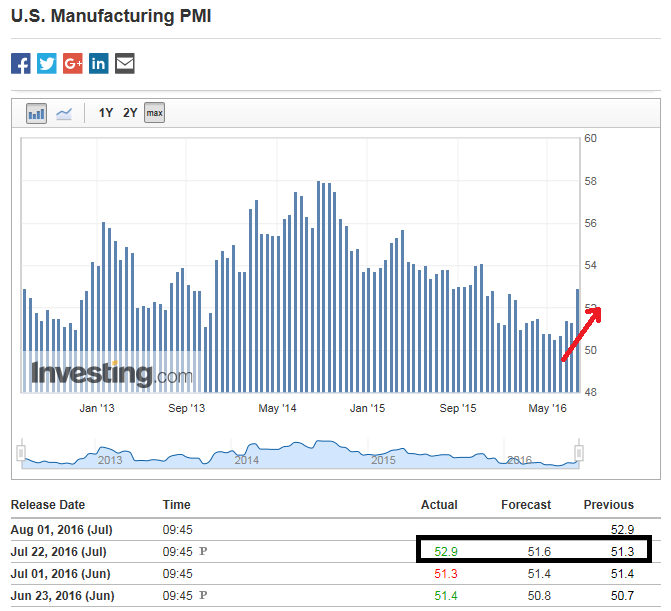
Let’s start with the bull case for stocks. I have been saying for several weeks that we are seeing the start of a growth surprise and that trend continues. Last week, we saw the latest Manufacturing PMI beat expectations and tell a story of an industrial growth revival.
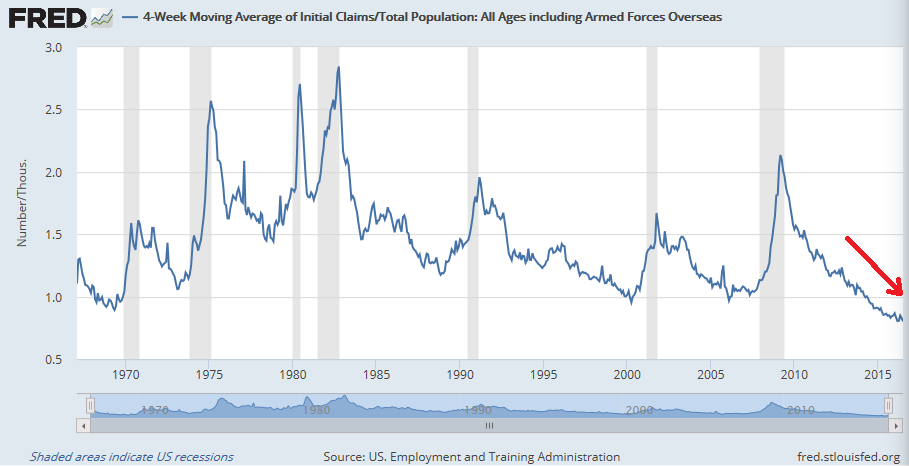
Last week, we also saw more progress in initial jobless claims which also beat expectations. Last week’s release is particularly useful as it coincides with the survey period for the July Jobs Report.
We also saw a number of key metrics being released for housing last week, which is important as the sector is a leading indicator of economic growth – it’s virtually impossible to have a recession without housing and construction turning down. Housing starts and existing home sales both beat expectations, reflecting solid prospects for continued economic growth (click on links to comments from Bill McBride of Calculated Risk).
In fact, macro momentum was so strong last week that there were very few important indicators that missed expectations.
A solid earnings season
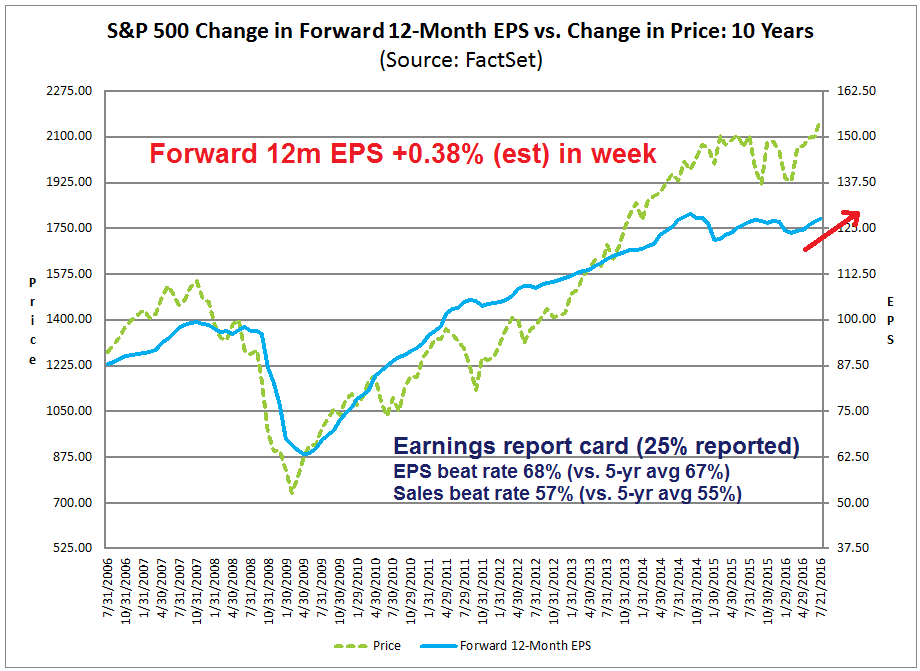
If we were to analyze the market from a bottom-up basis, the growth picture appears just as positive. The latest Earnings Season update from John Butters of Factset shows that both the EPS and sales beat rates are coming in slightly ahead of historical averages. More importantly, the Street is revising EPS upwards at a solid rate (chart annotations are mine).
From a growth investor’s viewpoint, these are all bullish signs.
FOMO rally = Momentum
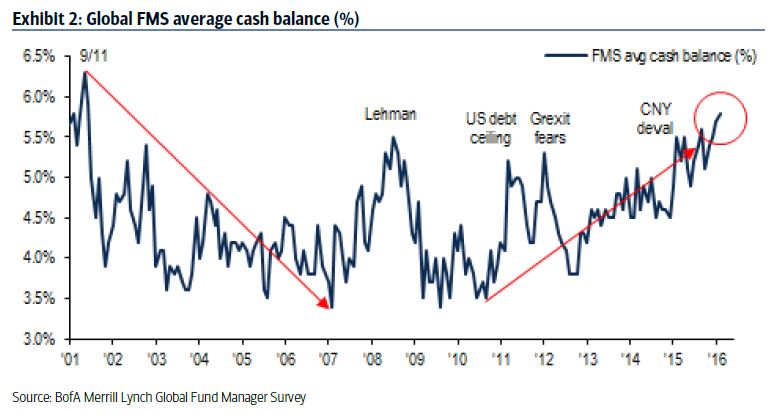
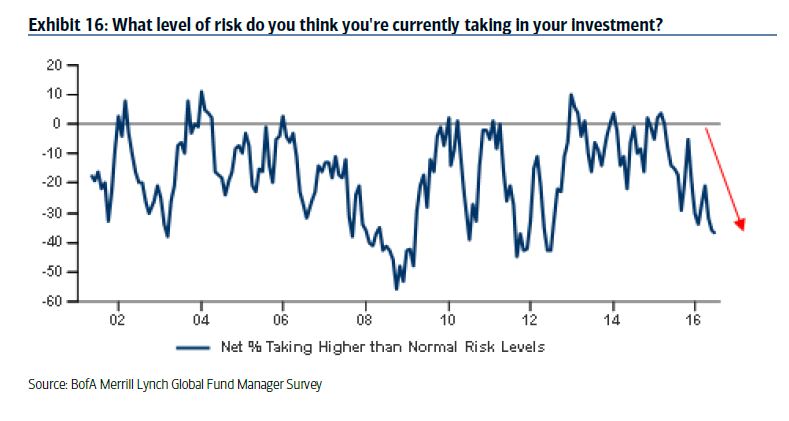
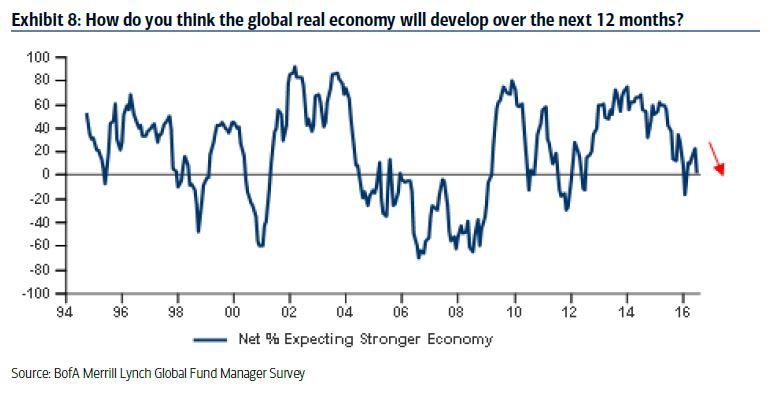
Even as the market undergoes a growth surprise, the BoAML Fund Manager Survey (FMS), which is primarily a survey of global institutional fund managers, is suggestive that a FOMO stampede is just starting. Remember – institutions represent big and slow money and their moves tend to be slow but powerful.
The FMS shows that global institutions are still relatively defensively oriented. Cash levels are high.
Overall portfolio risk is well below average.
Equity allocations at about neutral (the lower than average portfolio risk can be explained by high cash levels).

Growth expectations are falling, despite emerging evidence of a US growth surprise.
Equity weights in the US has moved from an underweight to a slight overweight position in June, though readings are not excessively high. Managers are allocating more funds into US equities as the evidence of a growth surge emerges. The combination of an defensive portfolio orientation and positive US growth characteristics suggests that the shift into US equities leads me to believe that funds flows into the US market has a lot more room to run.

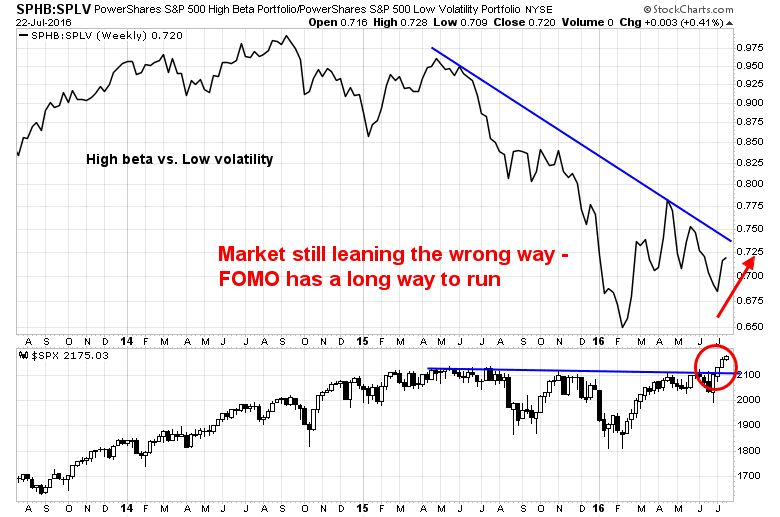
This buying stampede has created a price momentum tsunami. CNBC highlighted analysis from Ari Wald of Oppenheimer showing past instances of momentum breadth surges have led to much higher prices.
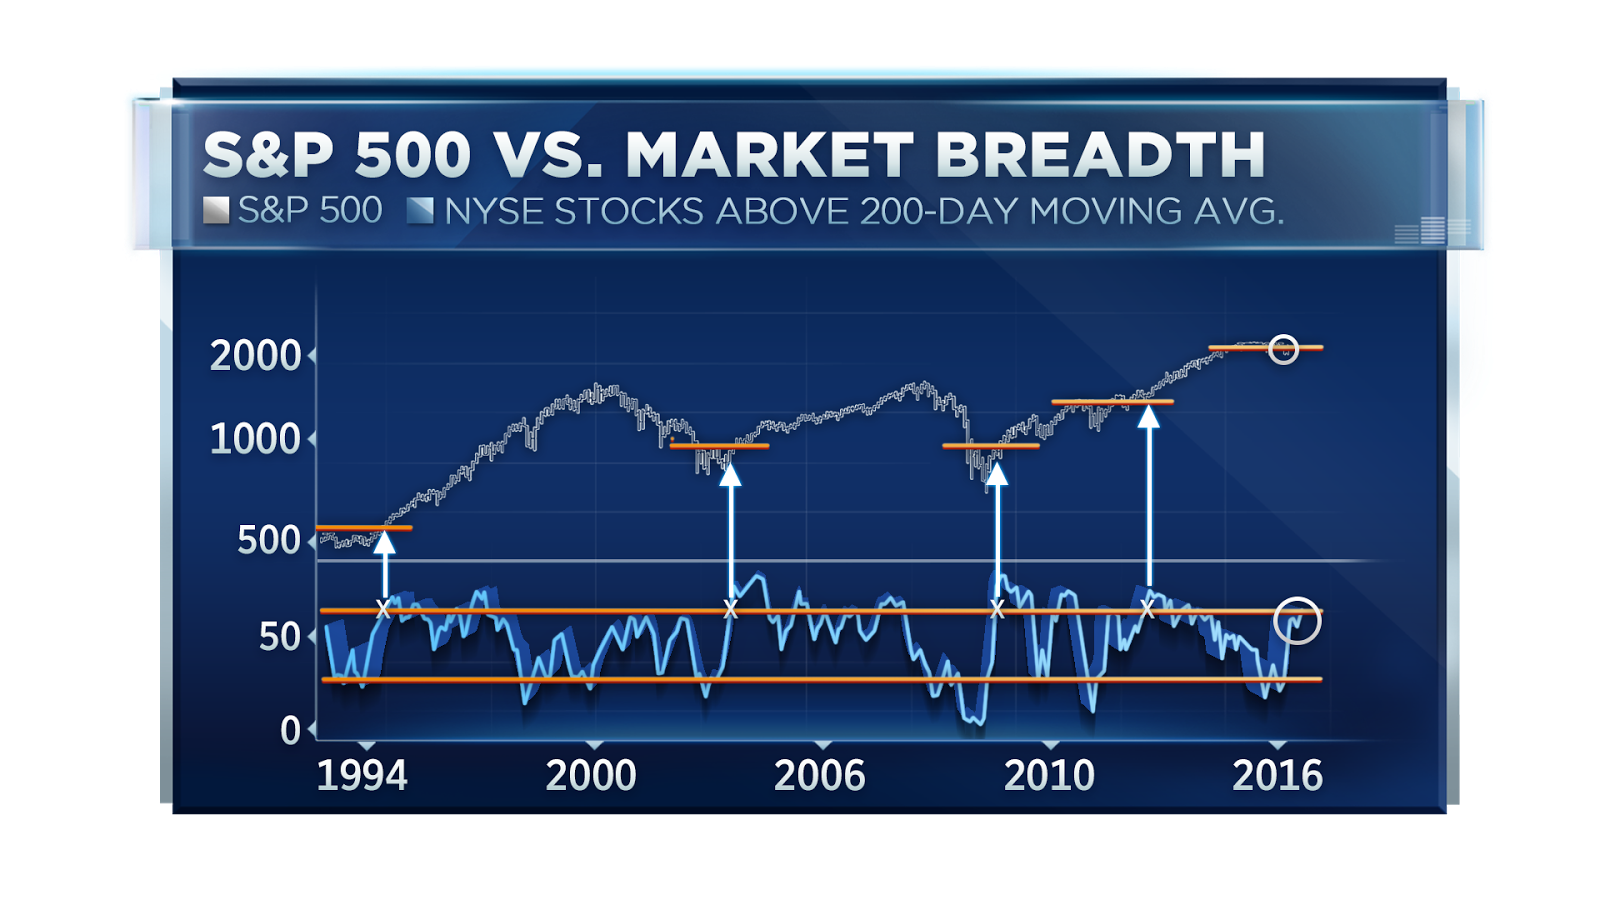
In short, funds were caught off-side and too defensively positioned. Now they`re buying anything that moves. As the chart below of high beta stocks vs. low volatility stocks shows, a FOMO rally has a long way to run before sentiment can be characterized as irrational exuberance.
Cautionary signs
Despite the bullish signals from Growth and Momentum, a number of cautionary signs are restraining me from getting wildly bullish. I wrote before that the combination of above average valuation (as measured by Morningstar’s fair value estimate) and insider selling (Barron’s) could pose bullish headwinds (see How worried should investors be about insider selling?).
Those conditions are appearing again. We are seeing mild (3%) overvaluation and several weeks of of insider selling. While this is not a perfect market timing signal, it does suggest that stock prices lack valuation support.
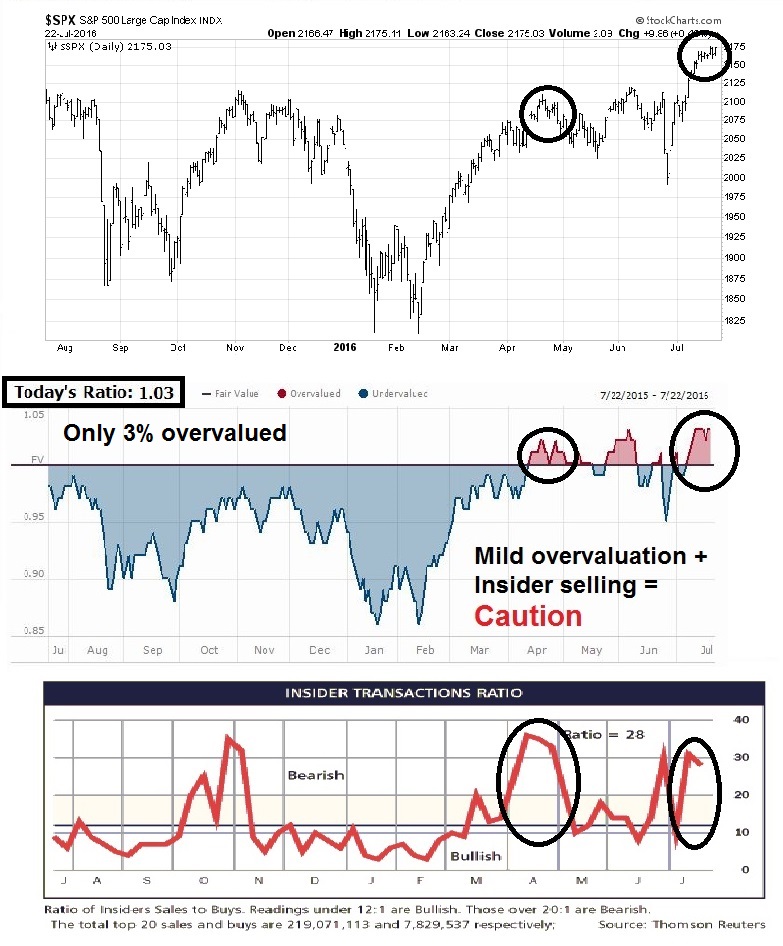
I would warn that this model is not designed for trading, but investing. During the episode in late 2014 and early 2015 when such a combination of condition existed, the signal persisted for several months and the market ground upwards before it corrected (chart from How worried should investors be about insider selling?).

Another risk that I have also pointed out in the past raised concerns about how a rising US Dollar squeezes the margins of large cap US multi-national companies. While the USD remains fairly flat on a YoY basis, the recent rally of the USD Index has moved it to test downtrend technical resistance. An upside breakout could be a signal of further strength, which would eventually pose headwinds for US equity fundamentals.

Another cause for concern the direction of bond yields. The chart below (via Ed Yardeni) shows the Citigroup Economic Surprise Index, which measures whether macro-economic releases are beating or missing expectations (red line), and the 10-year UST yield (blue line). These two indicators have tracked each other quite closely in the past. While ESI has surged in the past few weeks, 10-year yields have barely moved. How long before yields rise to catch up with ESI?
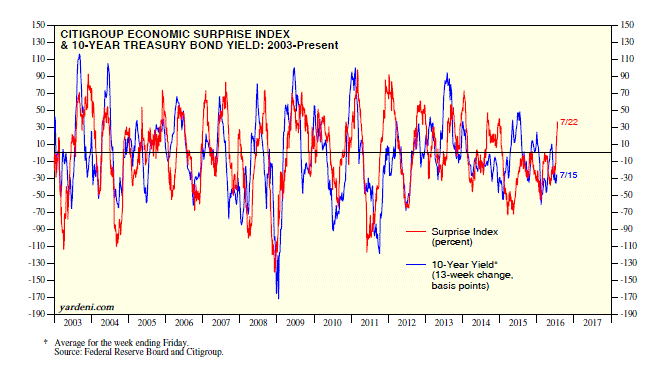
If Treasury yields were to rise, it would change the risk-reward relationship between stocks and bonds in the favor of bonds and put downward pressure on stock prices.
The ESI-bond yield relationship also begs the question of the Federal Reserve’s reaction function to higher growth, better employment and stabilizing markets. When will it resume its path of interest rate normalization? How many rate hikes will we see in 2016?
We should get better clarity when the FOMC releases its statement next week. The FOMC statement is expected to set the tone for the bond market and the USD, which could have profound implications for equity prices for the reasons I mentioned above.
The bull market in the late innings
For now, any Fed induced slowdown or recession is well in the future. Nevertheless, these are risks bear watching in the face of a mature economic cycle and mature late-stage stock market bull.
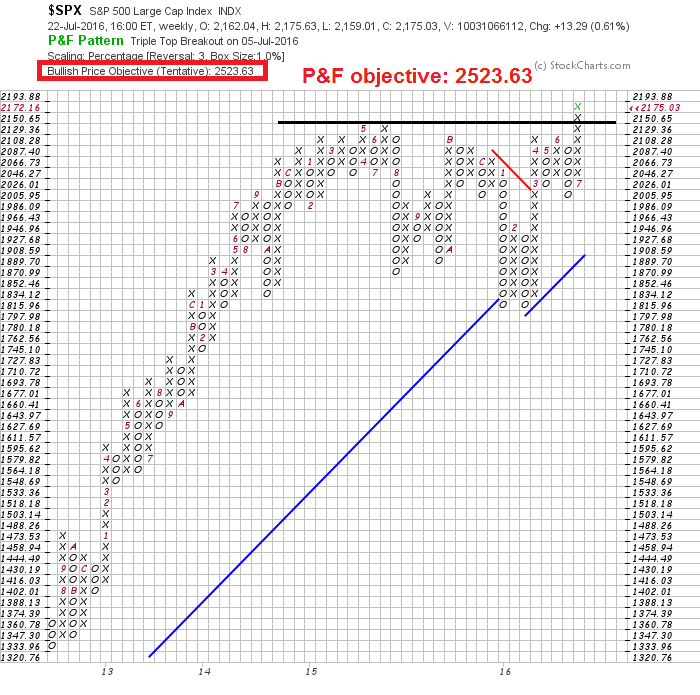
When I put it all together, the stock market is caught between a battle between Value. whose signals tend to be early, and Growth and Momentum. As the latter two factors can be very powerful in the late phase of a bull, this combination suggests that the bull market that began in 2009 can still have more room to run. If I had to make a guess about an SPX target, a rough estimate of 2400-2500 would be where this market ultimately tops out – and that figure is consistent with the upside target on a point and figure chart.
As for the question of the timing of a market peak, we can get some clues from this Morgan Stanley analysis of the the high yield credit cycle (via Value Walk). Based on this analysis, we might see the top of the cycle about a year from now. By contrast, an analysis using the Presidential Cycle would see a cyclical market top in early 2017. So a rough guess would see the time frame for a market top in 6-12 months.

The bull market isn’t dead, but it`s aging. It is now starting the manic phase where price is overshooting fair value. I am now paying more attention to technical analysis to watch for the signs of a top.
The week ahead
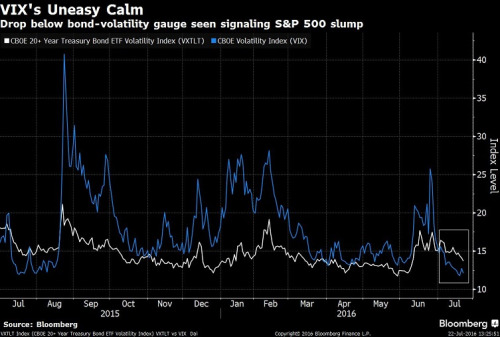
I don’t have much to add to my mid-week tactical market comment (see When will the bulls take a breather?). Bullish momentum appears to be waning. Even perennially bullish strategist Tom Lee at Fundstrat has turned tactically cautious. He pointed out that equity volatility (VIX) has fallen below bond volatility and such episodes have historically seen an average SPX loss of -1.3% in the next 20 trading days 68% of the time.
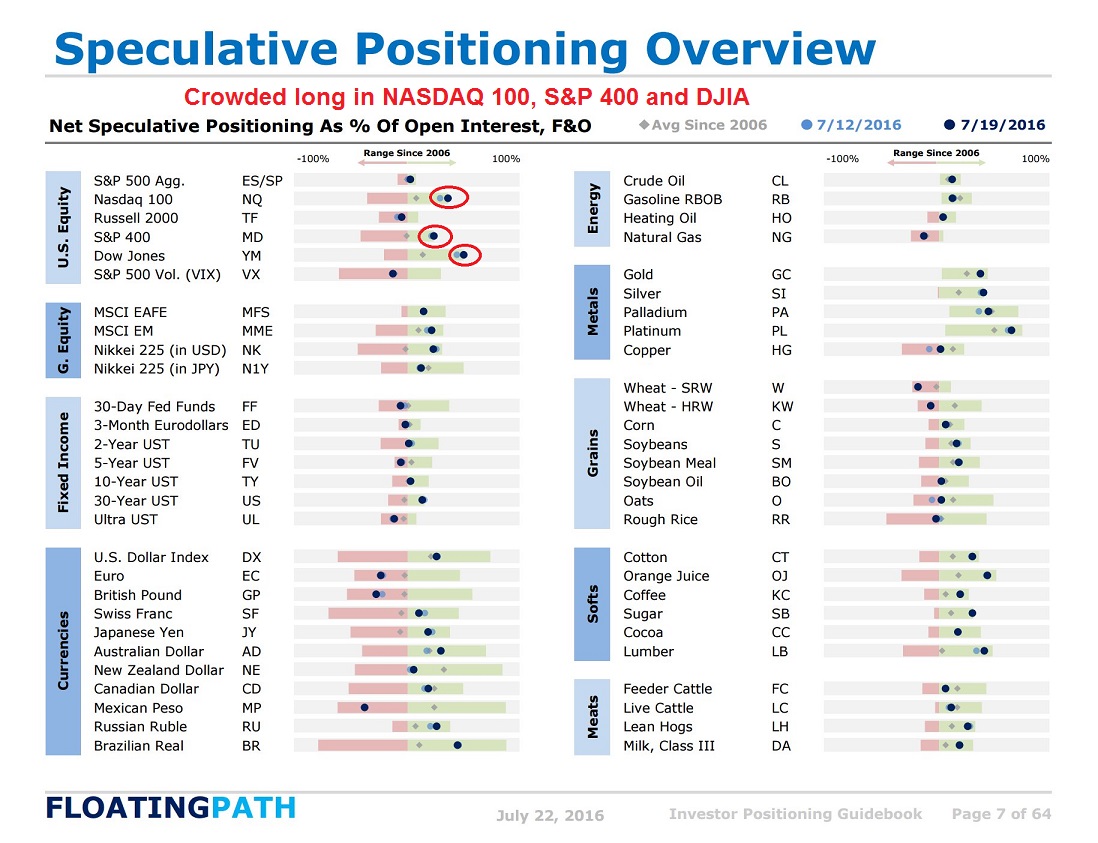
In addition, the latest Commitment of Traders data shows crowded long positions by futures speculators in the NASDAQ 100, S+P 400 and the Dow. The combination of these readings all point to limited upside potential in the near-term.
Though the stock market can continue to grind upwards and make marginal new highs, the more likely outcome is a 1-2 week period of sideways consolidation or minor pullback.
Even though he is getting a little nervous, my inner investor remains bullish and fully invested. My inner trader remains in cash after coming back from vacation. Next week will see potential volatility in the form of the heavyweight AAPL earnings report and the FOMC meeting. My inner trader is inclined to believe that the prudent course of action is to stay on the sidelines. He is waiting for signs that the market’s overbought condition has been alleviated before making a commitment to the long side.
Disclosure: No trading positions
Both Richard Bernstein and Jeff Saut have repeated stated their strong conviction that the current secular bull market has 5-6 years left to run. By that time, even at the lowest trajectory of the other bull markets of comparable age, the S&P will have eclipsed 3,000.
Your analysis concluding that this leg is likely to top out at about 2,500 seems about right. I guess the key question is whether or not this is the final leg of this secular bull market. Bernstein and Saut, among others, seem to be saying “no”.
My analysis says that we are in the first innings of a new global bull market after the last bull market ended early this year. EVERY major market in the world other than the S&P 500 and DJIA had a defined bear market (minus 20%) which ended at that time. The Global Index ex-U.S. was down 26% from May 2015 to February 2016. To say to investors in those markets that they were in an aging bull market and get ready for a bear market to happen soon, would have likely gotten a nasty reaction. Even in the U.S. the Russell 2000 Index was down 23% and the Dow Jones Transports were down in bear market territory. The S&P 500 was unique because of its high weighting in consumer non-durables and healthcare which are recession-proof.
This viewpoint allowed me to view the decline into 2016 as a ‘late bear market’ herding and final sentiment capitulation in the sectors that were most heavily hurt by the bear market, namely commodities, commodity oriented stock markets like Canada and commodity oriented currencies. Buying these in mid-January (at the time Cam was also seeing a commodity turn) has been a huge boost to my client’s portfolios since these sectors have led the new bull market.
A bull market usually lasts three to five years and goes up eventually 50-75% before the next bear market. So if I believe we are in the beginning innings of a new bull market, I should have some valid reasons why that should happen especially since stocks seem expensive on the basis of earnings right now. Wouldn’t a 75% upward price change give us a bubble valuation. No. Already the S&P 500 is up 20% on a total return basis from its February 11th low. So that means we already have a new bull market. But that leaves another 55% total return ahead of us to accomplish a full normal bull market.
I believe we are in an historic transition from an earnings driven valuation of stock market in developed countries from and earnings driven one. This change is happening because, as I have been saying, the huge shock that bond yields fell after the First Fed rate hike last December rather than going up is changing investors long term views on interest rates to ‘lower for longer’. That makes the dividend yield on stock markets stupidly generous compared to bonds. Let’s take a look. Canada 2.9% (with a 30% dividend tax credit boost), U.K. 4.1%, Japan 1.5% DJIA 2.5%, Paris 3.8% and Shanghai 2.0% That is for their general indexes that include a lot of non-dividend paying companies. If you concentrate on just solid dividend stocks within these markets, you can achieve a much higher yielding portfolio in a world where quality bonds are yielding little or less than nothing.
Pension funds, insurance companies, Boomer retirees are all yield hungry. All were suspicious of stocks as a yield alternative because they expected interest rates to ramp up, making bonds attractive again and possibly send stock prices down. Now, interest rates amazingly fell after the Fed uncorked what we thought was artificial pressure to hold rates down and after the uncorking, rates fell instead of going up. That is spreading a ‘lower for longer’ new vision of the future. So earnings are just viewed as a means of paying current dividends and possible raising them. If earnings are down 10% or so, it won’t hurt the dividend paying ability of companies so it’s no big deal. A new world that all the CFA’s will find confusing since their analytic training is all around earnings and ROI not yield on stock price.
So if dividend yields fell by one third in the next three years the stock markets would be up 50%. (example 3$ yield on $100 equals 3%, to get the $3 to yield 2%, the price has to be $150 or 50% higher) An investor would also receive the 2 to 3% dividend yield per year plus there would likely be some growth in the dividend payout. So the markets going up another 55% from this point forward after the 20% it has already come to total the target 75% bull market normal return is a clear possibility in a ‘lower for longer world.’ I actually expect companies to raise dividends aggressively when they see investors rewarding companies for their dividend yield. They will change from stock buy-backs.
All that said, I am equally nervous as Cam about the next month or so since sentiment has turned too bullish. But margin loans went down again so speculation is not extreme. We are in the early innings of this bull market. My experience is that a correction during this phase is likely short and almost impossible to take advantage of since so many people are waiting for a pullback to hop onto the ‘train that’s leaving the station’. Therefore I will grit my teeth and stay in.
This is my viewpoint. I have a quotation taped to my computer that says, “Successful investing is about having people agree with you later.” Let’s check back later.
Ken’s viewpoint is not inconsistent with the ongoing secular bull market thesis. A secular bull market will have bear market periods within it, but it will not reverse the overlying trend of upward asset values. For example, most economists agree that U.S. equities were in a secular bull market from about 1980 to 2000, even though the stock market crash of 1987 occurred within the same time period. The losses from that bear market period were quickly recovered, and the market indexes continued to rise over the next 13 years. The S&P index rose from 120 to nearly 1,500 during this secular bull market.
Based on the two preceding longest secular bull markets, this one has between 30% and 67% additional upside potential from the recent breakout. Ken’s expectation of an additional 55% in gains is near the middle of this range.