Preface: Explaining our market timing models
We maintain several market timing models, each with differing time horizons. The “Ultimate Market Timing Model” is a long-term market timing model based on the research outlined in our post, Building the ultimate market timing model. This model tends to generate only a handful of signals each decade.
The Trend Model is an asset allocation model which applies trend following principles based on the inputs of global stock and commodity price. This model has a shorter time horizon and tends to turn over about 4-6 times a year. In essence, it seeks to answer the question, “Is the trend in the global economy expansion (bullish) or contraction (bearish)?”
My inner trader uses the trading component of the Trend Model to look for changes in direction of the main Trend Model signal. A bullish Trend Model signal that gets less bullish is a trading “sell” signal. Conversely, a bearish Trend Model signal that gets less bearish is a trading “buy” signal. The history of actual out-of-sample (not backtested) signals of the trading model are shown by the arrows in the chart below. Past trading of the trading model has shown turnover rates of about 200% per month.

The latest signals of each model are as follows:
- Ultimate market timing model: Buy equities
- Trend Model signal: Risk-on
- Trading model: Bullish
Update schedule: I generally update model readings on my site on weekends and tweet any changes during the week at @humblestudent. Subscribers will also receive email notices of any changes in my trading portfolio.
Stay focused on the big picture
Here at Humble Student of the Markets, I use technical analysis as a way of measuring market psychology. The combination of price, volume, sentiment, and how the market response to news convey important information about the psychology of market participants. At the same time, I use fundamental and macro-economic analysis to derive information about the drivers of stock prices, such as valuation and the momentum of fundamentals. In particular, fundamental and macro analysis yield clues about how the E in the P/E ratio is likely to evolve.
During confusing times like these, it’s important to stay focused on the big picture. Cross-currents such as negative macro surprises against a backdrop of improving growth can be confusing for investors. A rigorous analytical framework can be informative about the likely direction of stock prices. Here is the big picture:
- The equity bull market is still alive for the remainder of the year
- The economic cycle is maturing fast and the timing of a cyclical market top will depend on Federal Reserve action
- The next downturn could be very ugly
These conditions are indicate a bullish stance on stocks for the remainder of 2016. After that, my crystal ball gets a little cloudy and I will become more “data dependent”.
Macro: Growth upturn continues
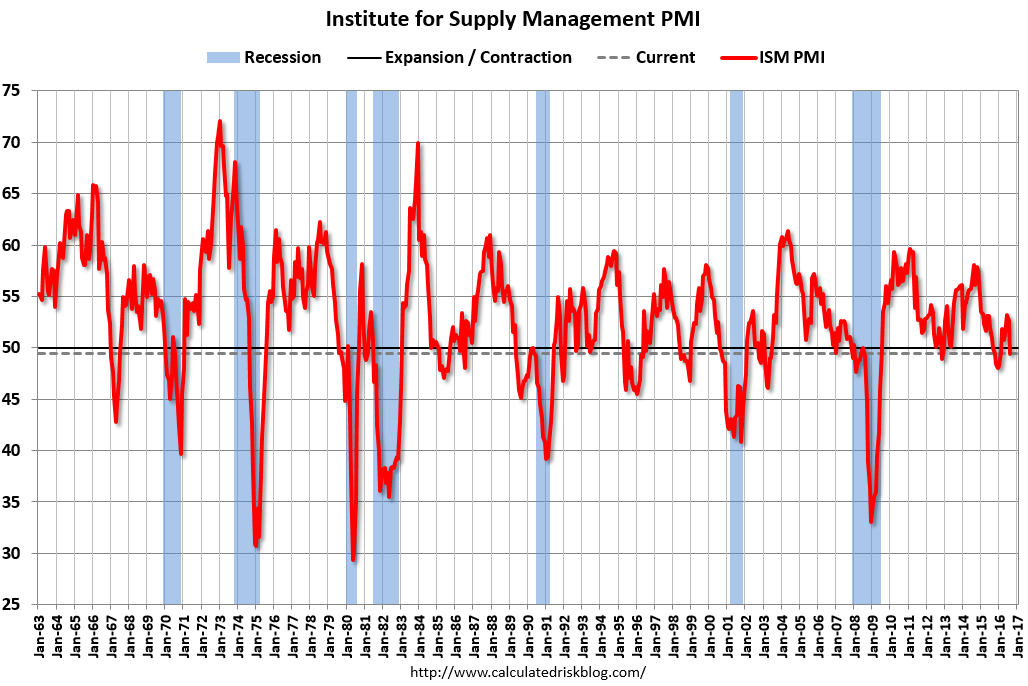
Investors can get easily disoriented by conflicting macro-economic data. The weakness in ISM and Markit PMI came as a surprise. However, this chart from Calculated Risk shows that ISM is a very noisy number and it has flashed numerous false recessionary warnings in the past.
The ISM miss was then followed by a disappointing Jobs Report. Headline non-farm payroll (NFP) came in at 151K, which was short of Street expectations of 180K. Does that mean that the growth rebound is stalling?
A way to cut through the noise is to use the analytical framework used by New Deal democrat. NDD separates high frequency economic indicators into coincidental, short leading and long leading indicators. His latest analysis of these three groups show that while coincidental indicators are mixed, short and long leading indicators are pointing to continued, though slightly wobbly, strength,
Despite the recent headlines of economic weakness, the latest Atlanta Fed GDPnow nowcast of Q3 GDP growth shows accelerating growth. GDPNow rose to 3.5% from 3.2%. The upward revision was attributable to an improvement in exports.

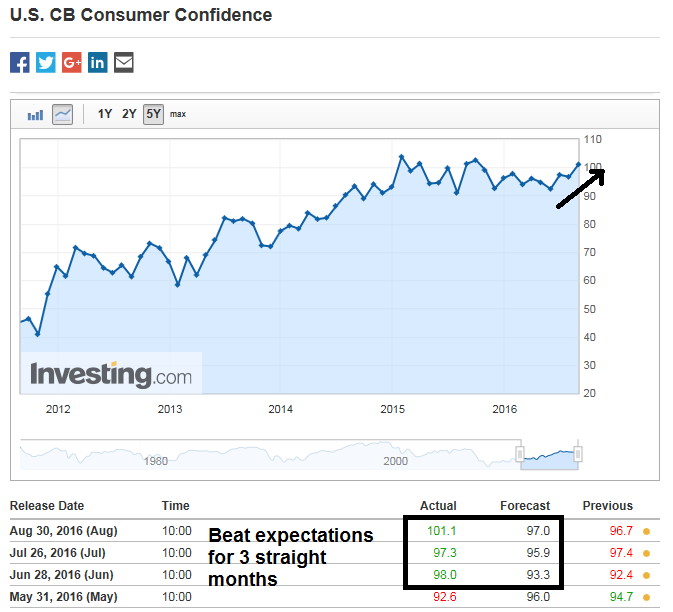
Last week also saw consumer confidence rise and beat market expectations for a third consecutive month.
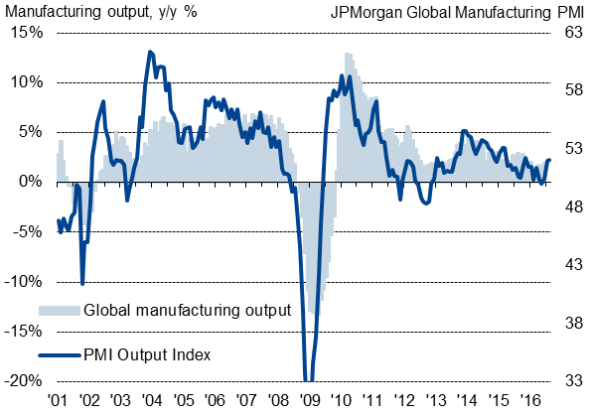
Economic strength isn’t just confined the the US. On a worldwide basis, Markit reported that global PMI remains in expansion mode.
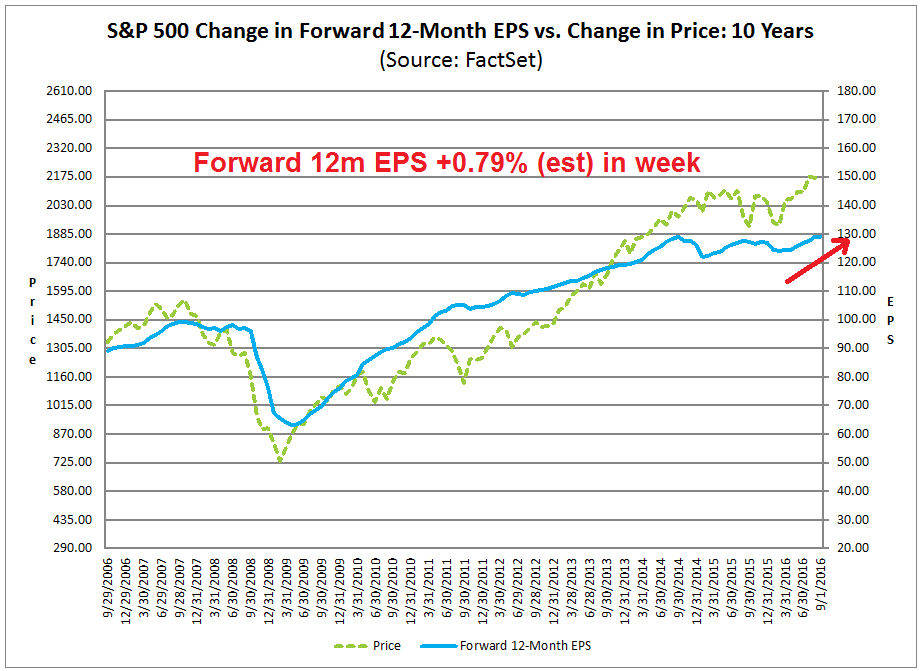
When I switch my focus from a top-down to a bottom-up perspective, the data is equally encouraging. The latest update from Factset shows that the Street continues to revise forward 12-month EPS upwards. That’s a bullish data development that stock investors should not ignore.
We are seeing a similar picture on earnings on a worldwide perspective. Jeroen Blokland highlighted BAML analysis showing that global earnings estimates are being revised upward.

These are not signs of stalling growth.
Technical: Bullish momentum
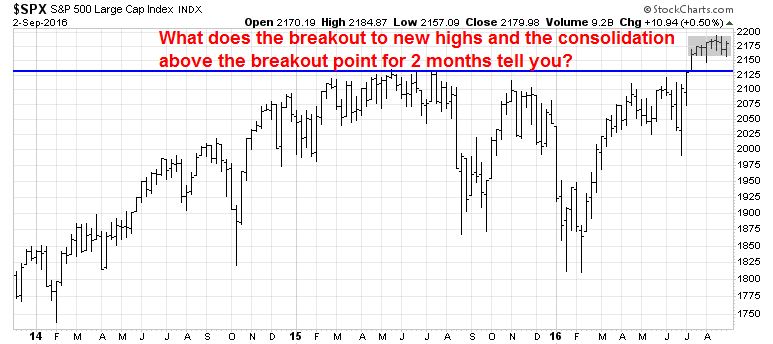
Technical analysis is the art of listening to the message of the market. The chart below shows that the market broke out to new all-time highs in July. It has been consolidating sideways since then, but it has held above the breakout point. What message is it telling us?
In addition, I highlighted analysis last week from Chris Ciovacco showing a rare bullish crossover of the 30, 40, and 50 week moving averages.
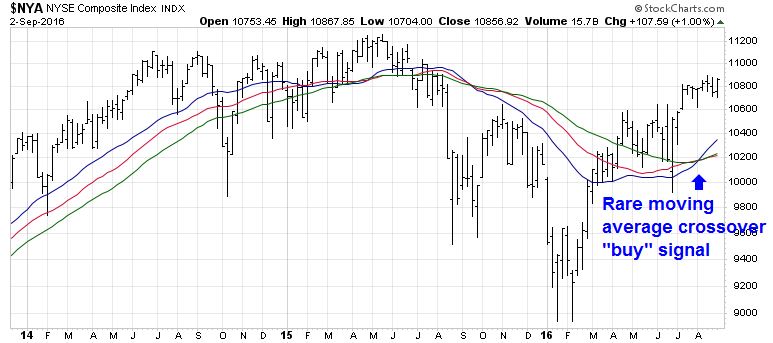
In the past, such buy signals have last lasted between several months and several years.

NedDavis Research pointed out last week that long-term breadth is holding up despite the recent consolidation and minor pullback to the bottom of the range. Ed Clissold of NDR interpreted these readings bullishly. It suggests that any seasonal weakness is likely to be contained.
Price action is telling a story and its tale of bullish momentum has to be respected.
Investors still skeptical
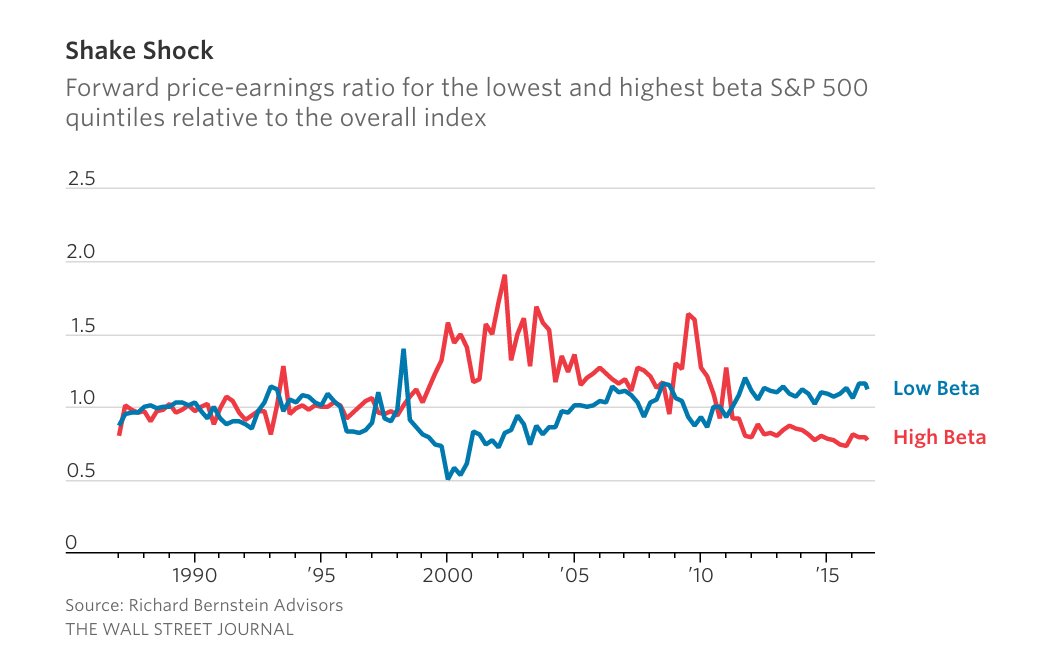
Despite extensive evidence of fundamental and technical momentum, investors are still cautious. This chart from Rich Bernstein shows that low beta stocks are trading at a premium to high beta stocks. To the extent that investors had been buying stocks, their participation had been confined to the defensive sectors of the market. This is a sign of excessive skepticism.
The latest readings of the AAII survey and Rydex traders also show lukewarm enthusiasm for stocks. Sentiment among individual investor is dead neutral, in spite of the nearness of all-time highs.

The weekend cover of Barron’s shows a high degree of cautiousness from Street strategists.

The BAML Sell-Side Indicator graphically illustrates the Street`s defensive posture and it has flashed a contrarian buy signal.
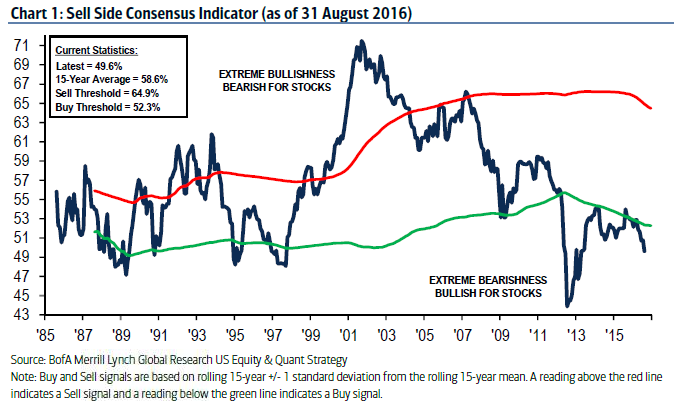
Stock markets tend to top out when investors are all-in, not when they are skeptical. From a purely technical perspective, the combination of positive price momentum and investor skepticism suggests that equity market strength has a lot further to run before it tops out.
Turbulence in 2017?
However, there may be some market turbulence ahead in 2017 (see The roadmap to a 2017 market top). The current round of macro momentum is likely to start petering out in 6-12 months.
For instance, the latest Jobs Report is showing the typical signs of a late cycle economic expansion. In the last two cycles, temp jobs (blue line) peaked out between 10 and 17 months before the NFP peak (red line). In the current cycle, temporary employment peaked in December 2015 and has plateaued since then. Unless temp job growth recovers, the clock is ticking and stands at eight months.

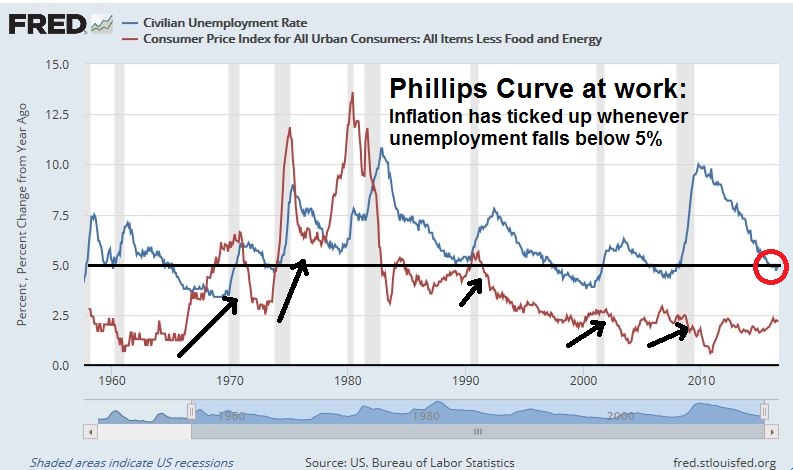
In the past, there has been a strong historical relationship between unemployment (blue line) and inflation (red line). Whenever the unemployment rate has fallen below 5%, inflationary pressures have manifested themselves. The current unemployment rate stands at 4.9%. The dilemma for policy makers is to correctly estimate the non-accelerating inflation rate of unemployment (NAIRU) in order to properly manage monetary policy. NAIRU estimation in this economic cycle is complicated by the unusual features of a high degree of slack in the labor force and an inflation rate that has been resistant to monetary stimulus.
Despite the apparent lack of inflation, Bloomberg reported that some major bond investors are starting to position themselves for its return. This time, inflationary pressure will not come from monetary stimulus, but from fiscal stimulus.
Many of them are once again predicting — and, more importantly, actually gearing up for — a pickup in inflation. Pioneer Investment Management, for instance, is setting up the first-ever global inflation-linked bond fund in its 88-year history. Partly with that same threat in mind, Pacific Investment Management Co. is cutting the duration of the bonds it holds in its $63 billion Income Fund.
This time will be different than those previous episodes, they say, because fiscal policy rather than monetary policy will serve as the principal driver of higher prices. From the U.S., where both presidential candidates are promoting stimulus plans, to Japan, where lawmakers approved a $46 billion infrastructure program, to the U.K., where the Chancellor of the Exchequer has indicated he could ramp up spending, talk of fiscal largesse is in the air.
The shift in the debate is in part something of an acknowledgment that lax monetary policy, for all the work it did propping up the global economy in the wake of the 2008 crash, ultimately failed when left on its own to bring the rates of growth — and inflation — back to pre-crisis levels. Fiscal stimulus, the thinking goes, will be more effective at putting cash immediately in the hands of consumers.
“We have reached a point where governments realized that austerity will not help,” said Cosimo Marasciulo, who, as head of government bonds at Pioneer, helps manage $250 billion of assets. “Some are abandoning that idea and shifting their focus to stimulating the economy. They’ve not been aggressive yet, but it’s a start. We cannot underestimate its implication on inflation.”
The wildcard for investors is the Fed’s reaction function. How quickly will it recognize signs of economic strength and possible inflationary pressures in light of its “dual mandate [that] aims for maximum sustainable employment and an inflation rate of 2 percent” (via vice-chair Stanley Fischer)? If the new president were to propose an infrastructure spending program, as both Clinton and Trump have been promised, then will the Fed take that as a signal that it can start to raise interest rates? If so, how quickly would it act?
How the Fed can trigger a bear market
Here is my base case scenario for the next 6-18 months. The stock market rises in response to a better growth outlook, both in the US and the rest of the world. The bull phase should last at least until the end of this year.
In response to a stronger growth outlook and rising inflationary expectations, the Fed then acts to start normalizing interest rates. The question of whether the first quarter point hike occurs at the September or the December meeting is not terribly relevant. The bigger question is the pace of rate normalization in 2017.
There may be additional bearish forces at play next year. I pointed out last week (see The roadmap to a 2017 market top) that a Clinton victory may see Fed governor Lael Brainard being offered a post within the administration. Such a development would deprive the FOMC of a dovish voice and raise the risk of a Federal Reserve policy error that could push the American economy into recession.
When does the three steps and a stumble rule, where three consecutive rate hikes trigger a bear market and recession, come into play? That is the big unknown that investors have to grapple with. That is also the reason for my “data dependence” in 2017.
Imagine the following scenario. The Fed makes a policy error by tightening the American economy into a mild recession. One scenario may involve monetary policy falling behind the inflation-fighting curve and the Fed has to respond with a series of staccato rate hikes that slams the economy into a recession. Alternatively, we could see a series of premature rate hikes that inadvertently pushes an already fragile economy into a slowdown.
Viewed in isolation, any Fed-induced slowdown should be relatively mild because of the lack of excesses built up in the current expansion. From a global perspective, however, a US recession could be a disaster. In this cycle, the excesses are not to be in the American economy, but abroad. The combination of the withdrawal of American consumer demand and past extravagances is likely to be lethal to China. In a recent post (see How bad could a Chinese banking crisis get?), I postulated a Chinese hard landing would tank most of Asia into recession. In addition, the loss of Chinese capital goods demand is likely to have the domino effect of pushing Europe into recession as well. In particular, Europe poses a special vulnerability for the world as it has not sufficiently address the problems in its banking system that appeared in the last crisis. In effect, a hard landing in China has the potential to set off dual banking crises in both China and Europe.
Business Insider reported that Bridgewater Associates largely agreed with my assessment of risks posed by China. Bridgewater recently reiterated its concerns over China’s “unsustainable buildup of credit”. It added that, “This rapid expansion in credit looks like it has created significant vulnerabilities in the Chinese financial system at a time when the economy is still near the front end of a material loss cycle”. The table below summarizes their projections of the likely consequences of a burst credit bubble in China. Much of the damage is mitigated by the fact that most of Chinese debt is domestic and the level of external debt is relatively low. Nevertheless, a Chinese financial crisis is likely to be resolved with several years of anemic growth, which would be devastating to many of her trading partners.

I recognize that my scenario of a market top and subsequent bear market is highly speculative and involves many moving parts. Nevertheless, it highlights the risks of a policy error by the Federal Reserve.
The week ahead
Looking to the week ahead, the intermediate term outlook is appears to be bullish. Nautilus Research recently featured a historical study showing that minor pullbacks tend to lead to renewed market strength.

Dana Lyons also showed historical analysis indicating that market tight consolidation ranges near new highs tended to resolve themselves bullishly. However, the initial break tended to start with a one day downdraft, followed by a prolonged price surge.

This time, the minor weakness on Thursday may be all the pullback we see. The disappointing news from the manufacturing reports on Thursday was a golden opportunity for the bears to push stock price downward, but the market bottomed intraday at a key support level and rallied to close the day roughly unchanged. In this case, the market’s inability to fall in response to negative news could be an indication that stock prices are ready to rise again.
After the close on Thursday, I tweeted a series of charts indicating that the market was sufficiently oversold to warrant a rally. However, I was reluctant to take a position given the risks posed by the Jobs Report that was scheduled for Friday morning. According to IndexIndicators, breadth indicators such as the percentage of stocks above their 10 dma had become sufficiently extended on an intraday basis to flash an oversold reading.

This chart of net 20-day highs-lows, based on closing prices, did flash an oversold condition on my trading model with a 1-2 week time horizon.

The market had experienced a positive RSI-5 divergence on the hourly chart.
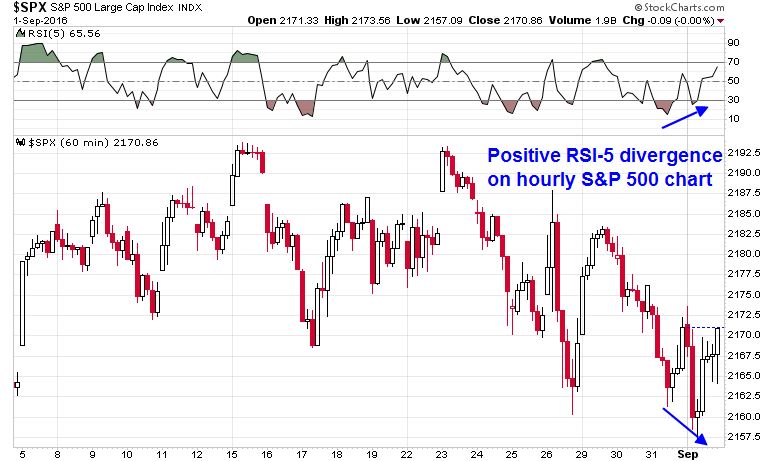
In addition, the daily chart showed a positive RSI-5 divergence, a doji candle, which is indicative of market indecision as it tested a short-term support level, and the VIX Index could not rise above its Bollinger Band. All of these are bullish signs.

Market internals were positive. Risk appetite metrics such as the junk bond market and high beta small cap stocks confirmed the underlying strength of the market.

Further analysis of the normalized equity-only put/call ratio also showed signs of bearish exhaustion. The ratio had fallen to a level that in the past either signaled a period of sideways consolidation (blue lines) or correction (red lines). In the current instance, readings were normalizing from an excessively bullish condition but the bears could get the correction done.

In the wake of the equity benign Jobs Report, my inner trader concluded that downside risk was limited. He added to his long equity position by buying into high beta small cap stocks.
My inner investor remains bullish and overweight equities. He is positioned for an equity rally into further highs later this year and next year.
Disclosure: Long TNA, SPXL
Friday’s soft jobs report plus the downside miss on PMI reinforces the lower for ‘longer’ theme. I expect the same leadership to emerge as occurred when this ‘lower for longer’ new bull market was born in January-February. That is gold, commodities, commodity currencies ($Cdn), dividend ETFs, value stocks outperforming momentum stocks, high yield bonds,
I used the correction low on Wednesday of the GDX Gold Miners ETF to get back into gold. Sentimentrader.com showed an extreme in pessimism at that point. That was all I needed to get back into this powerful gold bull market. The gold bull market has a long way to run. It can be owned by bulls or bears for their own reasons.
While I used base metals mining and energy early in the year as well as gold, now I am just using gold. I’m skeptical of supply/demand fundamentals in those commodities and would need the stocks to pull back to bargain levels to take a new position.
Ken – Welcome back! I hope you had a good holiday.
IMHO, the issue isn’t whether the Fed moves a quarter point in September or December, but the pace of rate normalization in 2017. Neither Friday’s job report, nor the miss on PMI will have much influence on those decisions. It will more on the Fed`s analytical framework and incoming data in the months ahead.
That`s the wildcard we know nothing about.
I’m also glad to have Ken back, who makes an interesting point about base metals and energy–they have indeed been less strong since spring whereas gold is still strong. But rather than rely solely on gold, I’ve taken larger positions in emerging markets as a way of playing commodities. And although I’ve pruned back my energy position, I’ve still holding. We shall see.
Cam, how do we reconcile the relatively benign macro indicators you’ve listed with the stuff here:
https://northmantrader.com/2016/09/10/time-to-get-real-part-ii/
There’s a set of historically proven pre-recession indicators that are flashing red.
thanks
Notwithstanding the fact that Northy has been perennially bearish, let me try to address the issues he raised in that post:
First, on the issue of the “historically proven pre-recession indicators”, Ask the following key question on any recession forecast model (a question that any trader should be familiar with): Is this result backtested, or are they based on out-of-sample results?
When he says that he “found” 4 recurring, common elements preceding recessions, it indicates a backtest. We know some of the problems with backtests. It is also unclear what the trigger rules are for a recession. Consider his four indicators:
1) Corporate profit growth: I use corporate profits as a leading recession indicator too, but it’s important to know, in real-time, how many false positives you’ve had and what you mean by a recessionary signal. Is the line falling below zero the signal? If so, there have been a few false signals, but it’s not a bad indicator. Is faltering momentum the signal? In that case, we’ve had many more false positives.
2) Household network growth: In this case, it appears that he is using declining growth momentum as a recessionary warning. If that’s so, then there are far more false positives. In that case, is that an indicator to be trusted?
3) Consumer confidence growth: Again, a problem of lots of false positives.
4) U6 unemployment: Georg Vrba uses a similar momentum based signal using unemployment rates for recession forecasting. His conclusion, “Not yet”. See http://imarketsignals.com/unemployment-rate-and-recessions/
Overall, the entire post seems to be one where he comes to a conclusion first and then finds the data to fit his case, rather than the other way around. As an example, while rising debt levels has been cited as a concern for decades by many predicting a financial meltdown (goldbugs in particular), it has been less of problem for countries that can print their own currency (see Japan and the widowmaker trader of shorting JGBs as an extreme example). As well, my problem with ideologically based investing like this is you don’t have a rule to buy back in. I can remember similar kinds of rhetoric in my youth when Reagan very effectively used the ballooning deficit against Carter in the 1979 election. If you believed back then that the world was ending, you would have missed several enormous bull markets.
I also find it somewhat disingenuous the way he cherry picks data, such as his use of falling consumer credit in a chart to make a case of imminent doom. If you were to extend that chart back to previous cycles (and FRED certainly has that data), you can see that a very different (benign) picture: https://fred.stlouisfed.org/graph/?g=73Ge
I have made it clear that I am no permabull. I sounded warnings about a possible recession next year and, as Northy correctly points out, recessions are bull market killers. However, current macro models readings are still benign. My greatest concern is a policy error by the Fed which slows the US economy but has far reaching global effects that trigger a slowdown from abroad.
For now, we can enjoy the bull market and wait for the warning signs to materialize.