Preface: Explaining our market timing models
We maintain several market timing models, each with differing time horizons. The “Ultimate Market Timing Model” is a long-term market timing model based on the research outlined in our post, Building the ultimate market timing model. This model tends to generate only a handful of signals each decade.
The Trend Model is an asset allocation model which applies trend following principles based on the inputs of global stock and commodity price. This model has a shorter time horizon and tends to turn over about 4-6 times a year. In essence, it seeks to answer the question, “Is the trend in the global economy expansion (bullish) or contraction (bearish)?”
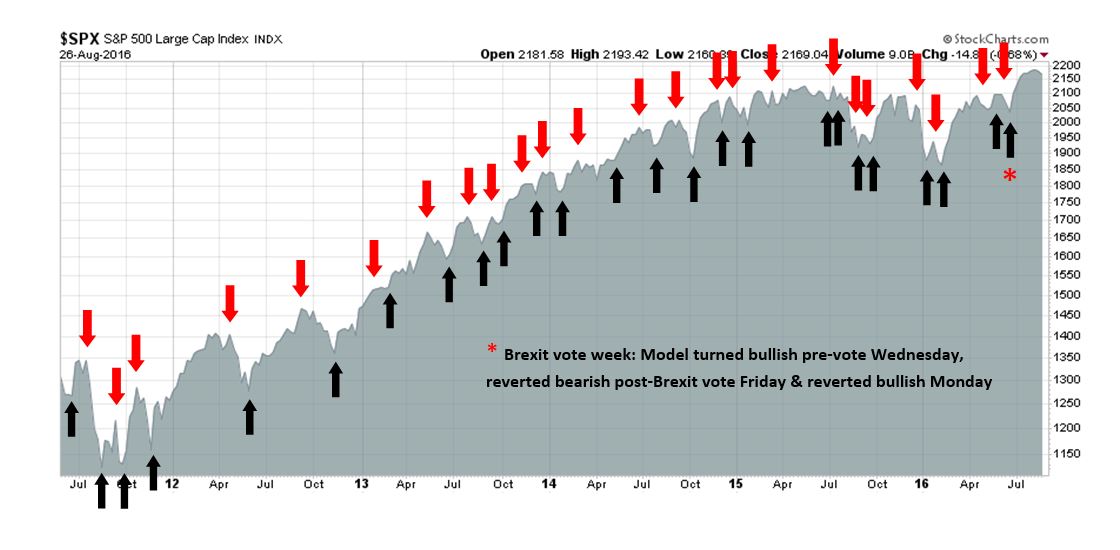
My inner trader uses the trading component of the Trend Model to look for changes in direction of the main Trend Model signal. A bullish Trend Model signal that gets less bullish is a trading “sell” signal. Conversely, a bearish Trend Model signal that gets less bearish is a trading “buy” signal. The history of actual out-of-sample (not backtested) signals of the trading model are shown by the arrows in the chart below. Past trading of the trading model has shown turnover rates of about 200% per month.
The latest signals of each model are as follows:
- Ultimate market timing model: Buy equities
- Trend Model signal: Risk-on
- Trading model: Bullish
Update schedule: I generally update model readings on my site on weekends and tweet any changes during the week at @humblestudent. Subscribers will also receive email notices of any changes in my trading portfolio.
A 2017 market top?
I don’t want anyone to get the idea that I am a permabull. I have been steadfastly bullish on stocks for all of 2016. This may be the time to sound a cautionary note by outlining a scenario of how stock prices could make a cyclical top next year.
The chart below shows how the stock market behaves during the four-year presidential cycle. The black line shows the pattern based on past monthly median returns and the blue line shows the pattern based on average monthly returns. Statistically, median returns (black line) are better representations than average returns (blue line) because averages can be distorted by large outliers, such as the Crash of 2008.

The stars may be aligning for a replay of the presidential cycle, where stock prices rise into next year and possibly top out next summer. In this week’s post, I will discuss:
- The bullish tailwinds prevailing for stocks today
- The timing of a possible cyclical peak
- The bearish headwinds that could lead to the formation of the market peak.
Why I am a bull
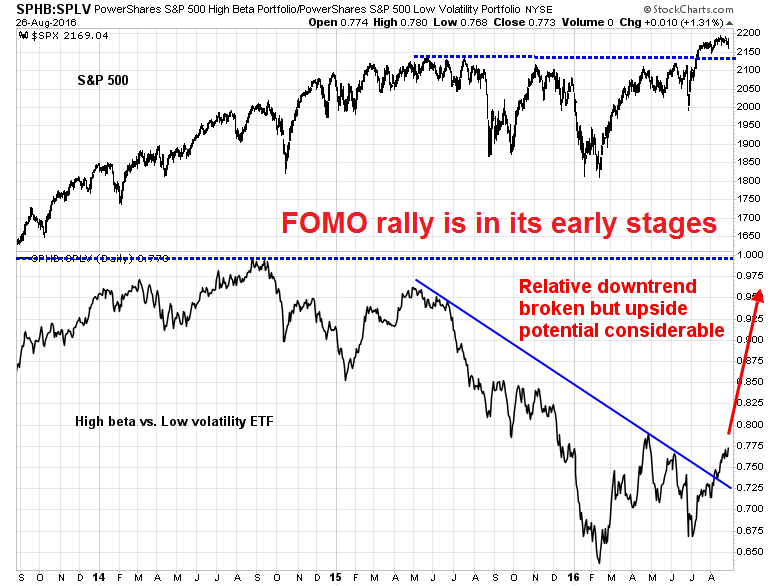
I hate to sound like a broken record week after week so I’ll be brief in setting out the bull case, consisting of an overly defensive investment community that was caught flat-footed by a growth revival. The result is a FOMO (Fear Of Missing Out) rally. This rally is just getting started and it`s likely to last for several more months before petering out.
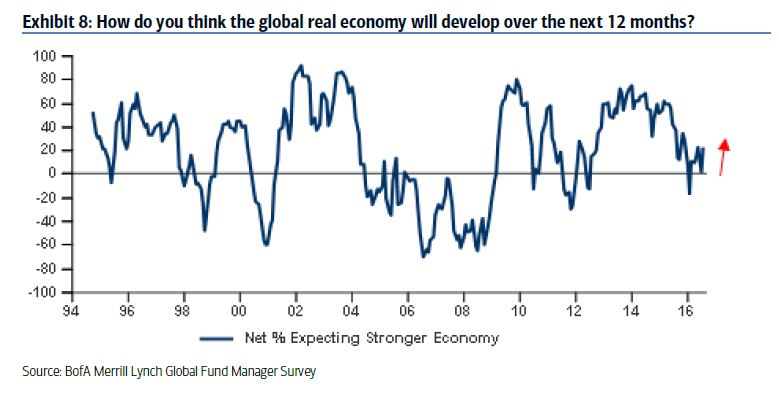
We can see signs of a FOMO rally from the results of the latest BoAML Fund Manager Survey. Global growth expectations are just starting to tick up from a subpar level.
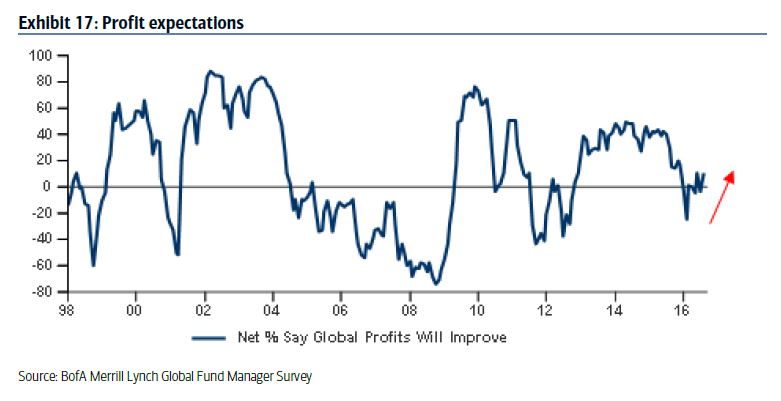
Profit expectations are rising, also from depressed levels.
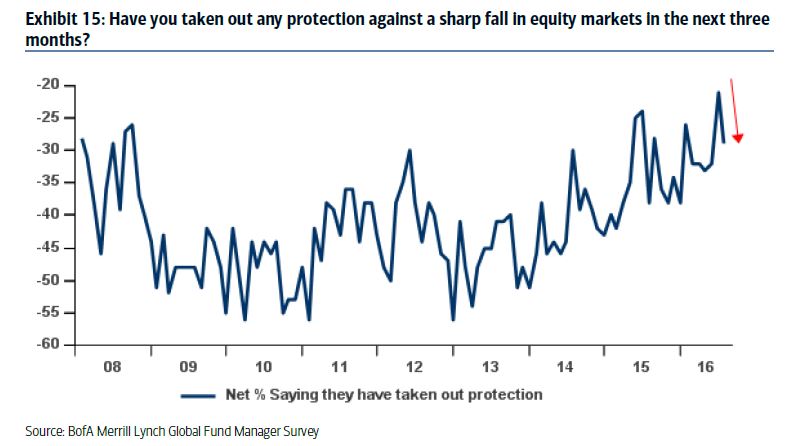
On the other hand, fund managers were overly defensive in their portfolio positioning. Their equity allocations have been low and just starting to rise. As equity weights are nowhere near a crowded long reading, there is significant potential for higher prices should a buying stampede develop.

This chart also shows that managers had taken out tail-risk protection as fear levels spiked, and that protection is in the process of being unwound.
In the meantime, fundamental momentum continues to be positive. The latest weekly update from Factset shows that forward 12-month EPS estimates are continuing to rise, which reflect Street optimism about the earnings outlook (annotations in red are mine).

The better growth outlook is not just restricted to the US market. Global developed market EPS estimates are tracking higher as well (via Gavekal).

When I put it all together, we have the ingredients for a market melt-up. A growth surprise has sparked a risk appetite revival, which is only in the initial stages of an upturn. The potential for a buying stampede is high, as readings are nowhere near crowded long levels.
Timing the market peak
Given the bullish triggers that I have outlined, the next question is the timing of a market peak. A possible answer came from some terrific analysis put out by Chris Ciovacco last week (click link to see his full explanation on video). Ciovacco found a rare buy signal that has occurred only 10 times since 1982, where the 30, 40, and 50 week moving averages (WMA) of the NYSE Composite all turn up. In these signals, the 30 WMA is above the 40 WMA and the 40 WMA is above the 50 WMA. In the past, such signals have led to market uptrends that can last up to several years. The chart below shows past buy signals along with their length.

To determine the likely length of the current buy signal, there are two things to consider. First, the combination of the three weekly moving averages is a trend following model, but trend following models tend to be late in spotting turning points in a trend. Typically, the market tops out one or two months before the crossing averages flash a sell signal. If the market were to top out in 26-78 weeks, then subtracting 4-8 weeks, or 1-2 months, yields a market top in 6-12 months.
Instead of just calculating the average length of a buy signal, I tabulated the frequency of the length of each buy signal. This analytical technique yielded an interesting 1.5 year longevity rule. If the bull phase lasts more than 1.5 years, then the bull phase is likely to be more lengthy and has the potential to last 3-5 years. Otherwise, there seems to be a cluster of buy signals that lasts about 6-12 months.
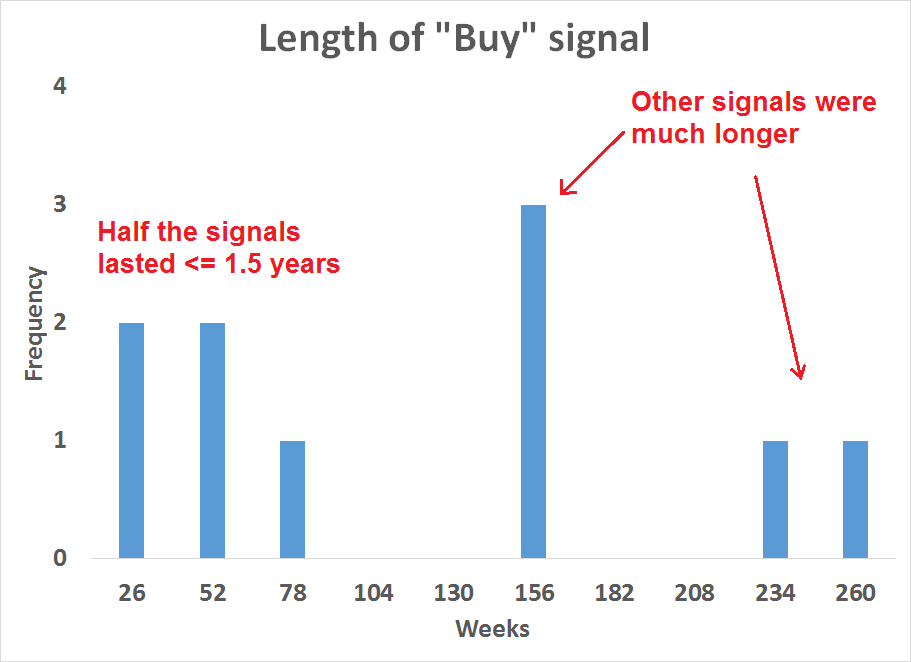
Ciovacco’s analysis lends a technical underpinnings to my thesis of a sustained intermediate term uptrend in stocks. When I combine his insight with my examination of the macro and fundamental forces of bearish headwinds that are forming, it suggests a market rally in the short-dated 6-12 month cluster in the distribution chart above.
Lurking bears
No market goes up forever. Here are the four fundamental and macro factors that are likely to stall a market rally in the next 6-12 months:
- Valuation
- Rising wages pressuring corporate margins, which will pull down earnings growth
- The rising risk of a China debt crisis
- Possible changes at the Fed
Valuation: The Morningstar fair value estimate is one way to measure valuation. Currently, this metric shows that the market is slightly overvalued. Should we see a FOMO rally and melt-up, stock prices will start to lose valuation support.

For now, the Barron’s weekly report of insider activity shows that the behavior pattern of this group of “smart” investors is relatively benign. In the past, the combination of excess valuation and sustained insider sell has been a warning for the markets.
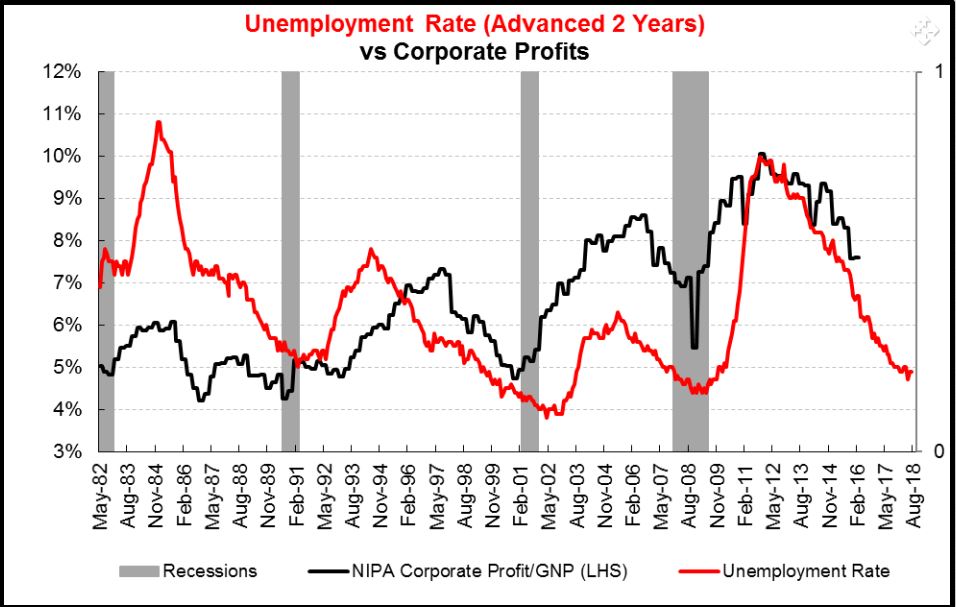
Wage pressures: While we are currently seeing the positive macro effects of better economic growth, those tailwinds are unlikely to last very long. That’s because a tight labor market is pressuring wage growth, which has risen to levels well beyond the Fed’s 2% inflation target.
Variant Perceptions pointed out that the unemployment rate tends to lead profit margins by about two years. This effect should be especially noticeable, as the economy is at or near full employment, which puts upward pressure on wages that cut into operating margins.
China debt crisis: I recently wrote about the possibility of a China slowdown and debt crisis (see How much “runway” does China have left?). In that post, Michael Pettis had made a number of optimistic assumptions and modeled the likely outcome. He concluded that China is likely to experience a debt crisis in 2-3 years. In a year from now, that time horizon shrinks to 1-2 years under some fairly optimistic assumptions. The stress levels in China are likely to rise and so will global risk levels.
Bruegel highlighted the growth of the Chinese banking system, which is now the world`s largest. Even though much of the debt is denominated in yuan and any debt crisis is likely to be relatively contained within China, an implosion in the world`s largest banking system can`t be a good thing for global finance.
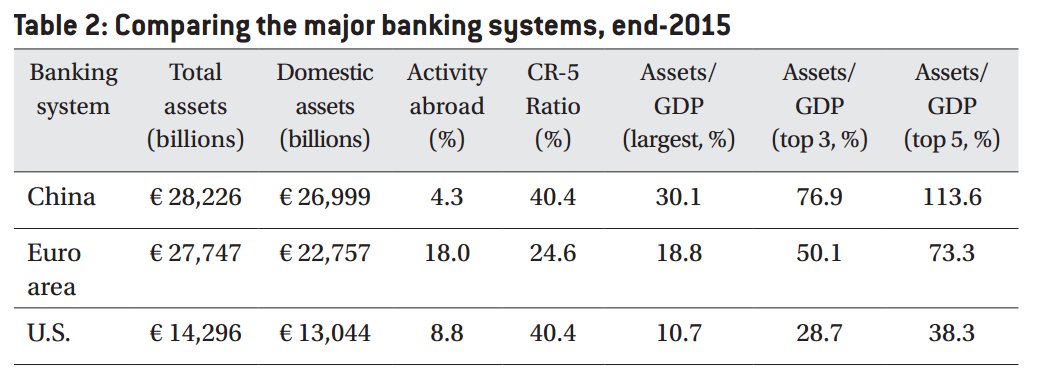
Recently, the IMF warned that USD 2.9 trillion in the Chinese shadow banking system is classified as “high risk”. The Chinese property canaries in the coalmine are warning of rising risk levels, as the real estate market is rolling over again. I have no idea how long Beijing can hold this together, but risk levels is likely to rise as the Chinese authorities continue to kick the can down the road.

Changes at the Fed: This may seem like an “inside the Beltway” story, but I have been watching how the composition of the Federal Reserve board might change after the election. Right now, the odds indicate that Hillary Clinton is likely to become the next president of the United States. A NY Times profile of Fed governor Lael Brainard indicates that Clinton may tap Brainard for a post within the new administration. Should such a development occur, it would deprive the Federal Reserve a leading dove (see my assessment of the three camps within the Fed at Showdown at Jackson Hole? Forget it!).
Ms. Brainard has become the leading voice among Fed officials for a concern widely shared among left-leaning economists: that the central bank will raise rates too quickly, potentially stifling economic growth. It is a role that has raised her profile in Democratic circles, and driven speculation that she is in line for a top job if Hillary Clinton wins the White House.
Gene Sperling, a longtime Democratic policy maker who is now advising Mrs. Clinton’s presidential campaign, hired Ms. Brainard as his deputy at the Bill Clinton White House in the mid-1990s. He said he was tickled that lately, when he gives public speeches, he is often asked about her views.
“My outside impression is that she has been as much a champion as anyone on the inside for the go-slow, full-employment perspective that many of us on the outside are advocating for,” Mr. Sperling said.
Ms. Brainard has fueled the talk about her future by donating $2,700 to the Clinton campaign — the maximum amount an individual can give — raising eyebrows at the Fed and among congressional Republicans. Mrs. Clinton has said she intends to fill half her cabinet with women, and Ms. Brainard is among the few widely regarded as having the relevant credentials to serve as United States trade representative — or, even better, Treasury secretary, a job no woman has ever held.
Within the Fed, the opinions of governors like Lael Brainard tend to hold much more weight than regional presidents. As an example, a recent Bloomberg story documented how the boards of 8 of the 12 regional banks had voted to raise rates, but policy remained accommodating, largely because of dovish voices such as Lael Brainard. While I don’t want to over-emphasize the importance of any single Fed governor, the absence of Brainard will, at the margin, result in a more hawkish monetary policy. It would also raise the risk of an overly aggressive Fed tightening so much that the economy falls into recession.
When I put it all together, my base case scenario calls for a market melt-up with an upside SPX potential of 2400-2600, followed by a cyclical market top in the spring or summer of 2017.
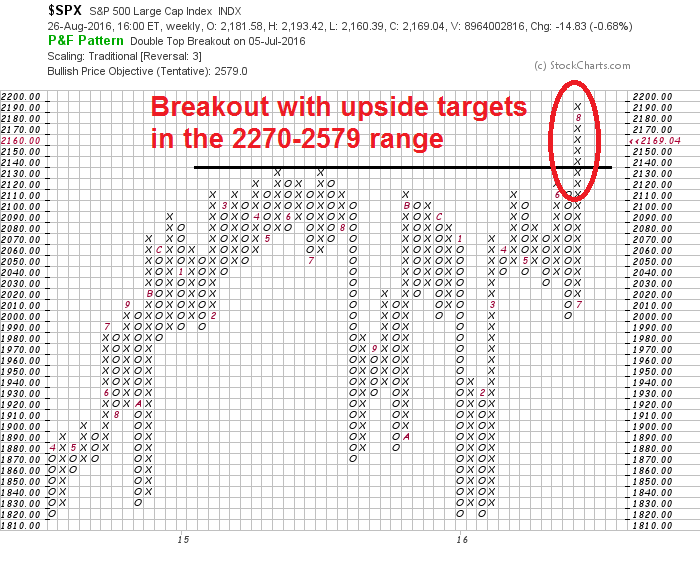
Upside potential of 10-20%
Having outlined the possible bullish and bearish catalysts for a market melt-up and market top, I know that I will get asked about my upside target for the market. For that, I turn to point and figure charting. By varying different parameters in the point and figure chart, I get a range of SPX targets that range from 2270 to 2579, with two clusters. One cluster is in the mid 2300 level and the other is in the 2540-2579 range. That puts the potential upside at roughly between 10-20% from current levels.
The week ahead: All eyes on the Jobs Report
Looking to the week ahead, I wrote that the SPX may be vulnerable to a shallow pullback to the 2100-2140 level (see The market catches round number-itis). My assessment is unchanged. In addition, major market indices experienced an outside day reversal while closing down. This pattern typically resolves itself with a period of weakness.
On the whole, market participants are likely to be jittery next week. They will mainly be keying in on the Jobs Report, which will be released next Friday. Fed chair Janet Yellen’s remarks on Friday that “the U.S. economy [is] now nearing the Federal Reserve’s statutory goals of maximum employment and price stability” is agreement with vice chair Stanley Fischer’s speech indicating that “we are close to our targets”. In an interview on CNBC, Fischer stated that Yellen’s speech is consistent with two rate hike in 2016, but it would depend on incoming data. In particular, he singled out the August Jobs Report as a key data point to be watched.
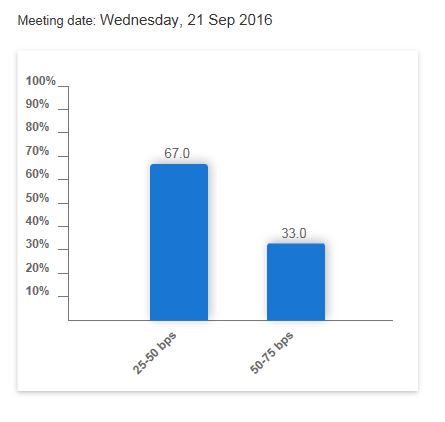
The current readings of the CME FedWatch Tool shows that the market is only discounting a single quarter point rate hike this year. The odds of a rate hike in September is 33%:
…and the odds of two rate hikes by December is only 14.7%:
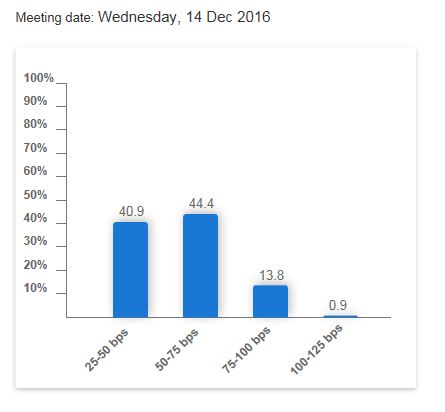
Should the August report come in at or better than expectations of 180K, expect stock prices to weaken as it discounts the possibility of two rate hikes. In the meantime, the market is likely to be stay nervous until the Jobs Report on Friday.
My inner investor remains bullish on equities. He believes that any pullbacks are likely to be minor, as he is betting on continued growth surprises from both the economy and company fundamentals. Intermediate term price momentum is strong, which is technically bullish. Moreover, recession risk remains low and therefore there is minimal risk of a cyclical bear market over the next 3-6 months.
My inner trader is constructive on stocks as he doesn’t want to fight the bullish intermediate term trend. On the other hand, he is nervous about the near-term downside risks to prices. He has a partial long position and he is prepared to buy more should the market weaken.
Disclosure: Long SPXL
I would be interested in hearing your thoughts as to what this means for developed and non-developed countries outside the US if we are to see 10-20% fear of missing out rally take hold. Would it be simply higher beta areas move as you would expect in a risk on environment, even greater because of the underperformance in recent years or this fear of missing out more centered on the US and ex-US continue to lag until closer to the time of the next recession?
Here is my best guess on the sequencing of the upleg of the rally:
1) US market rallies on growth revival as growth and momentum investors pile in
2) EM markets also rally at the same time, as they tend to be high beta markets
3) Non-US markets then play catch-up as value investors look for alternatives because of rising valuation of US equities
As for the sequencing of the top, it will depend on the fundamental trigger.
Thanks
Cam: the economy is overheating so much that a rate increase should have already taken place. The only reason it hasn’t is political, meaning the coming election. After November, that obstacle will be gone and the Fed will ( should ) start a policy of rapidly increasing rates, 1 % minimum in six months.
So, yes, the top will happen in early 2017 and what comes after will not be very nice.