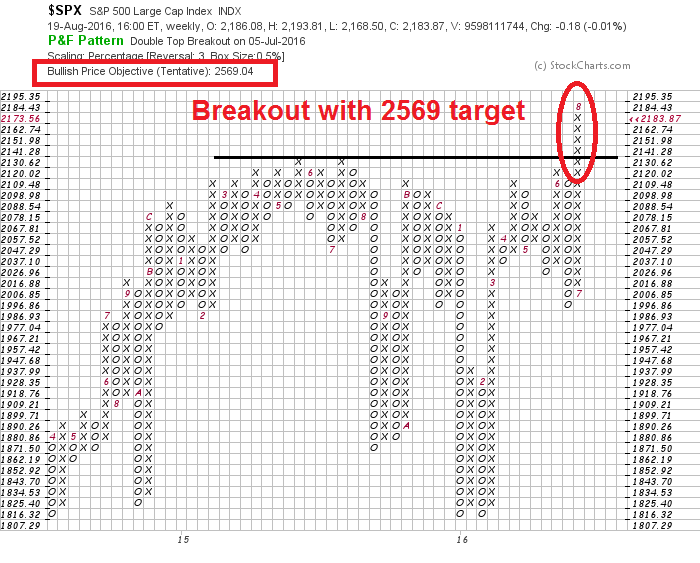
Mid-week market update: On the weekend (see The market’s hidden message for the economy, rates and stock prices), I wrote that the short-term outlook was more difficult to call than usual. On one hand, we were seeing broad based strength, which argued for an intermediate term bullish call. On the other hand, Urban Carmel pointed out that the market has a tendency to pause when it nears a round number. In this case, the hurdle is 2200 on SPX.

The latter scenario seems to be winning out. The market is catching a case of round number-itis for the following reasons:
- Macro momentum became “overbought”;
- Overly bullish short-term sentiment; and
- Deteriorating short-term breadth.
Macro momentum: Too far too fast
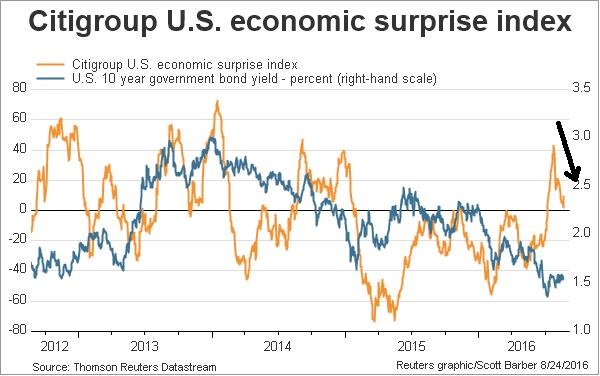
In the past few weeks, I have detailed how a turnaround in growth expectations caught many investors off-guard and fostered a FOMO (Fear Of Missing Out) and TINA (There Is No Alternative) rally. Now that the rally is in full swing, macro momentum is starting to peter out. While it`s still positive, the degree of improvement is decelerating. As an example, the Citigroup US Economic Surprise Index, which measures whether macro-economic releases are beating or missing expectations, is slowing dramatically.
Callum Thomas also highlighted a slight slowdown in global PMIs. While PMIs are still positive, the latest figures paint a picture of slightly softer manufacturing in August.

To be sure, the fundamental momentum is still positive where it really counts for the stock market. The latest update from Factset shows that the Street is still revising forward 12-month EPS upward.

A crowded long
From a sentiment viewpoint, models are showing that the fast money has rushed to the long side. Stock prices have tended to encounter trouble advancing under such conditions.
Hedgopia reports that large speculators, or hedge funds, have moved to a crowded long in the high-beta NASDAQ 100 e-mini contract. I have found in the past that the Commitment of Traders report on NDX futures contract has been the best contrarian indicator of market direction.

Mark Hulbert also found that NASDAQ timing newsletters are in a similar crowded long reading, which is also contrarian bearish.

Deteriorating breadth
In addition, short-term breadth is deteriorating. This chart from Trade Followers shows a pattern of deteriorating bullish Twitter breadth and improving bearish Twitter breadth.

This chart from IndexIndicators tells the same story. While short-term breadth measures such as the % of stocks above their 10 dma are stuck in neutral, they are also displaying a series of lower highs. This pattern is indicative of deteriorating internals that foreshadow corrections.

Choppiness ahead
This week, BoAML strategist Savita Subramanian called for a correction. While I agree with her on direction, her correction forecast is largely overblown. The reasons that she cited are mainly fundamental, which have been in place for quite some time before her correction call. So what has changed? By contrast, my correction call is based on the short-term technical outlook of the market.
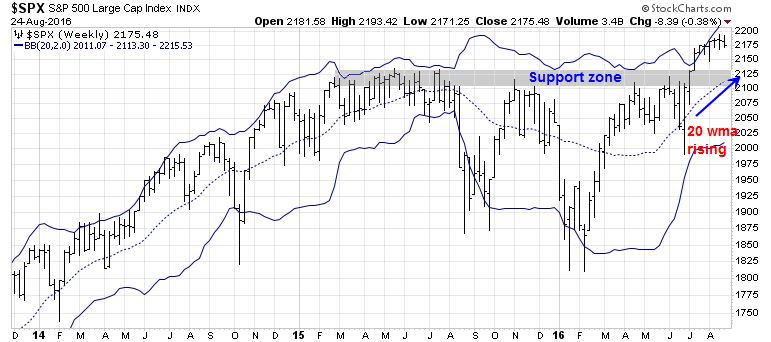
Urban Carmel‘s analysis indicated that past round number-itis pullbacks have ended at around the 20 week moving average, which currently stands at 2113 and it’s rising fast. That level is also the breakout level of the SPX, which was resistance now turned into support. If the market were to pull back, the 2100-2120 level is the most logical level of support.
My inner investor continues to be bullishly positioned. He is unconcerned about 3-5% corrective blips in the market.
Despite my near-term cautious outlook for the market, my inner trader is not inclined to sell everything just yet. Today`s SPX decline of 0.5% has seen the VIX Index close above its upper Bollinger Band. As the chart below shows, past episodes have marked tradeable bottoms that lead to rallies that typically lasts for 2-3 days.

The key takeaway from this analysis suggests that we are in for a period of greater volatility as the market corrects for the next 2-3 weeks.
Disclosure: Long SPXL