Mid-week market update: After the stock market rally off the panic Brexit bottom that took SPX to new all-time highs, the market has been in a tight trading range for the last 10 trading days.
As the chart below shows, the 5-day RSI, which is a useful short-term trading indicator,flashed a sell signal several days ago as it retreated from an overbought reading into neutral territory. This “should” have pushed the index down further, especially with the slightly hawkish tone from the Fed today. The logical initial support level is the mid-Bollinger Band, or 20 day moving average (dma), which is rising quickly but current stands at 2140. The next support would the the breakout level at about 2120.
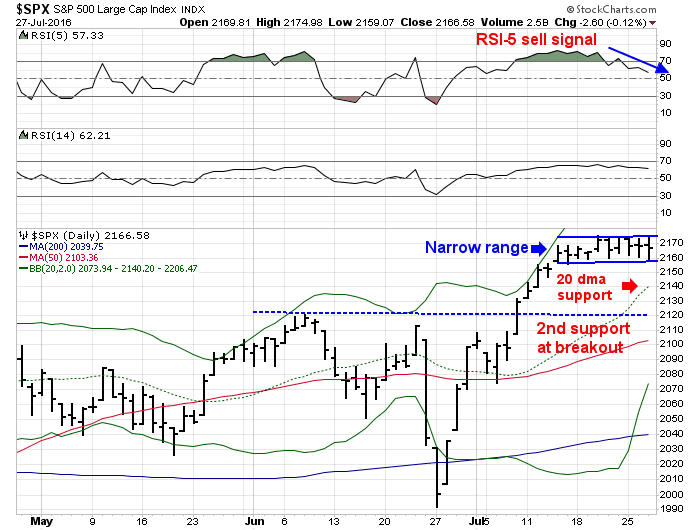
However, the slightly hawkish statement from the FOMC was not enough to push the market below the tight consolidation range. A market with a weaker tone would have fallen to at least test the initial support level, but it hasn’t. The key question for traders is, “Is this consolidation or corrective period over?”
Neutral, but not oversold
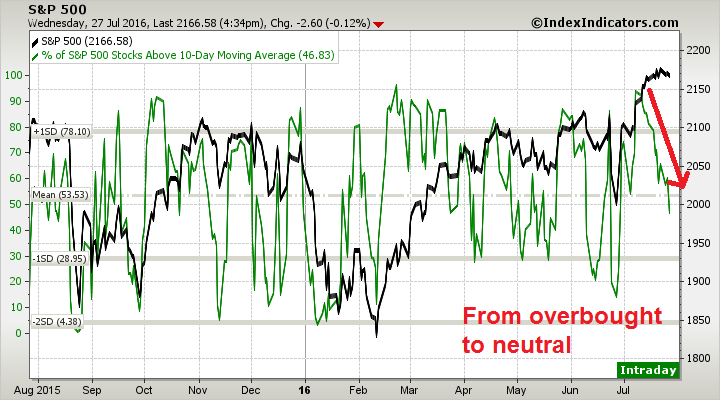
My initial conclusion is that, in light of the powerful intermediate-term bullish momentum, the risk-reward is improving for the bulls. This chart from IndexIndicators shows that short-term breadth has retreated from overbought to neutral, but it’s not oversold.
The intermediate-term (1-2 week time frame) net 20-day highs-lows also tell a similar story of a retreat to neutral levels.
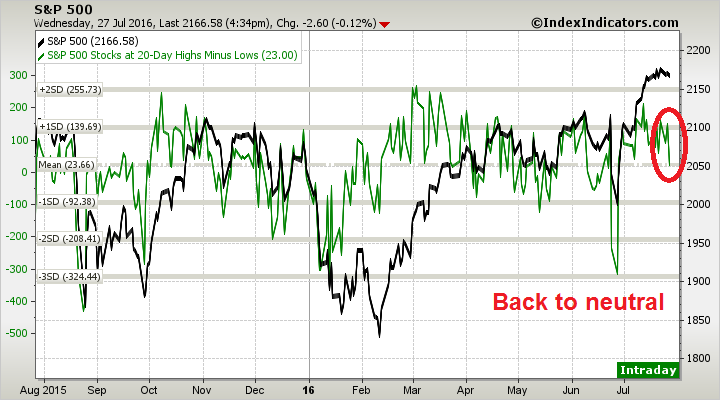
In light of the powerful breadth thrust that launched this rally, these readings indicate that the market could bottom out at current levels. While stock prices could pull back further, the market’s resiliency in the face of a hawkish Fed, where a September rate hike is back on the table, indicates a more favorable risk-reward ratio for the bulls.
Buying the leadership
For bullish traders, I can offer a couple of suggestions. I have been following a couple of groups that has been leading the market for the past few months that may be interesting long candidates. First, there are the small cap stocks, which has been recovering nicely since their bottom in February. The chart below shows the relative performance of the two major small cap indices against large caps and the both show similar patterns of market leadership.

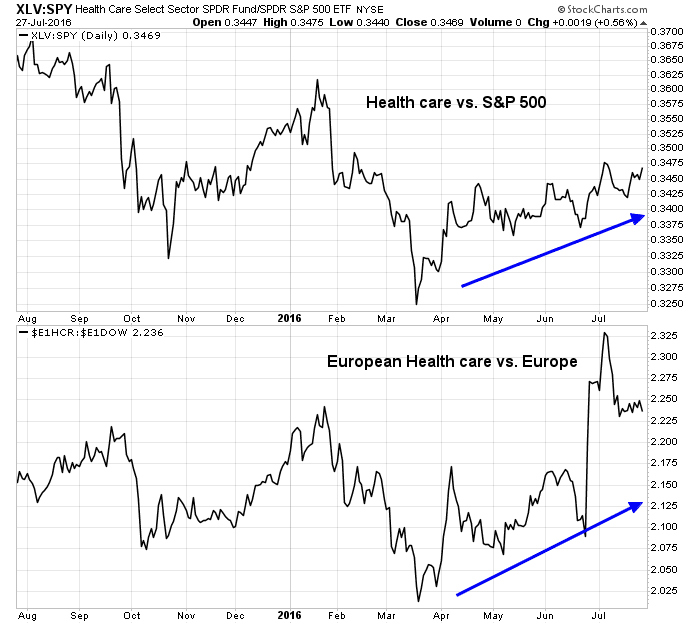
In addition, Health Care stocks have also displayed a consistent pattern of leadership since mid-March. The strength in this sector appears to be global, as the bottom panel shows that this sector has also become market leaders in Europe as well.
My inner trader will therefore be dipping his toe in the water on the long side within the next couple of days, likely in one or both of these groups. Stay tuned!
How does one view the ever growing divergence between the S&P500 and the cumulative A-D line?
Expect the market to catch up.
Thanks for the insightful commentary. Always enjoy your careful market analysis, this one is no different.