I have had a number of discussions with subscribers asking for more “how to” posts (see Teaching my readers how to fish). This will be one of a series of occasional posts on how to build a robust investment process.
For traders and investors, one of the challenges is how to build a robust discipline that works well through different market regimes. As a case study, consider this study from Simple Stock Model that generates signals based on the cash flows in and out of the SPY ETF as a sentiment signal. The trading rule is: “If the 4-week average of the 3-month change in SPY’s percentage of shares outstanding is greater than +5%, be out of the market.”
The chart below shows the equity curve from this trading system (white line = buy and hold, blue line = trading system). The results look pretty good, especially for a relatively low turnover model. (Incidentally, it’s on a sell signal right now).
SPY shares outstanding trading system
Not so fast! Don’t jump to conclusions before digging into the data and reading the fine print.
One big call
If you look at the details of the equity curve, you will see that the trading system made its money by avoiding the devastating bear market of 2008-09, but the market kept rising when it flash its other “sell” signals. If we were to restart the equity curve from the time this trading system flashed the all-clear buy signal after the 2008-09 bear market, it underperformed its buy-and-hold benchmark.
This is the first lesson. Evaluate the success rate, or batting average, of any trading system to see if the results are acceptable. In some cases, you may decide that a system with a low success rate with outsized gains is acceptable – just be aware of its characteristics and manage your risk properly.
Asymmetric signals
This trading model is a sentiment model and I used it as an example to illustrate another point. The market response to model readings don’t always behave the same way at buy and sell extremes. Model signals can be asymmetric, especially for sentiment models.
Consider this chart of NAAIM exposure, which measures the sentiment of professional RIAs. In this example, I have arbitrarily set the trading rule to buy when the NAAIM exposure falls below 20 and to sell when it rises above 95. The “buy” signals are marked with blue vertical lines and the “sell” signals are marked with red lines. As the chart shows, the “buy” signals have tended to be pretty good, as they have tended to mark panic market bottoms. On the other hand, “sell” signals, which indicate complacency, have been less than effective.
As these are backtested results, it could be argued that when I set the buy and sell signals at 20 and 95 respectively, I was torturing the data until it talked. As an alternative, I set the buy and sell signals when the NAAIM exposure reading penetrated its 2 standard deviation Bollinger Band with a one-year moving average. The conclusions are similar. Buy signals work much better than sell signals.
That is the second lesson. Measure the effectiveness of both your buy and sell signals. They may not be the same.
In a post next week, I will address some the issues that face the professional and institutional investor.
Mid-week market update: Since the time I issued a correction warning in late December (see A correction on the horizon?), the US equity market has traded sideways in a narrow range. Moreover, the SPX has alternated between a seesaw up-and-down pattern since early January – until today.
As the SPX breaks upwards to a new all-time high, and the DJIA breaches the psychologically important 20,000 mark, it’s hard to argue with price and momentum.
Overbought and vulnerable markets can correct in two ways. It can correct through price, with lower prices, or through time, with a sideways consolidation. The latter scenario is often accompanied by an internal rolling correction characterized by weakness in market leaders and nascent strength from laggards, which seems to be what has happened (see The contrarian message from rotation analysis).
The turmoil beneath the surface
Even as the stock market traded sideways for most of January, an anomaly began to develop in the option market. The VIX Index, which is a measure of index volatility, fell as expected, but SKEW rise dramatically (chart via Bloomberg). In other words, the cost of hedging a tail-risk event such as a market crash rose dramatically even as stock prices flattened and volatility fell. In fact, tail-risk fear is at levels not see since the correction last June, which stock prices actually fell.
What gives? Has the market been that nervous about the Trump administration? If so, shouldn’t the VIX Index be rising in anticipation of heightened market volatility? Who is right? The VIX or the SKEW Index?
It turns out that there are perfectly reasonable explanations for the low level of the VIX Index. As this chart of implied (orange line) and historical (blue line) volatility from iVolatility shows, historical, or realized, vol has been falling and therefore it is no surprise that implied vols have followed suit.
In addition, Julian Emanuel of UBS pointed out that the correlation between stocks have been falling since the election. Lower correlations between stocks create a greater diversification effect, which leads to lower index volatility and lower realized historical volatility. In addition, lower correlations can create the sorts of conditions where rolling corrections can occur, which is precisely what seems to have happened.
I have been wrong before and I am wrong now, as Mrs. Humble Student of the Markets have pointed out to me on numerous occasions. I mis-interpreted the rolling corrections, where cyclical sectors weakened and defensive sectors began to outperform as signs of weakening internals (see The contrarian message from rotation analysis). Instead, they turned out to be a healthy rolling correction.
Markets are breaking out
In the meantime, the markets have staged a broad based rally. The chart below shows that the DJ World Index has risen to new highs, just like the SPX. Even though the European averages have not rallied to new highs, they are displaying signs of strength.
Similarly, the Asian markets of China and her major trading partners are all well above their 50 day moving averages.
The cyclically sensitive industrial metals are also in a healthy uptrend.
What’s not to like?
Key risks
One of the key risks is this rally could turn out to be a bull trap. Ryan Detrick of LPL Financial observed that the market tends to rally after Inauguration Day, with a peak in early February. Could history repeat itself?
In addition, this chart from Trade Followers shows that Twitter breadth remains weak, which does not exactly inspire a great deal of confidence in the current upside breakout.
My inner trader has changed from a small SPX short position to a small long SPX position with a tight stop (don’t ask me how tight, because my pain threshold will be different from yours). Should the market rally further and VIX Index breach its lower Bollinger Band, that will be an overbought signal to realize profits and take some chips off the table.
Now that the Trump team has moved into the West Wing of the White House, investors still one big Trump policy question mark that overhang the market. Who will Trump appoint to the two vacant governor seats at the Federal Reserve?
CNBC reported that David Nason is a leading contender for a board seat, but he is rumored to be considered for a regulatory role. Such an appointment gives us no hints about the likely future direction of monetary policy and who might replace Janet Yellen, should Trump choose not to re-appoint her as Fed chair in 2018.
Bloomberg reported that the latest rumor mill has the leading candidates for Fed chair, namely Glenn Hubbard, John Taylor, and Kevin Warsh, advocating a tighter monetary policy than the current Fed:
Potential candidates to head the Federal Reserve in 2018 suggested that monetary policy would be tighter if they were in charge.
Speaking at the annual American Economic Association meeting that ended Sunday, Glenn Hubbard of Columbia University, along with Stanford University’s John Taylor and Kevin Warsh, criticized the central bank for trying to do too much to help an economy struggling with problems that monetary policy can’t solve.
“The Federal Reserve is a little behind the curve” in raising interest rates, Taylor, a Treasury undersecretary for international affairs under the last Republican president, said Saturday during a panel discussion in Chicago.
Hubbard, who headed the Council of Economic Advisers under Bush, said he agreed with what he perceives as Trump’s stance that the U.S. has depended too much on the Fed to support the economy in recent years.
Is that what Trump really wants? There is a battle going on for the hearts and minds of the Federal Reserve. The outcome will have profound implications for the direction of monetary policy, the likely trajectory of economic growth for President Trump’s next four years, and the stock market.
War at the Fed
Current members of the FOMC have pushed back against proposals by the hard money crowd to impose a rules based approach to setting interest rates. Neel Kashkari, president of the Minneapolis Fed, shot back that using a Taylor Rule to set interest rates would have kept millions out of work:
In December, I wrote an op-ed in the Wall Street Journal explaining that forcing the Federal Open Market Committee (FOMC) to mechanically follow a rule, such as the Taylor rule, to set interest rates can cause tremendous harm to the economy and the American people. My staff at the Minneapolis Fed estimates that if the FOMC had followed the Taylor rule over the past five years, 2.5 million more Americans would be out of work today. That’s enough to fill the seats at all 31 NFL stadiums simultaneously, almost 6,000 more people out of work in every congressional district.
To sum up, simple policy rules can serve as useful benchmarks to help assess how monetary policy should be adjusted over time. However, their prescriptions must be interpreted carefully, both because estimates of some of their key inputs can vary significantly and because the rules often do not take into account important considerations and information pertaining to the outlook. For these reasons, the rules should not be followed mechanically, since doing so could have adverse consequences for the economy.
Hawkish Fed = USD bullish
Everything else being equal, a hawkish Fed would tend to put greater upward pressure on the US Dollar, which would be contrary to Trump’s trade policy objectives. I pointed out that Trump had already expressed his preference for a weak USD (see Weaken the USD to Make America Great Again). Therefore it makes no sense for him to appoint a hard money economist to be Fed chair and steer monetary policy.
If the Trump administration were to turn away from the likes of John Taylor, who would be a more likely Fed chair? For this exercise, let`s peg the Yellen Fed`s monetary policy as the neutral position. Janet Yellen has said that she expects to continue raising rates in 2017. In a January 18, 2017 speech, Janet Yellen made it clear that her dovish tilt has limits.
In a nutshell, the Fed’s goal is to promote financial conditions conducive to maximum employment and price stability. And I have offered broad-brush definitions of each of those objectives. So where is the economy now, in relationship to them? The short answer is, we think it’s close…
Nevertheless, as the economy approaches our objectives, it makes sense to gradually reduce the level of monetary policy support. Changes in monetary policy take time to work their way into the economy. Waiting too long to begin moving toward the neutral rate could risk a nasty surprise down the road–either too much inflation, financial instability, or both. In that scenario, we could be forced to raise interest rates rapidly, which in turn could push the economy into a new recession.
She expects to raise rates “a few times a year” until the end of 2019, when Fed Funds gets to the neutral rate of 3%:
Now, many of you would love to know exactly when the next rate increase is coming and how high rates will rise. The simple truth is, I can’t tell you because it will depend on how the economy actually evolves over coming months. The economy is vast and vastly complex, and its path can take surprising twists and turns. What I can tell you is what we expect–along with a very large caveat that our interest rate expectations will change as our outlook for the economy changes. That said, as of last month, I and most of my colleagues–the other members of the Fed Board in Washington and the presidents of the 12 regional Federal Reserve Banks–were expecting to increase our federal funds rate target a few times a year until, by the end of 2019, it is close to our estimate of its longer-run neutral rate of 3 percent.
Forgive me if I am parsing this incorrectly, but if “a couple” is two, then doesn’t “a few” mean more than two? It sounds like Yellen is signaling that she expects at least three rate hikes in 2017. Indeed, Bloomberg reported that former Fed governor Laurence Meyers deduced that Yellen is forecasting three rate hikes on the “dot plot” for 2017:
Meyer is playing a game of elimination popular among investors and economists that revolves around the so-called dot plot. That’s a graphic layout that the Fed publishes every three months to show where policy makers think interest rates should go if their forecasts for the economy prove accurate. The quarterly rate projections don’t identify the author of each forecast, which is represented by a dot on a chart…
Atlanta Fed President Dennis Lockhart told reporters on Jan. 9 that he had forecast two hikes this year. His Chicago counterpart Charles Evans suggested he’s also looking at two, saying on Jan. 6 that a couple of moves were “not an unreasonable expectation.” Next, Governor Daniel Tarullo, who in the past has advocated a decidedly cautious approach to raising rates, also got ranked at two hikes by several economists.
With a single two-hiker remaining, there is one more firm clue: In December, in the run-up to the FOMC meeting, the board of directors at the Minneapolis Fed was alone among the regional banks when it voted against increasing the so-called discount rate, which establishes interest rates for direct loans from the Fed. They did so to support the labor market and allow inflation to rise, according to minutes published on Jan. 10.
A reserve bank’s position on the discount rate typically reflects its president’s view with respect to the benchmark federal funds rate, suggesting Minneapolis Fed President Neel Kashkari isn’t hawkish enough to forecast more than two hikes this year on the dot plot.
If that’s correct, Yellen and New York Fed President William Dudley are among the six policy makers forecasting three hikes in 2017.
Wow! Three 2017 rate hikes for a reputed dove like Janet Yellen. Trump won’t like that!
Even doves have limits
What about Lael Brainard? Even though Brainard supported Hillary Clinton in the election and was rumored to be in the running for the post of Treasury Secretary in a Clinton administration, could the ȕber-dove Lael Brainard be a candidate for Fed chair?
In a recent speech made on January 17, 2017, Brainard made it clear that even doves have limits when faced with an expansionary fiscal policy. Fiscal policy that provide only a temporary boost to demand (read: tax cuts) spur inflation, especially when the economy is running near capacity, as it is now:
Focusing first on policies that affect only aggregate demand, temporary demand-based fiscal expansions can speed recovery when the economy is some distance from full employment and target inflation, particularly if conventional monetary policy is constrained by the effective lower bound. But when the economy is either close to or at full employment and inflation is converging to or at its target, additional fiscal demand will more likely result in inflationary pressures. Thus, fiscal expansions that affect only aggregate demand and are enacted when the economy is near full employment and 2 percent inflation are relatively less likely to sustainably boost economic activity and relatively more likely to be accompanied by increases in interest rates.
These kinds of fiscal policies are actually counterproductive, as the government has to incur debt without a corresponding boost to long-term growth. In addition, the Fed is weakened because it has little ammunition to fight the next downturn:
Policies that persistently raise aggregate demand alone can lift the neutral rate, but that may come at substantial cost. Because these policies do not affect the economy’s long-term growth potential but do result in persistent fiscal deficits, they can lead to substantial increases in the debt-to-GDP ratio. The greater space for monetary policy to respond to adverse shocks provided by a higher neutral rate comes at the expense of reducing the space for fiscal policy to stabilize the economy in the event of future adverse shocks.
At the end of her speech, she did sound a dovish tone by giving a nod to her thesis that the Fed has to consider the global implications of its policy:
Against this uncertain backdrop, monetary policy will continue to be guided by actual and expected progress toward our goals, the level of the neutral rate, and the balance of risks. A gradual approach will remain appropriate as long as inflationary pressures remain muted, the economy remains short of our objectives, the neutral rate remains low, and downside risks from abroad remain, although this will depend on the fiscal trajectory, as it evolves, and its uncertain effects on the economy and financial markets.
Will that be enough for Trump looking for a dovish Fed chair? Probably not.
The rise of inflation
Regardless of who Trump appoints to the Federal Reserve’s board of governors, or to next Fed chair, the inescapable fact is inflation is rising. As one of the Federal Reserve’s mandate is to fight inflation, monetary policy will become tighter. This chart from Callum Thomas of Top Down Charts shows that not only are the inflationary pressures building, they are global in nature.
Indeed, BIS recently put out a paper entitled The globalisation of inflation: the growing importance of global value chains. The authors concluded that the globalization of manufacturing has also globalized inflation dynamics, which makes it more difficult for central banks to control inflation locally. The conclusions of this paper is supportive of Lael Brainard’s thesis that the Fed needs to pay greater attention to the global effects of US monetary policy. Here is the abstract of the BIS paper:
Greater international economic interconnectedness over recent decades has been changing inflation dynamics. This paper presents evidence that the expansion of global value chains (GVCs), ie cross-border trade in intermediate goods and services, is an important channel through which global economic slack influences domestic inflation. In particular, we document the extent to which the growth in GVCs explains the established empirical correlation between global economic slack and national inflation rates, both across countries and over time. Accounting for the role of GVCs, we also find that the conventional trade-based measures of openness used in previous studies are poor proxies for this transmission channel. The results support the hypothesis that as GVCs expand, direct and indirect competition among economies increases, making domestic inflation more sensitive to the global output gap. This can affect the trade-offs that central banks face when managing inflation.
Kyle Bass believes that financial markets are at the beginning of a major tectonic shift towards inflation from deflation:
Texan hedge fund manager J. Kyle Bass, the founder of Hayman Capital, says that global markets are at the “beginning of a tectonic shift.”
“Today, global markets are at the beginning of a tectonic shift from deflationary expectations to reflationary expectations. What happens to economies at maximum leverage when interest rates begin to rise? Reconciling the potent strengths of the world’s largest economies with their inherent weaknesses has revealed various investable anomalies. The enormity of the apparent disequilibrium is breathtaking, making today a tremendous time to invest,” Bass wrote in a year-end letter to investors seen by Yahoo Finance.
If Trump wants a dovish Fed, and if he decides to pack the board with like minded appointees who are willing to tilt towards an easier monetary policy (and therefore a weaker USD), a major war will likely erupt within the FOMC on policy, especially when well-known doves like Brainard and Yellen have become more hawkish.
Three steps and a stumble?
Under the scenario I outlined, the three steps and a stumble rule, where the market tops or corrects after three consecutive rate hikes, will inevitably come into play. But it’s probably too early too panic. Jim Paulsen of Wells Capital Management observed that equity markets typically don’t pull back in the face of rising yields until market psychology changes from disinflation to inflation:
Charts 5 and 6 illustrate how important the relationship portrayed by this correlation has been for stocks in recent years and when the recent rise in bond yields might finally cause a correction in the stock market. Specifically, it suggest the stock market may continue to rise despite higher yields until the correlation switches from positive to negative. That is, higher interest rates may not restrain the stock market until the primary investor anxiety shifts from deflation to inflation.
As shown, since the late-1990s, the stock market has suffered either a correction or a bear market each time the stock-bond correlation has declined below zero (i.e., each time investor mindsets have switched from deflation to inflation concerns). The 2000 collapse occurred after the correlation turned negative in late-1999, the 2007-2008 collapse happened after the correlation dropped below zero in the second half of 2006 and the correlation again fell below zero at the end of 2013 followed by two separate 10% corrections and an essentially flat stock market during the ensuing couple years.
The risk stock investors face in 2017 from rising bond yields may have less to do with how much they rise or how high they are, as it does with the surrounding attitude of investors concerning inflation/deflation as yields rise. Currently, the consensus investor mindset is viewing the recent rise in yields as a positive for the economy and the stock market (as suggested by a strong positive correlation in the last year from Chart 5). Fears of deflation and anxieties surrounding another potential crisis are diminishing as commodity prices recover, as U.S. and global economic growth improve, as the Federal Reserve finally begins to normalize monetary policy and as the interest rate structure around the globe moves back above zero.
It sounds like that “three steps and a stumble” is a late 2017 investment story. Tactically, I would hesitate about getting overly defensive just yet. The bond market is currently poised for a counter-trend rally as large speculator, or hedge funds, remain in a crowded short in both the 10-year note and the long bond (chart via Hedgopia).
Bloomberg also pointed out that while the fast money, or hedge funds, are in a crowded long in the bond market, the patient and big money institutions are extremely long. In the end, big money fund flows have tended to overwhelm the fast money.
Leveraged funds that use borrowed money to boost returns see even more losses ahead. As of Jan. 10, their short positions — futures that pay off if five-year notes lose value — exceeded longs by a record 1.1 million contracts, data compiled by the U.S. Commodity Futures Trading Commission show.
While it’s been the winning strategy over the past several months, institutional buyers are undaunted. Not only did they boost their long positions for five-year notes to an all-time high this month, but they’ve also stepped up bullish bets on 10- and 30-year Treasuries as well. (Most recent data as of Jan. 17 showed a slight pullback in both institutional net longs and leveraged net shorts.)
When real-money investors do go all-in, they tend to overwhelm the fast-money crowd because of their sheer size.
In the end, “real money always wins,” said Tom di Galoma, the managing director of government trading and strategy at Seaport Global Holdings. “Speculators tend to get taken out. We’ve seen this occur several times in the last 10 to 15 years, where everybody thinks rates are too low.”
By all means and enjoy the party, but don’t go overboard and be selective with your risk appetite.
Preface: Explaining our market timing models
We maintain several market timing models, each with differing time horizons. The “Ultimate Market Timing Model” is a long-term market timing model based on the research outlined in our post, Building the ultimate market timing model. This model tends to generate only a handful of signals each decade.
The Trend Model is an asset allocation model which applies trend following principles based on the inputs of global stock and commodity price. This model has a shorter time horizon and tends to turn over about 4-6 times a year. In essence, it seeks to answer the question, “Is the trend in the global economy expansion (bullish) or contraction (bearish)?”
My inner trader uses the trading component of the Trend Model to look for changes in direction of the main Trend Model signal. A bullish Trend Model signal that gets less bullish is a trading “sell” signal. Conversely, a bearish Trend Model signal that gets less bearish is a trading “buy” signal. The history of actual out-of-sample (not backtested) signals of the trading model are shown by the arrows in the chart below. Past trading of the trading model has shown turnover rates of about 200% per month.
The latest signals of each model are as follows:
Ultimate market timing model: Buy equities
Trend Model signal: Risk-on
Trading model: Bearish
Update schedule: I generally update model readings on my site on weekends and tweet mid-week observations at @humblestudent. Subscribers will also receive email notices of any changes in my trading portfolio.
Trump’s challenge
Now that Donald Trump is the President of the United States, the real work of his administration begins. In inauguration speech, he invoked the spirit of Horatio Alger as a way to take America to new heights:
Finally, we must think big and dream even bigger. In America, we understand that a nation is only living as long as it is striving…
Do not allow anyone to tell you that it cannot be done. No challenge can match the heart and fight and spirit of America. We will not fail. Our country will thrive and prosper again.
Ray Dalio of Bridgewater Associates was optimistic about this “can-do” attitude of Americans:
This new administration hates weak, unproductive, socialist people and policies, and it admires strong, can-do, profit makers. It wants to, and probably will, shift the environment from one that makes profit makers villains with limited power to one that makes them heroes with significant power.
Despite inheriting an economy that is in the late stages of an expansion, Dalio believes that the incoming president can spark a second wind of growth by reviving the economy’s “animal spirits”:
This particular shift by the Trump administration could have a much bigger impact on the US economy than one would calculate on the basis of changes in tax and spending policies alone because it could ignite animal spirits and attract productive capital. Regarding igniting animal spirits, if this administration can spark a virtuous cycle in which people can make money, the move out of cash (that pays them virtually nothing) to risk-on investments could be huge.
Bob Shiller went further and postulated a speculative stock market blow-off, followed by a crash (via The Telegraph):
America should brace for a final blow-off surge in stock markets akin to the last phase of the dotcom boom or the “Gatsby” years of the Roaring Twenties, followed by a cathartic crash and day of moral judgment, according to a Nobel prize-winning economist.
Prof Robert Shiller said the psychological “narrative” behind Donald Trump is powerful and likely to carry Wall Street to giddy heights before the aging business cycle finally rolls over.
“I think there will be a Trump boom for a while. Stocks look high, but they are not yet super-high. In 2000 the (Cape Shiller) price-earnings ratio was over 45 and we may see a repeat of that,” he told The Daily Telegraph.
For investors, the stakes are high. Under this scenario, a Trump inspired “animal spirits” revival could spur the SPX to its point and figure target of 2523 or more.
The question is, can Trump spark the “animal spirits” to Make America Great Again?
A mature expansion
Despite Trump’s rhetoric about a revival of an America that’s on its knees, he inherits an economy that is growing and in the late stages of an expansion. This chart of initial jobless claims, normalized by population, shows that initial claims are at or near all-time lows.
Unemployment has been falling in the wake of the crisis of 2008, and it is at levels consistent with rising wages and rising inflationary pressures. These are further signs of a late cycle expansion, which is usually followed by the start of a Fed tightening cycle that ends in recession.
In addition, retail sales are robust, but decelerating, which is another indication of a late cycle expansion.
A second wind?
The counterfactual to these rosy economic statistics is the discontent that elected Donald Trump. True, the job picture has improved considerably since 2008, but the quality of jobs haven’t returned. For much of Main Street America, the “animal spirits” in the form of business dynamism has been missing. Economic Innovation Group found that most of the counties that swung from Obama to Trump in the election experienced a decline in business dynamism:
It appears that business closures helped the president-elect poach counties that had voted for President Obama twice before. Of these 209 counties, roughly 75% saw more businesses close than open from 2010 to 2014. It’s important to note that these counties ran the gamut from affluent to distressed; highly educated to below average; overwhelmingly white to majority-minority. In spite of their many differences, a decline in business dynamism is where the vast majority found common ground.
In the wake of Trump’s electoral win, Small business confidence has soared, though we have yet to see the revival in actual sales (see last week’s post Main Street bulls vs. Washington bears).
View through Main Street’s prism, Trump`s triumph has woken the economy’s dormant “animal spirits” out of hibernation.
Economic “animal spirits”
There are other ways of defining “animal spirits”. If we were to think about the idea of “animal spirits” like an economist, we might think of it in the monetary framework of:
MV = PQ
Where M = money supply, V = velocity, P = price, and Q = quantity
In other words, GDP (= Price x Quantity of goods and services) is a function of money supply growth and monetary velocity. While monetary theory held that V is constant over time, that hasn’t been true in practice. As the chart below shows, M1 money supply growth has been positive, which indicates that Fed policy remains acccommodative. However, monetary velocity has been falling dramatically, which has offset the Fed’s stimulus efforts through lower interest rates and several rounds of quantitative easing.
If the economy’s “animal spirits” were to revive, then one sign would be a rise in monetary policy. That hasn’t happened yet, though monetary velocity is a quarterly data series that is slow to update and therefore that data set is reported with a lag.
Investment’ “animal spirits”
If we were to think about “animal spirits” from an investor’s viewpoint, it would be in the form of investor sentiment. As the chart of AAII sentiment shows, weekly readings are volatile and noisy. The 52-week moving average of the bull-bear spread (blue line) shows that long-term investor sentiment remains at depressed levels.
Indeed, this chart of the relative performance of high beta stocks against low-volatility stocks, which were the investment darlings of last year, shows that risk appetite is starting to revive. However, sentiment is nowhere near levels that could be described as frothy or a crowded long.
Recently, Mark Hulbert warned about valuation headwinds for stock prices and argued that stock prices were overvalued on a variety of metrics.
While I don’t necessarily agree with Hulbert’s assessment (see Top-down meets bottom-up: How expensive are stocks?), the one element that has been missing in this market cycle is the presence of excessive bullishness as one of the prerequisites of a market top. If investor “animal spirits” were to revive and we see a blow-off top, then that requirement would be complete.
Animal spirits: The bull case
So where does that leave us? The bull case is based on preliminary evidence of the revival of “animal spirits”. Ed Yardeni is optimistic:
A week after his election victory, I concluded that incoming President Donald Trump could succeed in stimulating economic growth, so I raised my real GDP forecast for 2017 from 2.5% to 3.0%. Since then, I’ve been keeping track of all the signs showing a revival of “animal spirits” in surveys of consumer and business confidence.
His YRI Weekly Leading Index, as well as the ECRI Weekly Index, have been surging.
Jim Paulsen of Wells Capital Management is showing a similar level of cautious optimism. The chart below depicts a composite of investor, small business, and consumer confidence, all of which have surged to new cycle highs.
Paulsen went on to ask if investors are positioned for the next possible upleg:
Indeed, both investor and business confidence have probably spurted to unsustainable levels recently. Although both may decline somewhat again, given the impressive confluence of factors (shown above) which have recently formed to provide a foundation for this renewed optimism, it seems possible that overall private player confidence might remain much stronger during the balance of this recovery.
Investors may want to ruminate a bit on whether they are prepared and positioned for a potential second “confidence driven leg” to this economic and financial market recovery?
Animal spirits: The bear case
The bear case is based on the assertion that much of the factors behind the “animal spirits” consist of mostly smoke and mirrors.
Consider, for example, Ed Yardeni’s observation of a rise in growth expectations. As the chart below of forward 12-month EPS from Factset shows, investors need to distinguish between the cyclical effect of a growth revival, and the “animal spirits” effect. Forward EPS had already been rising well before the election, so what we are observing might be a cyclical effect, rather than a second wind of growth based on improving business dynamism.
As for Trump’s claims of bringing jobs back to America, Josh Brown observed that corporate executives have learned to play the game:
Either before or after the tweet is sent about your company, you make a trip to Trump Tower on Fifth Avenue or to Mar-a-Lago (which will be the new combination White House / Camp David, by the way) and you parade ostentatiously before the bank of TV cameras. “Look at me! I’m down with the President’s agenda!”
Then a half hour later, you come down the golden elevator with the man himself, who holds an impromptu Q&A with you, as part of his end of the deal. Announcements of new jobs are made. New factories. New initiatives that will be undertaken, ASAP. Then he goes back up in his golden elevator for the next meeting and you get another 10 minutes of face time with the news crews. You grin optimistically, knowing that you and your company are off the Twitter shit list for awhile.
Mission accomplished.
It’s an old playbook, imported from the east. More on that in a moment.
One of the obvious things going on here, at least to the business world, is that much of this is just another reality show. There’s truth to these corporate pronouncements, but there’s plenty of artifice as well. It’s a pageant of sorts, designed for the consumption of the masses. To which I’d say, so what? If it gets the job done, let the man put on his show. Just don’t get overly excited about any sort of national transformation.
Business goes on as before. It really is all smoke and mirrors.
Resolving the bull and bear cases
So what’s the answer? Can Donald Trump spark the “animal spirits” in the economy? The jury is still out. Here are some observations from Avondale’s company notes:
The optimism is palpable
“The optimism for positive change here at Bank of America and among our customers is palpable and has driven bank stock prices higher. We will have to see how these topics play out, but we are optimistic.” —Bank of America CEO Brian Moynihan (Bank)
There’s a lot of optimism but not a lot of action
“there’s more optimism and positive commentary for a lot of our business customers. But we haven’t seen a significant change in utilization or actually take down of credit yet. So while the talk is there, the actual action is not yet shown itself.” —US Bank COO Andy Cecere (Bank)
“What I’m cautious about is nothing has actually happened yet, other than there has been a move in rates, right, and it changes sentiment. And I think we need to start seeing some of confirmations get through. We need to see real progress on tax reform. We need to see real progress on infrastructure, spending bills of state and local, and then all of a sudden, this thing takes flight, but right now, it’s just people talking about it.” —PNC CFO Rob Reilly (Bank)
For the last word, I conclude with a CNBC interview with Ray Dalio. Notwithstanding his tremendous optimism about the “can-do” attitude of Americans, Dalio believes that the market had largely discounted the obvious changes, such as the Trump tax cuts. Now there are more questions than answers with regards to policy implementation, such as how Trump’s fiscal plan gets turned into legislation, as well as geopolitical questions like as Sino-American relations.
In the coming weeks, we will undoubtedly see some of the bumps in the road that will create uncertainty, raise the risk premium, and spook the markets. The latest BAML Fund Managers Survey shows that fund managers are deathly afraid of a protectionist backlash, or US policy error (annotations in red are mine).
Indeed, assertive language like this on trade on the White House website will undoubtedly unnerve investors:
President Trump is committed to renegotiating NAFTA. If our partners refuse a renegotiation that gives American workers a fair deal, then the President will give notice of the United States’ intent to withdraw from NAFTA.
In addition to rejecting and reworking failed trade deals, the United States will crack down on those nations that violate trade agreements and harm American workers in the process. The President will direct the Commerce Secretary to identify all trade violations and to use every tool at the federal government’s disposal to end these abuses.
We will see next week how much of these fears have been discounted by the market.
The week ahead
Looking to the week ahead, the stock market will face its first test under a Trump administration. At a minimum, can it at least conform to the inauguration pattern as outlined by Alpha Hat (via Business Insider)? Historically, the market typically rallies for about two weeks after inauguration, followed by a February correction. Longer term, however, Republicans president markets have tended to underperform.
The market action on Friday did not give any strong clues. The hourly chart of the SPY shows that the market broke down through and uptrend on Thursday, but rallied to (barely) regain the trend line. At this point, it’s unclear whether the breakdown below the trend line was a false break.
My inner investor remains long the market. His base case scenario calls for a shallow correction in Q1, followed by a rally later in the year. Market internals appear to be setting up for a period of sideways consolidation or pullback (see The contrarian message from rotation analysis).
My inner trader still has a small short position in the market, but he will close that short should the market break out to new highs.
About a month ago (see The bear case: How Trumponomics keeps me awake at night), I highlighted a Bloomberg interview with BAML currency strategist David Woo. Woo pointed that there is an inherent contradiction in a couple of Trump’s policies. His fiscal policy of tax cuts is pro-growth and therefore USD bullish, but his “America first” trade policy needs a weaker dollar. So what does he really want, a strong dollar, or a weak dollar?
We may have an answer. In a recent WSJ interview, Trump said that the dollar is “too strong”, especially considering the China’s yuan is “dropping like a rock.” While those remarks were made in the context of Sino-American trade relations, Trump signaled that, if he had to choose, he would prioritize a weaker currency over fiscal stimulus.
Trump`s priorities of trade policy over fiscal policy is consistent with his criticism of the House Republican border tax adjustment plan as “too complicated“ (via WSJ). Already, the spectacle of passing a fiscal budget, even with Republican control of the White House, the Senate, and the House, is turning into a public “sausage making“ exercise.
A strategy of USD weakness makes more sense for Trump if he wants to achieve his trade policy objectives. As Larry Summers pointed out, Trump’s populist message of attacking trading partners like Mexico has the unintended effect of depressing the Mexican Peso. A lower MXNUSD exchange rate paradoxically incentivizes companies to move production south of the Rio Grande (via AP and Business Insider):
Summers told a panel at the World Economic Forum on Wednesday that the president-elect’s “rhetoric and announced policies” over Mexico have led to a big fall in the value of the Mexican peso against the dollar.
That, he said, is a “dagger at Ohio,” as it will make it even more attractive for firms to move to Mexico.
How to weaken the USD
Bloomberg featured an article that outlined several options that the US government could employ to weaken its currency, along with the pros and cons of each approach.
A couple of previous notable Republican Presidents have been responsible for currency intervention, as seen in this handy chart.
Should the Trump administration want to go down this path, I believe that the Plaza Accord may be the best template for crafting an agreement to weaken the USD. Trump`s threats of protectionist measures may be enough for other major trade blocs to agree to weaken the USD in the manner of the Plaza Accord of 1985.
USD bear = Gold bull
That brings me to another point. Should the Trump administration succeed in crafting another Plaza Accord, a weak greenback would be gold bullish. The chart below depicts the price of gold (blue line) and the trade weighted USD (red line, inverted scale), along with the major interventions shown in the previous chart. Should an agreement be reached to weaken the dollar, then historically that has marked the beginning of a major gold bull.
At this point, such a scenario is highly speculative. However, investors should be prepared for such an eventuality and its investment consequences, should it ever occur.
Mid-week market update: Occasionally, it is useful to step back and view the market through a different prism. I was reviewing the RRG charts of sector, region, and factor, and I found that they are all telling a similar story.
First, let’s start with a primer. Relative Rotation Graphs, or RRG charts, are a way of depicting the changes in leadership in different groups, such as sectors, countries or regions, or market factors. The charts are organized into four quadrants. The typical group rotation pattern occurs in a clockwise fashion. Leading groups (top right) deteriorate to weakening groups (bottom right), which then rotates to lagging groups (bottom left), which changes to improving groups (top left), and finally completes the cycle by improving to leading groups (top right) again.
The latest sector rotation chart shows that financial stocks and cyclical stocks (energy, industrials, materials) are the leading groups, but they are weakening. By contrast, defensive sectors are starting to improve from the lagging quadrant to improving. In particular, the upgrade of interest sensitive utilities from lagging to improving quadrant is consistent with the nascent counter-trend rally seen in the bond market.
In short, high beta is faltering and defensive sectors are starting to turn up.
Confirmation from Europe
The trend of waning risk appetite appears to be global in nature. We can see a similar pattern in the RRG chart of European sectors. The main difference between the US and European RRG charts is the behavior of the materials sector. The European basic materials sector has already deteriorated into the weakening quadrant, whereas US materials remain in the top right leading category.
Style rotation: Too far too fast?
The message from style rotation of US equities also tells a similar story. High beta groups are ascendant, but starting to weaken. The value style, which had been on a tear, is also starting to roll over in relative strength. By contrast, out of favor styles such as dividend payers, as well as growth and momentum (think FANG), are starting to turn up.
Global regions: Buy Europe and Asia
A glance at regional and country rotation tells a story of cyclical factors starting to roll over. The leadership countries are Russia and Canada (oil), and the US. Europe appears to be a source of emerging strength, while Asian markets are lagging, but starting to improve. Tactically, traders may wish to consider selling their cyclical exposure and start to add exposure to Europe and Asia.
From a top-down macro perspective, even though Citigroup’s Economic Surprise Index have been surging, the market believes that the pace of improvement is probably unsustainable (h/t Topdown Charts).
Be contrarian
From an absolute return viewpoint, the de-risking pattern from the RRG charts suggests that US equities are likely to undergo a period of sideways action, or mild pullback for the remainder of Q1.
In addition, the message from group rotation analysis is a cyclical rally that is starting to stall. Better performance may be found in some of the laggards, such as emerging leadership groups like interest sensitives (utilities, bond market), or European equities (in the face of anxieties over Brexit and upcoming elections in France and Germany). As well, traders may also want to consider beaten up and out of favor groups, such as growth and momentum stocks, as well as Asian equities.
In other words, be contrarian. This view is confirmed by the latest results in the BAML Fund Manager Survey (annotations in red are mine).
Preface: Explaining our market timing models
We maintain several market timing models, each with differing time horizons. The “Ultimate Market Timing Model” is a long-term market timing model based on the research outlined in our post, Building the ultimate market timing model. This model tends to generate only a handful of signals each decade.
The Trend Model is an asset allocation model which applies trend following principles based on the inputs of global stock and commodity price. This model has a shorter time horizon and tends to turn over about 4-6 times a year. In essence, it seeks to answer the question, “Is the trend in the global economy expansion (bullish) or contraction (bearish)?”
My inner trader uses the trading component of the Trend Model to look for changes in direction of the main Trend Model signal. A bullish Trend Model signal that gets less bullish is a trading “sell” signal. Conversely, a bearish Trend Model signal that gets less bearish is a trading “buy” signal. The history of actual out-of-sample (not backtested) signals of the trading model are shown by the arrows in the chart below. Past trading of the trading model has shown turnover rates of about 200% per month.
The latest signals of each model are as follows:
Ultimate market timing model: Buy equities
Trend Model signal: Risk-on
Trading model: Bearish
Update schedule: I generally update model readings on my site on weekends and tweet mid-week observations at @humblestudent. Subscribers will also receive email notices of any changes in my trading portfolio.
Bifurcated opinions
Opinions are starting to split badly on the market and the economy. Main Street has become more upbeat on the economic outlook. The NFIB small business survey showed that optimism surged in December, though Renaissance Macro pointed out that optimism has not translated yet into a significant upswing in sales growth.
The preliminary January report of UMich consumer confidence shows that it is elevated, though opinions are reportedly split along political lines:
The post-election surge in optimism was accompanied by an unprecedented degree of both positive and negative concerns about the incoming administration spontaneously mentioned when asked about economic news. The importance of government policies and partisanship has sharply risen over the past half century. From 1960 to 2000, the combined average of positive and negative references to government policies was just 6%; during the past six years, this proportion averaged 20%, and rose to new peaks in early January, with positive and negative references totaling 44%.
By contrast, I am seeing signs of doubt from political circles that Trump will be successful with his pro-growth agenda, even among Republicans. Traditional approaches to sentiment analysis states that the public tends to be slow. When the public finally latches onto an economic theme, it is indicative of a contrarian top (or bottom). On the other hand, the improvement in business and consumer confidence can be signals of broad based economic strength.
So who is right? Main Street, or Washington?
The stakes are high
Here is what’s at stake for equity investors. As we enter earnings season, Factset shows that forward EPS continues to rise, which is indicative of Street expectations of broad based cyclical strength.
However, broad based cyclical upturn can only get you so far. This Factset chart also shows that forward P/E ratio is elevated and expensive compared to its own history. Current forward P/E is based on bottom-up derived earnings based only analyst expectations of economic conditions without the Trump fiscal plan. That’s because you can’t make estimates when you don’t have the details of the proposals. A top-down analysis suggests that the Trump tax cuts could add roughly 10% to forward earnings, which would bring down the forward P/E ratio to more reasonable levels (annotations are mine).
To rephrase my previous question: Who is right about the expectations for the Trump tax cuts? Main Street or Washington?
Republican skepticism
When Donald Trump takes his oath of office, he will be entering the White House with an unusually high unfavorability rating for an incoming president. It is therefore no surprise that consumer confidence is bifurcated and there is skepticism from Democrats that he will be able to implement all of the policies that he promised on the campaign trail.
I was surprised that skepticism is also coming from die hard Republicans. Bloomberg report that Republican governor of Kansas, Sam Brownback, had words of caution for the incoming president:
The governor of Kansas has some wisdom for Donald Trump, from one Republican tax-cutter to another: The reductions may take longer than expected to give the economy a sustained lift.
Like President-elect Trump, who said on the campaign trail that slashing taxes would jump-start growth, Sam Brownback in 2012 said steep cuts to personal income and small-business taxes in the Midwest state would provide the economy a“shot of adrenaline.” What followed wasn’t the promised jolt. The shortfall in revenue has instead forced the government to curtail spending on everything from health care to higher education.
John Mauldin, market analyst and staunch Republican from Texas, described himself as “skeptically optimistic” about the new regime. Passing legislation is never easy. Seemingly straightforward proposals can get delayed, watered down, or simply fall apart:
I’m told the Republicans have a long list of relatively uncontroversial (at least on their side of the aisle) bills that they can pass very quickly. They want to show progress, and they think quick passage of some popular measures will buy them credibility to use later. I expect an initial burst of activity after January 20, probably followed by a lull as the Congress moves into more contentious issues like Social Security and healthcare reform. Things will keep happening, but we may not see as many votes.
The hard part is getting agreement on the big items like taxes and healthcare reform. I love seeing Trump and Pence and Ryan and McConnell and all the guys holding hands and acting as if they’re all ready to walk into the bright new future together, but the reality is that there are some quite different ideas in Washington about what serious reforms should look like, and a lot of congressmen want to put their personal stamp on the final bills.
The reform effort could fall apart for various reasons. The Senate majority is narrow enough that just a handful of GOP defectors will be able to stop any given bill, assuming Democrats stay united in opposition. I think Republicans should be on guard against hubris, as well. The decision last week to kick off the year by softening ethics rules was a terrible idea. They accomplished nothing and energized an opposition that was otherwise on its heels.
As an example, this pattern of debt to GDP could give GOP deficit hawks some pause as they consider Trump’s fiscal plan, which is expected to balloon the deficit.
Maudlin added that the new administration could get distracted by an unexpected crisis that weakens its ability to pass legislation.
Finally, as I cautioned last week, there is always the chance that some “bolt from the blue” could change everything. An international crisis, a large bank failure, terror attacks – any one of a long list of unforeseeable events could conceivably derail this train. Not to mention the endemic problems of Europe and China, which we will deal with below and which are entirely foreseeable. But if we can get through the first 100 days with this administration, then I think its agenda will have enough momentum to keep rolling.
The latest story that Russian intelligence had compromised Trump is just one of many tests that will face the new administration. The Lawfare blog had a the most balanced perspective that I had seen on this episode.
First, we have no idea if any of these allegations are true. Yes, they are explosive; they are also entirely unsubstantiated, at least to our knowledge, at this stage. For this reason, even now, we are not going to discuss the specific allegations within the document.
Second, while unproven, the allegations are being taken quite seriously. The President and President-elect do not get briefed on material that the intelligence community does not believe to be at least of some credibility. The individual who generated them is apparently a person whose work intelligence professionals take seriously. And at a personal level, we can attest that we have had a lot of conversations with a lot of different people about the material in this document. While nobody has confirmed any of the allegations, both inside government and in the press, it is clear to us that they are the subject of serious attention.
Third, precisely because it is being taken seriously, it is—despite being unproven and, in public anyway, undiscussed—pervasively affecting the broader discussion of Russian hacking of the election. CNN reported that Senator John McCain personally delivered a copy of the document to FBI Director James Comey on December 9th. Consider McCain’s comments about the gravity of the Russian hacking episode at last week’s Armed Services Committee hearing in light of that fact. Likewise, consider Senator Ron Wyden’s questioning of Comey at today’s Senate Intelligence Committee hearing, in which Wyden pushed the FBI Director to release a declassified assessment before January 20th regarding contact between the Trump campaign and the Russian government. (Comey refused to comment on an ongoing investigation.)
Politico reported that, on late Friday after the market close, the Senate Intelligence Committee has opened an investigation into this affair, Even before the Inauguration, this inquiry already has the potential to either distract the Trump team or weaken its apparent authority to pass legislation.
A Trumpian “animal spirits” revival?
Independent of what happens inside the Beltway, the latest NFIB survey represents a boost to economic confidence. Even though small business owners tend be conservative and therefore not reflective of views the general population, Ed Yardeni made some good points on why small business confidence matters:
(1) Small business is big employer. ADP, the payroll processing company, compiles data series on employment in the private sector of the U.S. labor market by company size. At the end of 2016, the shares of employment attributable to small, medium-sized, and large firms were 40.5%, 37.7%, and 21.8%.
(2) Small business drives jobless rate. There has been a very high correlation between “poor sales” reported by small business owners and the national unemployment rate. If Trump succeeds in boosting their sales by cutting personal income tax rates, the jobless rate should remain low.
There is also a high correlation between the earnings of small businesses and the inverse of the poor sales. Trump’s proposed tax cuts would boost their earnings, which are inversely correlated with the national unemployment rate.
Yardeni believes that rising small business confidence is a sign that the economy’s “animal spirits” are stirring, which will serve to drive further growth. Another manifestation of these “animal spirits” can also be found in the recovery in consumer confidence, despite the political bifurcation of opinions.
Investment implications
How should investors resolve this apparent contradiction? Should they be cautious, or bullish?
I interpret these conflicting signals in terms of differing time frames. It turns out that consumer confidence are coincidental indicators (via Bill McBride of Calculated Risk):
Consumer sentiment is a concurrent indicator (not a leading indicator). The survey shows some people are now much more positive than prior to the U.S. election – and others are much more negative.
Luke Kawa also observed that small business confidence is highly correlated with GDP growth, which makes it another coincidental indicator.
If you try to forecast a leading indicator, like stock prices, with coincidental indicators, it doesn’t work very well. In fact, Ned Davis Research found that extreme readings in consumer confidence can be used as contrarian indicators – and it’s flashing a sell signal right now (annotations are mine).
In the short term, the Trump rally looks overdone. Mark Hulbert reported that his sample of NASDAQ market timers is at a crowded long level, which is contrarian bearish.
The inverse of contrarian sentiment is insider activity. The latest update from Barron’s of insider trading is flashing a sell signal as this group of “smart investors” have stepped up their selling for a second consecutive week.
From a cross-asset viewpoint, the disappointing tone of Trump’s tone in his Wednesday press conference served to deflate the US Dollar and therefore also has bearish implications for equities. Instead of talking up tax cuts and deregulation, the president-elect chose to focus on protectionism (via CNBC):
The U.S. dollar index hit a one-month low Thursday after President-elect Donald Trump disappointed investors in a Wednesday press conference. Rather than discussing infrastructure spending, deregulation or tax cuts, Trump emphasized a tough position on trade and a border tax.
“The market had priced in a very positive scenario of Trump: fiscal policy without trade protectionism,” said Athanasios Vamvakidis, a European currency strategist in Europe for Bank of America Merrill Lynch.
“That’s why the press conference is a scare,” he said, noting that traders are now focused on the dollar and what the new administration does after next Friday’s inauguration.
This chart from Hedgopia shows that the USD Index is pulling back, but large speculators are still in crowded long position. That’s a recipe for further weakness.
Short term cautious, medium term bullish
My own views are well summarized by BCA Research‘s expectations for equity markets. In the short term, bullish sentiment is overdone and a period of consolidation or pullback can be expected. Longer term, growth expectations are still high and stock prices should rise after a corrective episode.
From a technical perspective, the MACD buy signal for the Wilshire 5000 based on monthly price data remains in force.
We can see a similar pattern from the relative performance of stocks (SPY) vs. Treasuries (TLT). The longer term trend remains bullish, but stocks have started to pull back against bonds. Further short-term weakness would be no surprise. As long as the long term trend remains intact, my inner investor is inclined to remain equity bullish.
Indeed, the sell-off in bonds appear to be overdone. Michael Hartnett at BAML demonstrated that the drawdown in UST prices are at levels where past major bottoms have occurred.
This chart from Hedgopia shows that even as 10-year yields have started to retreat, large speculator short positions continue to rise.
These conditions all suggest bond prices are poised for a powerful counter-trend rally for the next couple of months. From a cross-asset perspective, it also points to softer stock prices ahead.
There is an important caveat to this forecast. This scenario of near-term equity weakness and longer term strength falls apart if unexpected events, such as a trade war or even a shooting war, were to occur.
The week ahead
Looking to the week ahead, I expect volatility to rise as the market becomes subject to the event risk from Q4 earnings season. As well, Inauguration Day is Friday and who knows what kinds of fireworks and new initiatives will be announced.
Next week is also option expiry week. Jeff Hirsch at Almanac Trader observed that returns during January OpEx week tends to be a mixed bag and does not show the usual bullish seasonal bias of OpEx weeks.
The SPX has spent several weeks in a narrow range and it is testing a key uptrend line. For the reasons I outlined, I expect that the upside potential to be limited. Should the uptrend get violated, support exists at the 2180-2200 zone, which is roughly the level where the index staged its upside breakout to all-time highs.
Market internals also point to a bearish resolution of the sideways consolidation. Analysis from Trade Followers shows a negative divergence as bullish Twitter breadth has been deteriorating even as the market has rallied.
My inner investor remains constructive on stocks. My inner trade has taken a small short position in the SPX.
Mid-week market comment: Arthur Hill at stockcharts recently observed that the Russell 2000 was in a tight consolidation range, which is characterized by a narrowing Bollinger Band. Such conditions tend to resolve themselves with volatility expansions which represent breakouts from the trading range.
His remarks about the Russell 2000 could also be applicable to the current conditions of the SPX as well. The key question is which direction will the breakout occur?
Clues from inter-market analysis
We can get some clues from market internals and the performance of other asset classes. Kevin Muir, writing at The Macro Tourist, pointed out that the “Trump trade” of long Russell 2000 and US Dollar, short gold and bonds has started to roll over after a huge rally since the election. These conditions suggest an environment of falling risk appetite.
Indeed, the chart below of long Treasury prices shows that the 20+ year Treasury ETF (TLT) has started to turn up after experiencing a positive RSI divergence.
The chart of the USD Index is also telling a similar story. In this case, the USD Index is starting to roll over.
Independent of Muir’s analysis, Barry Ritholz constructed a POTUS Index, which consists of a basket of shares of companies that Trump has praised (grey line) and a basket of shares of companies that Trump has disparaged (blue line). As the chart below shows, this pair trade has been flat to down for the past month, which is indicative that the euphoria over the Trump election is fading (annotations are mine).
Despite these headwinds, stock prices have been surprising resilient. How will the Trump transition team deal with the challenges in the weeks ahead?
A test for the market and the Trump team
Early in the week, CNBC reported that the Trump team’s strategy ahead of the confirmation hearings scheduled this week was to “flood the headlines so that no bad news gets through”. The “bad news” was presumably any negative confirmation hearings headlines for the numerous nominees, such as Jeff Sessions, for Attorney General, John Kelly, for Homeland Security, Rex Tillerson, for Secretary of State, Betsy DeVos, for Education, and so on.
But the Trump team has a different strategy this week: They’re going to make a lot of news. So much, in fact, that the bet is no one piece of bad news will break through the media clutter. It’s all about safety in numbers.
That’s why you’ll see a wave of confirmation hearings all scheduled for the same day on Wednesday — even as Donald Trump himself provides cover with a long-awaited news conference in midtown Manhattan on the same day. The newser is bound to generate a wave of tweets, blog posts, cable TV hits and newspaper headlines that Republicans hope will wash over any poor performances by Trump’s nominees on Capitol Hill. The idea is to flood the zone.
Unfortunately, the Trump transition team did not count on the news about how Russian intelligence’s possession compromising material on Donald Trump caused the Trump advisers worked with Russian agents (see WSJ article and report from the Guardian). I’ll spare you the salacious details of the story, which have were seen by by various news organizations but not published because the details could not be confirmed.
The lurid details of how Trump may have been compromised should be of only minor concern to the markets. What really matters to investors is whether this story has the potential to distract and hamper the incoming administration’s ability to pass its package of fiscal programs.
In other words, will the tax cuts get delayed because the Trump team has to face Congressional investigations about Russian influence? That’s the first test for the Trump team, and for market psychology in the days and weeks ahead.
I had been meaning to write about the December Jobs Report, which was released last Friday, but I hadn’t gotten around to it. The report had elements of both good news and bad news.
The good news is the December report showed a solid market. True, the headline Non-Farm Payroll figure missed market expectations, but November was revised upwards, and the positive revision in November was bigger than the December miss.
In conjunction with the December Jobs Report, the Council of Economic Advisers released a report indicating that the American economy had added more jobs than other advanced economies in the last eight years (via Business Insider).
Notwithstanding the political victory lap nature of the CEA`s report, the December Jobs Report should keep the Fed on track with its expectations of three rate hikes in 2017.
Here is the bad news. There are worrisome signs that the economy is starting to overheat. The combination of Fed actions on interest rates and wage pressures on operating margins are likely to be unfriendly to the stock market. Unless the Trump administration comes through on their promised tax cuts in the near future, upside for equity prices will be limited in 2017.
The return of inflation
It was a solid jobs report. One of the more concerning features of the report was the return of wage pressures. YoY growth in average hourly earnings (AHE) rose to a new high for this economic cycle at 2.9%, which is well above the Fed’s 2% inflation target.
The surge in wage pressures is no surprise to the markets. The bond market’s inflationary expectations have been steadily rising for the last couple of months.
The reflationary trend has not just been isolated to American shores. Frederik Ducrozet constructed a global PMI price pressure index – and it has been surging.
These conditions give the Fed cover to stay on their path of interest rate normalization. Fed watcher Tim Duy analyzed the report and he believes that the risks to the growth outlook are weighted to the upside:
A solid report largely consistent with expectations among monetary policymakers. Hence it should have little impact on interest rate forecasts for the coming year. But watch out for upside risks to the outlook; the economy gained some traction in the final months of 2016. It is reasonable to believe that traction will hold in 2017.
Here comes margin pressure!
It’s not just the Fed that equity investors have to worry about. As the economy moves towards full employment, the upward pressure on wages from the labor shortage is likely to start to compress corporate operating margins. Variant Perception observed that rising real unit labor costs (note inverted right scale) tend to lead corporate profits by about two quarters.
In the absence of other factors, such as the Trump tax cuts, earnings growth is likely to come under pressure. For now, Factset reports that the Street has jumped on the global reflation theme and forward EPS is rising. In fact, the pace of downward earnings guidance has been lower than usual.
The risk of a negative surprise from falling operating margins should rise should labor market conditions stay tight.
The risk of a policy error
Even as the Fed prepares to raise rates, there is a risk that the Fed may mis-read the economy over-tighten a maturing expansion into recession. An area of concern is the loss of momentum in NFP growth. In the past, the deceleration of YoY NFP growth to 1.5% has been an ominous sign for both the economy and the stock market.
The evolution of temporary employment is telling a similar story. Temporary employment edged down in December. While the decline may be a data blip, temp jobs has led labor market growth in the last two cycles.
Indeed, New Deal democrat, who monitors high frequency economic releases, is starting to worry about weakness in his long leading indicators, though the short leading indicators and coincidental indicators remain healthy.
The interest rate components of the long leading indicators improved enough in the last two weeks to score neutral. The yield curve and money supply as well as real estate loans remain positive. The big news, however, is that both purchase and refinance mortgage applications have now turned negative.
Short leading indicators, including stock prices, jobless claims, industrial commodities, the regional Fed new orders indexes, spreads, and temp staffing are all positive. Oil and gas prices, and the US$ are neutral. Gas usage turned neutral.
The coincident indicators remain mixed. Steel, consumer spending, and tax withholding are positive, and rail mildly so. The BDI is neutral. The Harpex shipping index, the TED spread and LIBOR remain negative.
Seasonality will continue for one more week to be a huge factor in the volatility of the data. This week I am particularly discounting the strong staffing number. That being said, the shorter term 6 month forecast remains strongly positive (barring a trade war). The 12+ forecast is murkier now with mortgage applications finally turning negative. How long the post-Brexit strength in the monthly housing numbers continues will be important to watch.
If the Fed were to raise rates three, or maybe even four times, this year, it risks committing a policy error by looking in the rear view mirror of inflationary pressures and tightening just as the economy rolls over.
All eyes on the Trump administration
In short, market expectations for the Trump administration’s policies are high, even though Trump hasn’t even taken office. The bull case for equities rests on a combination of global reflation, Trump tax cuts, and deregulation. The bear case is based on the risks of a trade war (see How Trump/Navarro could spark a market crash), a hawkish Federal Reserve, and wage pressures on corporate margins.
David Kostin of Goldman Sachs (via Josh Brown) quantified the effects of these factors on earnings in the chart below, though he did not take into account the effects of high wage rates. As well, rising interest rates have a relatively minimal effect on earnings, but affect stock prices through changes in the P/E ratio. As the chart shows, the effects of tax policy is significantly higher than most of the other factors (annotations in red are mine).
In other words, Trump better come through on those tax cuts, or the stock market will see a very rough 2017.
Preface: Explaining our market timing models
We maintain several market timing models, each with differing time horizons. The “Ultimate Market Timing Model” is a long-term market timing model based on the research outlined in our post, Building the ultimate market timing model. This model tends to generate only a handful of signals each decade.
The Trend Model is an asset allocation model which applies trend following principles based on the inputs of global stock and commodity price. This model has a shorter time horizon and tends to turn over about 4-6 times a year. In essence, it seeks to answer the question, “Is the trend in the global economy expansion (bullish) or contraction (bearish)?”
My inner trader uses the trading component of the Trend Model to look for changes in direction of the main Trend Model signal. A bullish Trend Model signal that gets less bullish is a trading “sell” signal. Conversely, a bearish Trend Model signal that gets less bearish is a trading “buy” signal. The history of actual out-of-sample (not backtested) signals of the trading model are shown by the arrows in the chart below. Past trading of the trading model has shown turnover rates of about 200% per month.
The latest signals of each model are as follows:
Ultimate market timing model: Buy equities
Trend Model signal: Risk-on
Trading model: Bearish
Update schedule: I generally update model readings on my site on weekends and tweet mid-week observations at @humblestudent. Subscribers will also receive email notices of any changes in my trading portfolio.
How the market could crash
At the end of 2016, WSJ reporter Greg Zuckerman made a tweet with ominous implications. Hmm…what happened in 1929?
Here is how a market crash can happen. Donald Trump’s appointment of Peter Navarro, the author of Death by China, represents the biggest source of policy tail-risk for the capital markets. Bashing China may be satisfying for Trump supporters, but the Chinese economy is increasingly fragile (see How much ‘runway’ does China have left?). Impose tariffs on Chinese goods, and you risk a Chinese economic slowdown that drags the world into a synchronized global recession.
While a crash is most definitely not my base case, the scenario of collapsing trade flows from a Chinese hard landing would first tank the Asian economies, followed by Europe, whose banking system are still over-levered and have not fully recovered from the Great Financial Crisis. Under such circumstances, an equity bear market would be a 100% certainty, and a market crash would be within the realm of possibility.
It’s hard to estimate the actual probability of a US induced China hard landing scenario. However, we should get better clarity as the Trump team moves into the West Wing of the White House in the coming weeks. In addition, President-Elect Trump may give us some clues on trade when he holds his press conference on Wednesday.
Fragile China
The chart below (via Stratfor) shows the trajectory of credit to GDP of countries that have experienced a strong rise in debt. It is only a matter of time that China’s debt capacity hits the wall, just like every country that has experienced a period of hyper-growth in the 20th and 21st Century.
I wrote a post last summer that highlighted analysis from China watcher Michael Pettis. Pettis made the case that China had a maximum of 2-3 years to resolve its growing debt problem (see How much ‘runway’ does China have left?). Fast forward to today, the time horizon is only 1-2 years.
Christopher Balding, writing in Bloomberg Views, explained the fragility of China’s financial system this way:
Rising asset prices in China have helped prop up everything from coal and steel firms to consumer sentiment. But with potential bubbles popping up everywhere, the government seems to be laying the groundwork for reform. That could mean raising interest rates, applying new restrictions on trading or tightening other regulations. Remember that such measures, however necessary, carry risks of their own. For example, given that China has some of the world’s most expensive housing relative to income, and extremely low turnover, withdrawing credit could result in a real-estate price shock. That might cause indebted developers to fail, or lead to much stronger government action to prevent a hard landing. As regulators try to rein in other asset prices, watch for similar turmoil in bonds and the yuan.
In short, it’s an accident waiting to happen:
Remember that risk is probabilistic and not mechanistic. As China’s known risks accumulate, the probability of some unexpected event having an outsized impact also increases. In such circumstances, the biggest mistake one can make is to rely on past assumptions to predict the future.
To be sure, most of the Chinese debt is denominated in RMB and therefore any blow-up is unlikely to resolve itself in a typical EM debt crisis fashion. Nevertheless, the cracks are starting to appear. A recent FT article warned of the risks in the Chinese financial system:
The dangerous nexus between shadow lenders and large, systemically important commercial banks. Trusts raise funds for their loans by selling high-yielding wealth management products [WMPs] to investors. For the riskiest trust products, banks typically serve only as sales agents but bear no legal responsibility for product payouts.
Yet investors often ignore these technicalities, assuming that state-owned banks — and by implication, the government — stand behind the products they distribute. Adding to the perception that defaults are impossible is a history of bailouts of WMPs by banks, even where no legal responsibility exists.
In December, the Chinese bond market tanked. It wasn’t just the prospect of the Fed raising interest rates, but shenanigans in the local shadow banking system (via Caixin):
It all started with a rumor that proved true. A midsize brokerage firm, Sealand Securities, was said to be reneging on a deal involving bonds worth originally 10 billion yuan ($1.44 billion) on Dec. 14. It soon turned out that it had made similar under-the-table repurchase agreements with more than 20 financial institutions to buy back bonds worth more than 20 billion yuan. Because those bonds were now trading at a loss, Sealand did not want to complete the agreements and buy them back. And what made it think it could do that? Because it said the seal used for all the repurchase agreements was forged. This had a far-reaching impact on the bond market, regardless whether a firm was directly involved in the troubled agreements or not. Sealand later said it had solved the disputes with the financial institutions after the direct intervention of high-level securities regulatory officials.
The possible default by a midsize brokerage firm sparked panic as it raised the possibility of a bank run in the shadow banking system:
To understand what this means, let’s first take a look at how funds flowed from banks to non-bank financial institutions and the bond market.
Typically, the process would start with a big bank purchasing the wealth management products offered by a smaller bank. The small bank then outsources the investment of the fund it received to a non-financial institution, such as a securities firm. The securities firm invests the money into bonds. But when bond prices kept falling, combined with the pressure of tightened liquidity that banks now need to grapple with, the flow of funds went into reverse as banks wanted cash.
This set in motion events that reinforced one another and increased the bond market volatility. As the securities firm sells off bonds to pay back the small bank, which itself may be facing increased pressure of returning funds to the large bank, bond prices fall further and more banks want their money back.
The December episode was only a hiccup, but where there’s smoke, there’s probably fire.
Enter Peter “Death by China” Navarro
Trump’s appointment of Peter Navarro as the director of the US National Trade Council and Robert Lightizer as US Trade Representative are ominous signs for the Sino-American trade relationship. While on the campaign trail, candidate Trump had shown an antipathy towards China and Mexico on trade. The appointment of Navarro, who authored Death by China, is especially unsettling. Lightizer has spent much of his career representing American steel producers in trade dispute litigation and he is unlikely to be any friend of China.
Despite the claims by Trump and Navarro, the Chinese yuan is not under-valued against the USD. As shown by this chart from Callum Thomas of Topdown Charts, the decline in CNYUSD is mostly attributable to USD strength (red line). CNY has been relatively steady against its CFETS currency basket (blue line).
If the US were to pressure China on trade, Beijing would react badly. Ian Bremmer of Eurasia Group believes that internal political pressures gives Xi Jinping little room to maneuver:
China’s scheduled leadership transition this fall will shape its political and economic trajectory for a decade or more. The scale of elite turnover before, during, and after the upcoming 19th Party Congress, combined with the divisive political environment that President Xi has fostered, will make this transition one of the most complex events since the beginning of China’s reform era.
Two risks flow from the upcoming power consolidation. First, because Xi will be extremely sensitive to external challenges to his country’s interests at a time when all eyes are on his leadership, the Chinese president will be more likely than ever to respond forcefully to foreign policy challenges. Spikes in US-China tensions are the likely outcome. Second, by prioritizing stability over difficult policy choices in the run-up to the party congress, Xi may unwittingly increase the chances of significant policy failures.
Xi cannot be seen to appear weak and therefore he will not tolerate any challenges. Notwithstanding issues like Taiwan and the South China Sea, which could be geopolitical flashpoints in 2017, expect economic challenges on trade to be met with resolve.
Xi’s sense that he will have to respond resolutely to any foreign challenge to national interests—in a year during which popular and elite perception of his leadership matter more than ever—means foreign policy tensions will escalate. At the least, Xi will view any external challenge as an unwelcome distraction from his focus on domestic political machinations. At worst, he will fear such threats could undermine his standing at home. Consequently, the president is likely to react more forcefully than his potential challengers expect. And unfortunately for global stability, the list of triggers that could rattle the president is long: a newly-empowered Trump and his China policy, Taiwan, Hong Kong, North Korea, as well as the East and South China Seas.
That’s how trade wars and hard landings can happen:
The intense focus on domestic stability means Xi may well overreact or stumble over any sign of economic trouble. This risk could take the form of a re-inflation of asset bubbles to boost domestic growth, or a substantial ramp-up in capital controls—either move would rattle foreign investors and international markets. Whatever form it takes, any misstep by Xi would provoke global economic volatility.
In case you didn’t get that, “global economic volatility” is code for “rising risk of a synchronized global recession”.
What happens in a trade war?
Should the Trump administration label China a currency manipulator and impose tariffs on Chinese exports, China will respond forcefully. The Petersen Institute modeled what would happen in a full-blown trade war. US GDP would be flat for two years – and those are just the first order effects.
The first shot in a trade war would also give the green light for the PBoC to weaken the CNY (what else do they have to lose?) in response. Already, China is struggling with capital flight. A collapsing CNYUSD exchange rate risks a disorderly hemorrhage of China’s foreign exchange reserves. In addition, China’s newly announced regulatory changes to stem capital flight does not exactly inspire confidence.
If the Chinese economy were to tank, the collateral damage would first be felt among China’s major Asian trading partners, such as Hong Kong, Taiwan, South Korea, and Japan. The import of capital goods from Europe, most notably Germany, would fall. The failure of German exports, which has been the growth engine of the Europe, would weaken the already fragile eurozone financial system, whose leverage problems have not been solved since the last crisis. The problems of Banca Monte dei Paschi di Siena will be a tempest in a teapot compared to the problems that the European financial system will have to face.
Moderating influences on trade
At this point, the US induced China slowdown scenario is just a speculative scenario. It’s impossible to know how the Trump administration will actually act when it assumes power.
On one hand, Trump has flip-flopped on many issues over the years, but he has stuck to the assertion that China has been an unfair trader. The prospect of a protectionist US government will undoubtedly give the market jitters.
On the other hand, there are signs that there are moderating influences within the Trump administration on trade. Politico reported that Wilbur Ross was a Sinophile before he got the nomination to become Commerce Secretary. Ross could very well be a moderating influence on trade within the Trump administration.
I think the China-bashing is wildly overdone in this country,” said Ross in one CNBC interview, a statement that would have come across as a veiled swipe at Trump if he hadn’t made it in 2012. “The reality is that if something were to happen that cost China jobs, like if they upwardly revalued the currency a lot, those jobs aren’t going to come back to the U.S., they would go to Vietnam, they would go to Thailand, they would go to whatever country was the lowest cost, so it’s a fiction on both sides that those jobs will come back.”
Asked about outsourcing four years earlier by Profit Magazine, he said, “China has become the whipping boy in the U.S., just as Japan was some 15 years ago. This certainly is intellectually wrong.”
And in May, Ross, 79, explicitly departed from his future boss on a flashpoint in international trade, noting that China’s currency is in fact overvalued, not undervalued as Trump had been claiming on the campaign trail. “I disagree with my friend Mr. Trump in that particular regard,” he told Bloomberg.
More importantly, the New York Times reported that Trump`s son-in-law Jared Kushner has been pursuing a property development deal of a NYC building at 666 Fifth Avenue with Anbang Insurance, a Chinese financial conglomerate with uncertain ownership. Such relationships could color the administration`s views on trade with China as Kushner is expected to have an important unofficial voice in foreign affairs.
Indeed, despite a lack of foreign policy experience, Mr. Kushner is emerging as an important figure at a crucial moment for some of America’s most complicated diplomatic relationships. Such is his influence in the geopolitical realm that transition officials have told the Obama White House that foreign policy matters that need to be brought to Mr. Trump’s attention should be relayed through his son-in-law, according to a person close to the transition and a government official with direct knowledge of the arrangement.
So when the Chinese ambassador to the United States called the White House in early December to express what one official called China’s “deep displeasure” at Mr. Trump’s break with longstanding diplomatic tradition by speaking by phone with the president of Taiwan, the White House did not call the president-elect’s national security team. Instead, it relayed that information through Mr. Kushner, whose company was not only in the midst of discussions with Anbang but also has Chinese investors.
Notwithstanding how Trump and Kushner negotiate the delicate conflicts of interest issues, Trump himself has financial interests that are tied to Chinese state owned enterprises:
On China, Mr. Trump has talked a tough game, accusing Beijing of currency manipulation and raising the possibility of a trade war. But whether that is only a negotiating tactic remains to be seen. The president-elect has his own financial entanglements with China: He owns a 30 percent stake in a partnership that owes roughly $950 million to a group of lenders that includes the Bank of China, and one of his biggest tenants at Trump Tower is another state-owned bank, the Industrial and Commercial Bank of China.
The trade policy situation can only be described as fluid. I am watching how the Asian stock markets as my canaries in the coalmine. So far, they are behaving well as the stock indices of China’s major trading partners remain above their 50 day moving averages.
The week ahead: Watch for volatility
Looking to the week ahead, the Dow came within a hair of 20,000 at 19,999.63 and pulled back. Sentiment readings are overly bullish, which suggests a period of consolidation or pullback is ahead (via Urban Carmel).
Bloomberg reports that the latest readings from BAML’s funds flow analysis shows that nearly $70 billion have poured into equities since the election.
The BAML Sell Side Indicator, which measures the bullishness of Street strategists on stocks, has spiked from a contrarian buy signal into neutral territory.
Equally worrisome are the action of insiders. The latest update from Barron’s shows that this group of “smart investors” have moved into sell mode. Readings of insider activity tend to be noisy, but this latest data point represents another headwind for the bulls.
Measures of risk appetite are equally disturbing. Even as the market tested resistance at fresh highs on Friday, the chart below shows that risk appetite metrics were falling. The ratio of high beta to low volatility stocks (middle panel) was making a pattern of lower lows and lower highs. The relative performance of small caps to large caps (bottom panel) had violated its relative uptrend in addition to displaying a negative divergence condition.
When I put it all together, near-term upside potential is probably limited. A more likely outcome would be a period of sideways consolidation or pullback. My inner investor remains constructive on stocks, though he is nervously monitoring how the trade positions of the new Trump administration evolves.
My inner trader has taken a small short position in stocks. He waiting for the inevitable end of the Trump honeymoon. Wait for potential fireworks from the Trump press conference on Wednesday.
Recently, I have seen several variations of market analysis concluding that stocks are expensive based on forward P/E ratios. Here is a tweet from Jeroen Blokland. David Rosenberg characterized the current equity environment as picking up pennies in front of a steamroller.
Blokland followed up the above tweet with an additional comment indicating that earnings growth is badly needed.
Does this mean it’s time to get cautious and sell your all stocks? Not so fast! A case can be made that the analysis of the forward P/E chart is based on a misread of how forward EPS expectations are formed. On an adjusted basis, stocks do not appear to be expensive at all.
Misreading forward P/E
Let’s consider how the process of how EPS estimates are formed. Individual analysts project earnings for the companies that they cover. Various data services compile and aggregate earnings estimates. From these estimates, forward EPS can be calculated for individual companies and for the market as a whole.
What happens when there is a macro shock to the system, such as the Asian Crisis, or the election of a new leader who promises business friendly policies? How do analysts react when the magnitude of the effect is unknown?
During my experience managing equity portfolios using bottom-up quantitative models, a sequence of events occur in approximately the following way after a macro shock. First, the best factors that work are the short-term technical analysis models, followed by estimate revision factors, as analysts revise their earnings upwards or downwards. Finally, the classic fundamentally driven value and growth factors then respond. After a macro shock, analysts know that things will be very good, or very bad, but they don’t know how much. They don’t actually revise their estimates until they can quantify the effect.
In the current environment, the market believes that the Trump tax proposals will be positive for earnings growth. We just don’t know how much. In effect, company analysts haven’t revised their earnings estimates to reflect the likely effects of the Trump tax cuts yet.
On the other hand, while bottom-up derived data of individual company analysts’ estimates don’t reflect the effects of the Trump tax cuts, Street strategists have taken a stab at projecting the likely tax cut effects on SP 500 earnings. As I pointed out before (see How Trumponomics can push the SP 500 to 2500+), the consensus forecast is about a 10% boost to earnings in FY2017.
The chart below from Factset (annotations in red are mine) depicts what happens if the E in the forward P/E ratio rose by 10%, as per the top-down strategists. The forward P/E falls from 16.9, which is near its historical highs, to 15.4, which is slightly above its 5-year average. Do stocks look expensive when viewed this way?
What about trailing P/E and earnings growth?
On a trailing P/E basis, the stock market does appear to be expensive at first glance. However, as the chart below shows, a trailing P/E ratio of 20.6 translates to an earnings yield of 4.9%. When you consider that the 10-year Treasury note yields 2.5%, do stocks look expensive?
The bull case for US equities have three earnings components:
Organic cyclical growth;
Tax cut effect; and
One-time tax holiday boost from the repatriation of offshore cash.
Company analysts have not factored the last two effects into their earnings estimates. However, we can see from Factset that forward EPS continues to rise due to a cyclical recovery in economic growth.
Indeed, the latest Atlanta Fed’s nowcast of Q4 GDP has risen to 2.9%:
The growth revival component of the bull case is well supported by the evidence, both from a top-down (Atlanta Fed`s GDPNow) and bottom-up (Factset`s aggregated forward EPS) basis.
The bull and bear cases
In conclusion, we can make a bull case that the US equity market is fairly valued. The forward P/E ratio, adjusted for the Trump tax cuts, is not out of line with historical experience. The trailing earnings yield appears reasonable when compared to fixed income alternatives. The economy is undergoing a cyclical rebound, which would have happened no matter who had won the election.
Just because a market is fairly valued doesn’t meant that it can`t get overvalued. The bull case is also bolstered by a positive momentum in risk appetite. Josh Brown highlighted analysis from Ari Wald of Oppenheimer indicating that high beta stocks have rallied through a relative downtrend. While nothing goes up in a straight line, this development can be interpreted bullishly on an intermediate term basis.
The bear case is the market is pricing in the full effects the Trump tax cuts. If the incoming administration stumbles and cannot get its fiscal package through Congress, equity prices will adjust downwards in accordance with that disappointment. In addition, there are plenty of policy potholes in the road as the new team takes over the White House (see The bear case: How Trumponomics keeps me awake at night).
For the last word, we can get a clue from how corporate insiders are reacting. The latest update from Barron’s of insider activity shows that the behavior of this group of “smart investors” has been in neutral since the election.
So far, the insiders don’t appear terribly concerned about valuation, but they are sitting on the fence.
As 2016 has drawn to a close, it’s time to review the report card from my 2016 calls. My inner investor performed very well, though my inner trader suffered a number of hiccups. Overall, I had a solid year in 2016.
My inner investor: Steadfastly bullish
The chart below depicts the key highlights of my investment calls, which are based on a 6-24 month time horizon. I remained steadfastly bullish for most of 2016 even as others panicked. The jury is still out on my latest call for a correction in early 2017 (see A correction on the horizon?). My analysis has turned out to be largely correct.
The chart below depicts the calls of my trading model. While they appeared to be very good at first glance, I discovered a couple of problems in implementing the trades.
First, the model was a little slow and did not react to the slow deterioration in the market during the late summer. Even as the model remained long, the slow drip-drip-drip downtrend in prices (marked by the white arrow in the chart) was a little disconcerting. As the trading model is based on sensing changes in price trends, the lack of trade signals highlights a problem when the market moves sideways.
On the other hand, another problem arose when the model became overly sensitized to changes in prices. The trading model experienced whipsawing signals in the aftermath of the Brexit election (buy to sell to buy within a few days) and the US election (buy to sell to buy in the overnight futures market). These two issue highlight the need for further research in the future.
These problems highlight the problem with short-term trading and trading models. The chart above is a weekly chart and therefore does not show the actual price volatility experienced by traders.
Sometimes trading is like that. You think you have the perfect setup, followed by the perfect signal, then you miss on your execution, which results in an unfortunate outcome (click this link if the video is not visible).
I have no idea of what 2017 will bring, though I outlined my market views in my last post (see The cloudy side of Trump). In all likelihood, the incoming Trump administration will create a high degree of uncertainty and market volatility.
I hope that I can help you navigate it in the year to come.
Preface: Explaining our market timing models
We maintain several market timing models, each with differing time horizons. The “Ultimate Market Timing Model” is a long-term market timing model based on the research outlined in our post, Building the ultimate market timing model. This model tends to generate only a handful of signals each decade.
The Trend Model is an asset allocation model which applies trend following principles based on the inputs of global stock and commodity price. This model has a shorter time horizon and tends to turn over about 4-6 times a year. In essence, it seeks to answer the question, “Is the trend in the global economy expansion (bullish) or contraction (bearish)?”
My inner trader uses the trading component of the Trend Model to look for changes in direction of the main Trend Model signal. A bullish Trend Model signal that gets less bullish is a trading “sell” signal. Conversely, a bearish Trend Model signal that gets less bearish is a trading “buy” signal. The history of actual out-of-sample (not backtested) signals of the trading model are shown by the arrows in the chart below. Past trading of the trading model has shown turnover rates of about 200% per month.
The latest signals of each model are as follows:
Ultimate market timing model: Buy equities
Trend Model signal: Risk-on
Trading model: Bearish (downgrade)
Update schedule: I generally update model readings on my site on weekends and tweet mid-week observations at @humblestudent. Subscribers will also receive email notices of any changes in my trading portfolio.
Is the Trump honeymoon over?
Bloomberg had a marvelous article that captures the market’s mood right now. It is entitled “The sunny side of Trump: There’s reason for short-term optimism. Then he has to deal with his policy contradictions”.
How long will this honeymoon last? For American business, the positive scenario is that Trump appoints sensible people, matures in office, and puts most of his considerable energy into the pro-growth parts of his agenda. The negative scenario is that he goes back to being the inciter who flew off the Twitter handle so much during the campaign that his people temporarily seized control of his account.
The bull case, which I laid out two weeks ago (see How Trumponomics can push the SP 500 to 2500+), is well known. Since the election, the stock market has embraced the prospect of a global cyclical upturn, anticipated fiscal stimulus, and buyback gains from a tax holiday fueled repatriation of offshore corporate cash. I went on to outline the bear case as the second part of my series the following week (see The bear case: How Trumponomics keeps me awake at night).
As Inauguration Day approaches, acts such as the appointment of Peter “Death by China” Navarro as trade czar has begun to unnerve the bulls. Market psychology is starting to turn from greed to fear. Concerns are rising that new Trump edicts may see parallels to this scene from Woody Allen`s 1971 comedy, Bananas (click this link if the video is not visible).
To be sure, bullish sentiment has surged in the short-term. Stock prices may have run ahead of themselves and a corrective period is likely. The bigger question is how will the bull and bear case resolve themselves in the longer term? I address that question this week with a scenario analysis that has some surprising results.
The bulls are back in town
There are numerous signs that the market sentiment has gotten too bullish too fast. Business Insider recently observed that Barron’s couldn’t find any strategists who thought that stock prices would fall in 2017. Bloomberg pointed out that range in Street strategists’ price targets have narrowed, as part of a herding effect.
Composite metrics of investor sentiment, like this one from Sentiment Trader, are at a bullish extreme. That’s contrarian bearish.
This analysis from Ned Davis Research came to a similar conclusion. It’s time for the market to pull back or consolidate its gains.
Finally, you can tell that market psychology has shifted by the tone of the tweets from a veteran WSJ reporter.
Hmmm, what happened after the Hoover election in 1929?
Here is the bear case in some context. I put the following question to a number of Trump supporters who are bullish on stocks and the economy. If you are so convinced that Trump will make America great again, then at what interest rate would you lend him money? What would it take to turn you from an equity investor into a debt investor?
An unscientific Twitter poll gave me some clues. As much as Trump supporters like his approach, few are willing to lend him money at current market rates.
If rates have to rise by 1-2% under those circumstances, what does that mean for equity valuations? Let’s do some quick, back of the envelope calculations. Data from Factset shows that the SP 500 trailing 12-month P/E ratio to be 20.6, which translates into an earnings yield of 4.9%. When I compare that figure to the UST 10-year rate of 2.5%, stocks are still attractive, especially when a long-term equity holder can expect growth on top of the 4.9% earnings yield.
Now raise the UST 10-year rate by 1-2%. Would you own stocks at a 4.9% earnings yield when the 10-year Treasury yield is 4.5%?
Scenario analysis
I performed some simplistic scenario analysis, based on the assumption that the equity risk premium, defined as the spread between earnings yield and 10-year Treasury yield, remains unchanged. The scenarios are:
Full implementation of Trump’s program of tax cuts and offshore cash tax holiday
A delay in the fiscal program: It would be easy to envisage a scenario where the Trump team spends much of its initial legislative effort to repeal ACA, or Obamacare, and alienates the Democrats in Congress. Attempts to pass an ambitious program of tax cuts get blocked by GOP budget hawks and the new administration cannot cobble together sufficient support from Democrats across the aisle because of the bitter ACA fight. The fiscal stimulus program either gets watered down, or delayed into 2018-2019.
A disaster scenario involving trade wars, a global collapse in growth, or a simple 2% increase in Treasury yields without any commensurate rise in earnings.
The table below summarizes my findings. In a previous post (see How Trumponomics can push the SP 500 to 2500+), I had shown three components of equity gains. The first component is the global cyclical revival, which I estimated EPS growth at 6-8%. The second component comes from lower corporate tax rates, which could boost earnings growth by another 8-10%. To be conservative, I added the first two components together and modeled EPS growth at 15%. The third is the one-time buyback boost to stock prices from offshore cash repatriation, which I penciled in at a 5% price gain. In my scenario analysis, I also modeled what happens if rates were to remain the same, rise by 1%, or 2%. Further, I assigned probabilities to each of the outcomes. This table below shows a relatively optimistic case analysis as I assume that Trump has a 65% chance of getting his fiscal programs passed, with a 30% of a delay, and only a 5% of disaster.
Here are some observations from this analysis. First, the weighted increase in UST yields comes to 0.7%, which is consistent with “dot plot” expectations of three 2017 Fed rate hikes and a parallel shift in the yield curve.
Since the election, the market has mainly been focused on the best case scenario, whose benefits are known. Even with a relatively optimistic estimate of probabilities, the weighted 2017 target only represents a 3% price gain in the SP 500. As Inauguration Day approaches and the market starts to focus on downside risks, no wonder stocks are starting to trade a little heavy.
Here is some sensitivity analysis. A more bearish probability weighting where the probability of Trump’s fiscal program passage falls from 65% to 45%, the delay scenario odds rising to 45%, and the disaster scenario at 10% results a 0% price gain in 2017.
Some reasons for optimism
Does that mean equity market return expectations for 2017 are likely to be unexciting? Not necessarily. My conclusion of a relatively flat expected returns for the SP 500 in 2017 is based on an unsophisticated model with the simple assumption of a constant equity risk premium. There are a number of reasons for optimism .
Antonio Fatas, professor at INSEAD, recently outlined a more detailed model of the equity risk premium (ERP), where:
RP= E/P -RF + G
RP = Risk premium
E/P = Earnings to Price
RF = Risk-free rate
G = Growth
Fatas went on to plot the evolution of the ERP and observed that current readings are not out of line with historical averages. In fact, the risk premium has room to fall. An ERP compression would have either the effect of P/E expansion, or offset the negative effects of a rise in interest rates. Based on my observation of the chart below, ERP could easily fall by 1.0-1.5% before getting in the red zone seen at the height of the last bull market.
Here is another way of thinking about why the ERP has more room to fall. The market’s animal spirits haven’t totally revived yet. We need greater bullishness for a market top to form. This is consistent with sentiment readings from AAII bulls shown in the chart below. While short-term bullishness has risen, longer term metrics such as the 52-week moving average is still extremely low. Not every individual investor is glued to the screen 24/7. Most don’t check their portfolios on a hourly or daily basis. We need greater participation from the public for a top to form.
In addition, there may be some short-term goods news on interest rates. I have been waiting for Trump to make some comment on Fed policy since the December rate decision. Would he side with the hard-money audit-the-Fed crowd, who are his main supporters, who advocate for a rule-based Fed, which implies a tighter monetary policy? Or would he revert to his real estate developer’s persona and criticize the Fed for raising rates?
Last week, we saw part of an answer. Wilbur Ross, the nominee for Commerce Secretary, tweeted the following in support a weaker USD and therefore an easier monetary policy.
If Ross’ views does indeed represent the Trump administration’s position, then expect the new nominees to the two open positions on the Federal Reserve board of governors to have dovish tilts. In that case, it would ease any short-term concerns over interest rate pressures on stock prices. Longer term, however, there is a price to pay for stacking the board with too many doves. An overly accommodative Fed caught behind the inflation fighting curve will have to respond with a series of sharp rate hike that push the US and global economy into recession.
Here is where my scenario analysis gets a bit speculative, as there are so many moving parts. The combination of a falling ERP and a friendly Fed could push the expected price appreciation on the SPX to 6-7%. Add in another 2% of dividend yield, and equities would still look attractive in 2017 with a total return of 8-9%. The TINA (There Is No Alternative) scenario is still in play for stocks.
…but VIX remains low, indicating market complacency. Any negative surprise has the potential to spark a market correction.
In addition, Callum Thomas observed that the Citigroup US Economic Surprise Index, which measures whether macro indicators are beating or missing expectations, tends to be seasonally weak in the first three months of the year. In other words, be prepared for some growth disappointment on the macro front.
Other cyclically sensitive indicators, such as industrial metal prices, have retreated and breached their 50 day moving averages.
The week ahead
When I put it all together, it points to a correction of unknown proportions. I sent an email alert last Thursday indicating that the trading model had turned negative. My inner trader liquidated all his long equity positions and went short the market. Subsequent to that email, the SPX decisively broke down out of its range. The next most likely support level can be found at the SPX breakout level of about 2200.
I am seeing confirming signals from other asset classes from an inter-market analytical perspective. Bond prices, which have been inversely correlated to equity prices, are starting to recover.
As well, gold prices have rallied out of a downtrend and they are turning up.
Barring any outlier surprises, such as a sneak attack on North Korean or Iranian nuclear facilities that upset the current geopolitical equilibrium, my inner investor remains constructive on equities and he is inclined to buy the dips. His base case scenario is a correction to test the breakout level at 2200, followed by a rally later in the year to fresh highs. The Dow will exceed 20,000 in 2017.
In addition, the monthly MACD buy signal on the Wiltshire 5000 remains intact.
There will be fireworks, and volatility. I will be with you every step of the way.
Mid-week market update: It’s always nice to take a few days off during the holidays, except all that I got for Christmas was a cold. The stock market doesn’t seem to be doing too much better as it tests the bottom of a narrow trading range during what should be a period of positive seasonality.
None of the other major indices, such as the DJIA, NASDAQ, or Russell 2000, have broken support. The one exception is the Dow Jones Transports.
My inner trader has a number of tactical concerns as we look ahead into January.
Weak Twitter breadth
As the chart from Trade Followers shows, Twitter bullish breadth is weakening. Such a condition is bad news for the bulls.
Complacency from option market
As stock prices have rallied since the election, the level of anxiety fall significantly. The chart below depicts the spread between 3-month VIX and 9-day VIX. Usually, the spread is positive, which is called a contango in the VIX term structure. However, when the contango gets too high, defined as the spread as 6 points or more, the stock market has generally undergone a period of sideways consolidation or correction (blue dotted lines).
The term structure spread went above 6 on Friday, December 23, 2016.
Where’s Santa Claus?
The combination of weak-ish market action, deteriorating breadth, and excessively bullish sentiment does not bode well for the Santa Claus rally. Ryan Detrick of LPL Financial studied the relationship between the Santa Claus rally, which he defines as the period for the last five days of the year and the first two days of the new year. Detrick found that the lack of a Santa Claus rally is not a good sign for January.
The jury is still out for this year’s Santa rally, but the signs are not looking good.
I am not willing to throw in the towel on the bull case just yet. However, if we see a definitive downside break in the trading range, the trading model will flip from bullish to bearish and my inner trader will act accordingly.
Preface: Explaining our market timing models
We maintain several market timing models, each with differing time horizons. The “Ultimate Market Timing Model” is a long-term market timing model based on the research outlined in our post, Building the ultimate market timing model. This model tends to generate only a handful of signals each decade.
The Trend Model is an asset allocation model which applies trend following principles based on the inputs of global stock and commodity price. This model has a shorter time horizon and tends to turn over about 4-6 times a year. In essence, it seeks to answer the question, “Is the trend in the global economy expansion (bullish) or contraction (bearish)?”
My inner trader uses the trading component of the Trend Model to look for changes in direction of the main Trend Model signal. A bullish Trend Model signal that gets less bullish is a trading “sell” signal. Conversely, a bearish Trend Model signal that gets less bearish is a trading “buy” signal. The history of actual out-of-sample (not backtested) signals of the trading model are shown by the arrows in the chart below. Past trading of the trading model has shown turnover rates of about 200% per month.
The latest signals of each model are as follows:
Ultimate market timing model: Buy equities
Trend Model signal: Risk-on
Trading model: Bullish
Update schedule: I generally update model readings on my site on weekends and tweet mid-week observations at @humblestudent. Subscribers will also receive email notices of any changes in my trading portfolio.
Trumponomics: The bear case
In last week’s post (see How Trumponomics could push the SPX to 2500 and beyond), I laid out the bull case for stocks under a Trump administration and how stock prices could appreciate 20% in 2017, assuming everything goes right. This week, I outline the bear case, or how Trumponomics keeps me awake at night.
Candidate Trump has said many things on the campaign trail, some of which are contradictory. President-elect Trump’s cabinet is taking shape and we are now getting some hints about policy direction. Nevertheless, there are a number of contradictions in his stated positions whose unexpected side-effects that could turn out to be equity bearish:
Legislative tax cut disappointment
A contradiction in fiscal policy vs. trade policy
Geopolitical friction with China
Rising geopolitical risk
Loss of market confidence
A possible collision course with the Federal Reserve
In this post, I will discuss each of these points, and I will end on how I believe these contradictions are likely to be resolved by the market.
Will Congress pass the Trump tax cuts?
My last weekend’s post (see How Trumponomics could push the SPX to 2500 and beyond) assumes that Candidate Trump’s fiscal stimulus plans of tax cuts and corporate offshore cash repatriation tax incentives will be passed by Congress. However, there may be significant resistance from Republican budget hawks.
The appointment of Mick Mulvaney as the head of OMB makes the passage of wholesale tax cuts less likely, as Mulvaney is known as a balanced budget advocate during his term in Congress (via Business Insider):
Trump has promised large tax cuts for both individuals and corporations, which would make increasing revenue difficult. He has also said he wants to invest heavily in the military, so cutting spending elsewhere may be difficult.
Debt always seemed to make sense given cheaper debt-servicing costs enabled by low interest rates, but now with Mulvaney at the helm of the OMB, this option may not be as likely.
“This significantly lowers the probability of big unfinanced tax cuts and big unfinanced infrastructure spending,” Torsten Sløk, the chief international economist at Deutsche Bank, said in a note to clients after the announcement.
This does not mean stimulus won’t happen; ultimately, Trump is still in charge and can push Mulvaney to include the spending in the budget or make the math work to get an infrastructure plan going. Mulvaney may be able to provide some pushback, however, Mills said.
“President-elect Trump’s statement announcing the nomination highlighted Rep. Mulvaney’s conviction to address the federal debt and pledged ‘accountability’ in federal spending in his Administration,” Mills concluded. “This leads us to believe that Mulvaney could push back against the significant stimulus spending.”
In effect, the stock market is priced for the perfection of Trump’s promised tax cuts. What happens if they don’t materialize as expected?
Fiscal policy vs. trade policy
Even if Trump gets his tax cut package passed, BAML foreign currency strategist David Woo recently appeared on Bloomberg and outlined a dilemma for the Trump team. Candidate Trump has made fiscal policy and trade policy the centerpieces of his campaign. But there is an inherent contradiction between the two.
His fiscal policy of tax cuts and incentives for offshore tax repatriation is very bullish, both for the US equities, the American economy, and the US Dollar. However, his trade policy of slowing or reversing the offshoring effect and enhancing trade requires a weaker USD. So what does he want? A strong Dollar or weak Dollar?
Mohamed El-Arian agrees with David Woo’s assessment of the strong vs. weak Dollar dilemma:
Though the US economy is doing much better than most of the other advanced economies, it is not yet on sound enough footing to withstand a prolonged period of a substantially stronger dollar, which would undermine its international competitiveness – and thus its broader economic prospects. Augmenting the risk is the prospect that such a development could spur the Trump administration to follow through on protectionist rhetoric, potentially undermining market and business confidence and, if things went far enough, even triggering a response from major trade partners.
Central to the dilemma is Trump`s view of China`s competitive position. One of Candidate Trump’s principal targets has been the trade behavior of China. The PBoC has been taking active steps to strengthen the CNYUSD exchange rate, which weakens their trade position. However, if a Trump administration were to label China as a currency manipulator, it would give cover for Beijing to actually devalue their currency in line with market forces, which sets the stage for a trade war that no one wants.
Even worse, Business Insider pointed out that a weakened yuan isn’t helping Chinese exports, which may be a signal that the China export engine is losing its competitive edge.
The yuan has been reaching multi-year lows, and the dollar’s recent strength after Donald Trump won the U.S. presidential election isn’t helping either. What’s even more worrisome is that October export numbers show that a weak yuan isn’t helping the Chinese economy.
“Stripping out the impact of yuan depreciation, exports in dollar terms fell 7.3% year on year in October after a 10% drop in September,” wrote Bloomberg’s Tom Orlik in a recent note. “Imports slipped 1.4% after a 1.9% decline. China’s trade surplus in dollar terms was $49 billion, up from $42 billion. The surplus is in contrast to a larger-than-expected $45.7 billion decline in China’s foreign reserves in October, indicating quicker capital outflows in the month.”
While diminishing growth in Chinese exports may sound like good news for the America First crowd, it also has the potential to set off a trade war through the devaluation channel if Trump were to label China a currency manipulator. Holger Zschaepitz at Die Welt observed that a cratering CNYUSD exchange rate could have global repercussions.
A weaker yuan would be the first shot in a possible trade war, followed by retaliation for possible US tariffs. Trump’s appointment of Peter Navarro, the author of Death by China, to head the newly created National Trade Council is particularly disconcerting. The chart below from Bloomberg shows the portion of sales that selected major American companies derive from China.
Consider, for example, Boeing (BA) which is the least exposed company on the list. In a trade war, The company claims that Chinese orders support 150,000 American jobs per year. (Who cares, that’s just a single month’s of Non-Farm Payroll job increases, right?) In addition, the WSJ reported that China is preparing a retaliatory response whose list includes Boeing, General Motors, and 30 million tons of soybeans imports from over 30 US states.
If the Trump team does go down the China confrontation road, then it must be prepared to bear the consequences. You want help controlling North Korea’s nuclear ambitions? Forget it! You want the Chinese to refrain from using its UN Security Counsel veto in a vote against Iran? You’ve got to be kidding!
You get the idea.
In general, taking steps to batter an already fragile Chinese economy is in no one’s interest. China’s debt excesses are well known. Crash the Chinese economy, and it will push most of Asia and resource based economies, such as Brazil, Australia, New Zealand, and Canada, into recession. Tanking Chinese capital goods demand would depress German exports and possibly topple the equally fragile eurozone economy. This domino effect of cascading economic crashes is not the kind of outcome anyone wants (see Why the next recession will be very ugly and How much “runway” does China have?).
Here is just one simple example of China`s economic fragility. In response to the Fed’s rate hike, the WSJ reported that Chinese bond market cratered. The South China Morning Post outlined four reasons why China is afraid of US interest rate increases:
Yuan depreciation against US dollar deepened
China forex reserves shrank quickly
China’s stock market plunged
Beijing started to reverse capital account opening process
The world is highly connected. You can’t just alter policy in one place without unexpected consequences showing up somewhere else. A China hard-landing could crash the global economy. The ensuing carnage has the potential to be another Lehman Crisis, or worse. Already, China is on the verge of implementing a tighter monetary policy, which raises the risks of an accident (via Bloomberg):
China’s leaders are pledging a harder push to rein in risk next year and emphasizing prudent and neutral monetary policy. With the Federal Reserve flagging a steeper interest-rate path, that sets the scene for the first U.S.-China tightening since 2006.
President Xi Jinping and his top economic policy lieutenants adjourned their annual planning conference Friday with a vow to safeguard the financial system and deflate asset bubbles. Maintaining stability and making progress on supply-side reform will be key 2017 themes, they said in a statement issued after the three-day Central Economic Work Conference.
“Policy makers are making clear that they’re determined to clamp down on speculation and will keep doing so next year,” said Wen Bin, chief research analyst at China Minsheng Banking Corp. in Beijing. “It’s very important to deflate the property bubble.”
To be sure, China is holding its 19th Party Congress in the autumn of 2017 and its timing will keep economic risk low for most of the year. The Party will do everything in its power to maintain the facade that growth is strong. Any hard landing, should it occur, won`t happen until Q4 2017 at the earliest.
Rising geopolitical risk
Another bearish factor for the market is rising geopolitical risk. A recent CNN Money post-election interview with Warren Buffett found the legendary investor to be bullish on America. However, he expressed reservations about the “temperament and judgment” of president-elect Trump when it came to WMDs.
More worrisome was Trump’s remarks about encouraging an arms race in nuclear weapons (via Reuters):
Trump had alarmed non-proliferation experts on Thursday with a Twitter post that said the United States “must greatly strengthen and expand its nuclear capability until such time as the world comes to its senses regarding nukes.”
MSNBC’s Mika Brzezinski spoke with Trump on the phone and asked him to expand on his tweet. She said he responded: “Let it be an arms race. We will outmatch them at every pass and outlast them all.”
In many ways, Americans have been spoiled by the history of their capital market returns. Many analysts have espoused a buy-and-hold discipline to equities, as long as the investor can bear the risk. That`s because the historical record shows that everything has turned out fine in the end, as evidenced by this chart from the Credit Suisse Global Investment Yearbook 2016 (annotations are mine).
But the hidden risk to capital returns has always been war and rebellion. Such episodes can turn the above US return pattern to the one below, even if you are a victor but the wars leave you exhausted and depleted.
Worst still, they can become like this, even for an economic and technology powerhouse like Germany. The real terminal value for German equities at $42 after 116 years may sound good, but they are dwarfed by the American results at $1271.
Or worst still, like this, when investors were far more concerned about personal survival than the value of their portfolios after cataclysmic events like revolution.
It would be overly simplistic to assert that Trump’s foreign policy by spur-of-the-moment Twitter is erratic and creates geopolitical instability. Thomas Wright explained in a thoughtful Foreign Policy article that the actual source of that instability comes from the tension between three distinct factions within the Trump administration. The three factions consist of America First, who counts Trump as its leader and is isolationist in outlook, the Religious Warriors, who sees America as locked in an existential conflict against the Islamic threat, and the Traditionalists from the foreign policy establishment. It is the tension between these three groups that create uncertainty about the direction of foreign policy:
These three factions—the America Firsters, the religious warriors, and the traditionalists—are mutually suspicious. But each also needs the others to check the third. Trump needs the religious warriors to prevent a mainstream takeover, but he fears they will drag him into a war against Iran. The religious warriors need Trump to achieve their objectives, but they also have no desire to collapse the U.S. alliance system. The traditionalists need both to check the radical impulses of the other.
The America that Trump inherits faces many geopolitical challenges. Former Swedish PM and diplomat Carl Bildt, writing in Project Syndicate, outlined the threats to the global order with a warning from Henry Kissinger, who has been a master practitioner of realpoltik:
Nearly two years ago, former US National Security Adviser and Secretary of State Henry Kissinger warned the Senate Armed Services Committee that, “as we look around the world, we encounter upheaval and conflict.” As Kissinger observed at the time, “the United States has not faced a more diverse and complex array of crises since the end of the Second World War.”
Bildt went on to fret about how the Trump administration might handle such a vast array of threats:
Against this volatile backdrop, the new Trump administration could very well embrace vastly different policies from what we have seen so far. Judging by the last few weeks, it seems as though we are going to have to live with a routine spectacle of international destabilization via Twitter…
Still, after years of rising turmoil and uncertainty, we have no choice but to assume that more “black swan” events are around the corner. From Donbas to North Korea to the Gulf region, there is no shortage of places where developments could take a shocking turn.
In normal times, the web of international relations affords enough predictability, experience, and stability that even unexpected events are manageable, and do not precipitate major-power confrontations. There have been close calls in recent decades, but there have not been any unmitigated disasters.
But those times may be over. We are entering a period of geopolitical flux: less stable alliances and increasing uncertainty. One should not exaggerate the risk of things spiraling out of control; but it is undeniable that the next crisis could be far larger than what we are used to, if only because it would be less manageable. And that is unsettling in itself.
The combination of Brexit, the Trump election, and anti-establishment threats in Europe has prompted Standard and Poor’s to issue an assessment concluding that political risk in developed markets is no different from the emerging markets (via Bloomberg):
“We believe it may no longer be possible to separate advanced economies from emerging markets by describing their political systems as displaying superior levels of stability, effectiveness, and predictability of policy making and political institutions,” wrote Moritz Kraemer, chief sovereign ratings officer, in a 2017 outlook report entitled “A Spotlight On Rising Political Risks.”
We have all become banana republics.
Loss of business confidence
Speaking of banana republics, Trump’s America is bearing an increasing resemblance to Indonesia under Suharto, or the Philippines under Marcos. Trump’s deals with Carrier to retain jobs in America, where he threatened retribution against any company offshoring jobs, or his tweets against Boeing (complaining about the cost of Air Force One) or against Lockheed Martin (complaining about the cost of the F-35) are examples of one-man rule by edict, rather than by a rules-based institutional system. My concern isn’t just about Trump’s policy by late night tweets, but whether individual decisions represent systematic policy initiatives with thoughtful consideration of policy consequences. Consider, for example, the above discussion about the conflict between fiscal policy and trade policy.
A country that is ruled by edict is a country subject to the whims of a single person. A country ruled by institutions have systems where property rights are upheld and there is high degree of regulatory certainty. Here is Tim Duy‘s reaction to the Trump threat of a tax on companies offshoring jobs:
President-Donald Trump’s renewed call for a 35% import tax on firms that ship jobs out of the United States triggered the expected round of derision from an array of critics, both on the left and the right. The critics are correct. It is indeed a terrible idea. One sure way to discourage job creation in the US is to guarantee that firms will be punished if they need to layoff employees in the future. It is just bad policy, plain and simple.
It`s not just bad policy, Trump has in essence accused American companies of treason and promised to punished offenders. In addition, his proposed initiative of a 35 % import tax sounds distinctly French and exemplifies the worst aspects of eurosclerosis. In France, employers cannot just arbitrarily hire someone. They have to prove that the company has sufficient resources to pay that employee and keep him around for a specific period. While employment law is very employee friendly, it creates a chilling effect for anyone who wants to expand into that jurisdiction. Moreover, such laws inhibit the natural process of creative destruction. In addition, Trump’s recent characterization of the “free market” as a “dumb market” in a Fox News interview does not exactly inspire business confidence (via Business Insider):
President-elect Donald Trump suggested that his administration would have to put a major tax on companies that relocate to other countries and then sell their goods in the US like “we’re a bunch of jerks.”
Why would anyone want to invest in France, Indonesia, or the Philippines America under those circumstances?
A collision course with the Fed?
Finally, the most recent hawkish interest rate raise by the Federal Reserve puts it on a potential collision course with the Trump administration. Not only did the Fed raise the Fed Funds target by a quarter point, it signaled that it is likely to raise rates three times, instead of two before the election. This would run counter to the stimulative effects of Trump’s tax cuts.
If Trump were to fill the two open seats on the Federal Reserve board with his hard-money cronies, they would likely favor a Taylor Rule like approach to setting interest rates, which would make the Fed even more hawkish. I recently wrote that my estimate of Taylor Rule target was 2.8%:
A more recent estimate of a neutral Taylor Rule target on a Bloomberg terminal turns out to be 4% (see Some perspectives on the new dot plot). A hard-money dominated FOMC would likely see interest rates faster than under a Yellen Fed.
I have no idea how this possible confrontation turns out, but the markets could freak out if the White House is on a collision course with the Fed. For some perspective, I conducted an unscientific Twitter poll early in the week asking Trump voters at what rate they would lend money to a government led by Donald Trump.
One respondent wrote:
hahahaha…. I would lend Trump money ONLY if secured by COLLATERAL WORTH MUCH MORE than the amount loaned.
That collateral would have to be something I could hold in my possession. Gold, for example.
Those poll results speak for themselves. If you voted for Trump and you are now equity bullish, and you are in the 3% or more camp, then ask yourself, “How much of an increase in earnings growth do you need in order to justify a 1% or more rise in bond yields?”
Bull vs. bear: What to do?
To summarize, my bull case for stocks has SPX earnings rising about 15-18% in 2017. If the P/E multiple stays the same, it would translate to a 15-18% boost to stock prices. On top of that, we have a potential buyback effect amounting to about 5% of index market cap to further raise the upside. If nothing goes wrong, it is easy to make a case that stock prices rise by 20% or more.
By contrast, the bear case consists a mainly of series of possible negative shocks, such as rising geopolitical risk, that raise the risk premium and depress the P/E multiple. There is no way to quantify how much the P/E multiple compresses in a bearish scenario, as much depends on the nature of the bearish trigger.
Here is how I would approach the equity market as 2017 unfolds. Historically, the seasonal pattern remains bullish until just after Inauguration Day. Until then, the market is focused on the positive effects of the Trump tax cuts. Stay bullish until then.
As the new Trump team takes over, risks will start to appear and the market is likely to experience some downside volatility. Right now, we have no idea of what the bearish trigger might be, so don’t ask me what the downside target is.
As the year progresses, I will be monitoring the precarious balance of the bull case of cyclical growth, tax cuts, and offshore cash repatriation tax holidays, against the bear case of mainly political and geopolitical risk of the Trump administration. In addition, I will be watching how recession risk develops (see Going on recession watch, but don’t panic!).
Under these circumstances, a blend of both fundamental and technical analysis is useful for guiding where stock prices are likely to go. From a fundamental and intermediate term perspective, as long as the global cyclical upturn remains intact, my inner investor is inclined to give the bull case the benefit of the doubt. At a tactical level, technical and sentiment analysis will be more useful for determining short-term peaks, bottoms, and other turning points.
The week ahead
Looking to the week ahead, the jury is out on market direction (see Santa Claus rally, or round number-itis). On one hand, next week is one of the most seasonally positive weeks for equities, and for small caps in particular.
On the other hand, Helene Meisler observed that a Bradley date, which is an estimate cyclical turning point in a market (not necessarily equities), occurs next week on December 28. In addition, Alex Rosenberg, writing at CNBC, pointed out that there may be a natural huhe man tendency for traders to book a gain as the stock market has had a good year. The selling from the “book a gain” behavior would serve to counteract next week’s positive seasonal effects.
Finally, Ryan Detrick at LPL Research found that the success of the Santa Claus may be a window into the market’s January returns. Simply put, weak Santa Claus rallies tend to see weak January returns:
We’d put it like this; not all red Januaries have had a weak Santa Claus Rally during this period, but all weak Santa Claus Rallies have led to a red January. Over the past 20 years, stock market performance during the Santa Claus Rally has been negative five times and the following January was also red all five of those times.
Barring significant market developments, my plan is to start to lighten up on my long equity positions as Inauguration Day approaches. If I were to buy back into the market after a post-inauguration correction, my preference would be to own a buy-write index. The long position in the underlying index provides capital gains upside, and the probable higher level of market volatility will provide juicy premiums from call option writing.
Mid-week market update: As the Dow approaches the magic 20,000 mark, the question for traders is: Will Santa Claus be coming to town this year, or will the market advance stall as it catches “round number-itis”?
Here is what I am watching.
Risk appetite
Risk appetite metrics are mixed. Fixed income risk appetite, as measured by junk bond performance (top panel), remains in an uptrend with a series of higher highs and lower lows. On the other hand, the relative performance of small caps (middle panel) and high beta vs. low volatility (bottom panel) have not achieved new highs, though they have not turned down to form a negative divergence. Score this indicator as positive to neutral.
Seasonality
I am much indebted to Callum Thomas for his analysis that showed that the stock market is tracking its bullish seasonal pattern. If history is any guide, the market will see a final price thrust into year-end.
For another perspective on seasonality, Jeff Hirsch observed that the DJIA has historically risen 66.7% of the time between option expiration (last Friday) and the December year end for an average gain of 0.83%. The corresponding statistics for SPX are 61.9% success rate and 0.84% gain; for NASDAQ 66.7% success rate and 0.86% gain; and 81.0% success rate and 1.82% gain.
Another weird and innovative indicator, the “Euphoriameter” attempts to capture the level of euphoria (or otherwise) in the market. It looks at forward PE ratios (higher = more euphoric), the VIX (lower = more euphoric), and bullish sentiment (self explanatory!). The VIX and bullish sentiment measures are 12-month smoothed to give a clearer signal and capture the key trends over the longer term. The main point is that it’s starting to surge after a dive down last year, but is not quite at levels of euphoria that would be considered irrational exuberance as such.
Bullish sentiment is rising within a positive momentum backdrop, but readings are not at a crowded long yet. There is more room for stocks to run.
The message from gold
As confirmation of my equity bullish outlook, here is another from an intermarket, or cross-asset, perspective. Gold has been one of the asset classes that has shown an inverse correlation with stocks. I have written in the past that gold and gold stocks did not appear to be ready to rally (see Too early to buy gold and gold stocks), which would be a signal of likely equity weakness. Sentiment analysis from Mark Hulbert confirms this view, Hulbert observed that gold timers have been turning bullish in the face of bullion weakness. In short, gold bulls have yet to throw in the towel on bullion, which is contrarian gold bearish and therefore equity bullish.
VIX Index
Finally, the market has been experiencing a momentum surge that has been accompanied by a series of “good overbought” RSI readings. One cautionary signal that these advances may stall occurs when the VIX Index falls below its lower Bollinger Band. While that hasn’t happened yet, this is something I am monitoring closely.
When I put it all together, I have to give the bull case the benefit of the doubt for now. My inner investor remains bullish on equities. My inner trader is cautiously positioned for a year-end rally with long positions in SPX and RUT.
Preface: Explaining our market timing models
We maintain several market timing models, each with differing time horizons. The “Ultimate Market Timing Model” is a long-term market timing model based on the research outlined in our post, Building the ultimate market timing model. This model tends to generate only a handful of signals each decade.
The Trend Model is an asset allocation model which applies trend following principles based on the inputs of global stock and commodity price. This model has a shorter time horizon and tends to turn over about 4-6 times a year. In essence, it seeks to answer the question, “Is the trend in the global economy expansion (bullish) or contraction (bearish)?”
My inner trader uses the trading component of the Trend Model to look for changes in direction of the main Trend Model signal. A bullish Trend Model signal that gets less bullish is a trading “sell” signal. Conversely, a bearish Trend Model signal that gets less bearish is a trading “buy” signal. The history of actual out-of-sample (not backtested) signals of the trading model are shown by the arrows in the chart below. Past trading of the trading model has shown turnover rates of about 200% per month.
The latest signals of each model are as follows:
Ultimate market timing model: Buy equities
Trend Model signal: Risk-on
Trading model: Bullish
Update schedule: I generally update model readings on my site on weekends and tweet mid-week observations at @humblestudent. Subscribers will also receive email notices of any changes in my trading portfolio.
Trumponomics: The bull case
It’s nearing year-end and prognostication season. Rather than just gaze into my crystal ball and make a forecast for 2017, I will write a two-part series on the likely effects of the new president on the stock market. This week, I focus on the bull case.
Since the recent upside breakout, point and figure charting is pointing to a SPX upside target of 2523, which represents a gain of 11.7% from Friday`s close. I show how that figure is easily achievable under the Trump proposals – and more.
Earnings, earnings, earnings!
The bull case for stocks rests mainly on earnings growth. There are three components of earnings growth that investors should focus on:
Organic growth, in the absence of Trumponomics
Tax cut effects
One-time offshore cash repatriation effects
If we start with organic EPS growth, the November 4 pre-election bottom-up Street estimates from Factset showed a forecast of $119.47 for FY2016 SPX and $113.68 for FY2017, which comes to an earnings growth rate of 11.8%. The latest Factset consensus estimates in the post-Trump era also shows an identical EPS growth of 11.8%, which indicates that company analysts have not incorporated the unknown effects of Trump’s fiscal proposals into their earnings estimates.
However, I would caution that these EPS growth estimates need to be taken with a grain of salt. Ed Yardeni showed that bottom-up derived Street EPS forecasts tend to start high and fall. That`s why I focus on the evolution of forward 12-month EPS, which is more stable.
So let`s be conservative and cut that growth figure by somewhere between one-third and one-half. We arrive at an organic EPS growth rate of about 6-8%.
On top of that, we can add the tax cut effect of the Trump fiscal proposals. Bloomberg recently summarized the tax cut earnings effect of different Street strategists. The growth projections vary, but come to about 10%:
Deutsche: $10 (8.4% EPS growth), based on a tax cut to a rate of 25%
JPM: $15 (12.6% growth), based on a 15% tax rate
Citi $12 (9.3% growth), based on a 20% tax rate (via CNBC)
Add the 10% tax cut effect to the organic EPS 6-8% growth rate, we get to a 2017 EPS growth rate of 15-18%. In the absence of changes in P/E multiples, the SPX could therefore rise 15-18%, in line with earnings growth. That gives us a 2017 year-end projection in the 2600-2650 range, which is above the point and figure chart target of 2523.
That’s not all, Brian Gilmartin recently took a stab at estimating the offshore cash repatriation effect:
Yesterday, 12/6/16, at the CFA Chicago luncheon, Dan Clifton of Strategas Partners gave a great presentation on the coming fiscal stimulus and what it might look like and what it might mean for the US economy in 2017.
The inevitable question about cash repatriation came up and Dan gave a lengthy and thoughtful response, but he eventually got down to the numbers: Dan thought that as much as $1 trillion could be brought back to the US as repatriated cash, and granted investors will hear the standard hue-and-cry about using the repatriated cash to repurchase stock, Clifton thought that $300 – $400 billion of the repatriated cash could be spent directly on buybacks.
Looking at the numbers:
The current market cap of the SP 500 is roughly $19 trillion, so roughly 5% of the SP 500 market cap could be repatriated;
In terms of the “index divisor” (per Thomson Reuters data) there are 8.6386 billion shares used in the SP 500 EPS calculation.
Using Clifton’s numbers, if $300 – $400 billion of the $1 trillion is used directly on shares repurchases, then roughly 1.5%, 2%, 2.5% of the SP 500’s market cap could be repurchased JUST from overseas cash repatriation in 2017.
This obviously doesn’t include any cash generated from a reduction in effective tax rates, faster revenue growth or cash generated normally from operations, resulting in free-cash-flow.
Let`s summarize the results. Start with a 15-18% increase in stock prices, which assumes no changes in P/E multiples. Add to that an estimated buyback demand amounting to roughly 5% of total market cap, you have the bull case for stocks. As Brian Gilmartin put it:
In year-end meetings with clients, I’m telling clients from both sides of the aisle that the SP 500 could be up 20% next year. Prior to the election and since last Spring ’16, the SP 500 was already looking at its best year of expected earnings growth in 5 years. The proposed President-elect and Congressional fiscal policy could be another level of earnings growth above what was already built into the numbers, before November 8th.
Any way you slice it, the upside potential for US equities in 2017 easily comes in at 15-20%.
The big money stampede
While the fundamental outlook appears to be positive, no equity rally is sustainable without the participation of the big money institutions. The latest BAML Fund Manager Survey shows that the institutional risk appetite is rising in a big way.
They believe that global growth is returning. Growth expectations have spiked significantly in the last few months.
As a consequence, earnings expectations have also risen dramatically too.
In response to this newly upbeat assessment, institutions are taking more risk with their portfolios. Readings are rising, but nowhere near crowded long levels.
They are buying equities.
US equity exposure is rising, but they are not over-owned.
Similarly, the AAII sentiment survey of individual investors can hardly be described as being all-in on stocks.
In summary, sentiment models show that investors are piling into risky assets, but the stampede is just in its early stages. There is still time to jump on the bandwagon.
Valuation not excessive
What about valuation? Stock prices appear to be highly overvalued on CAPE, but Michael Batnick pointed out that the CAPE is a terrible metric for short-term market timing: “Over the past 25 years, the CAPE ratio has been above its historical average 95% of the time. Stocks have been below their historical average just 16 out of the last 309 months. Since that time, the total return on the SP 500 is over 925%”.
By contrast, the Morningstar fair value estimate shows that stock prices are mildly overvalued by 4%, but that’s not excessive compared to its own history.
I would be far more worried if insiders were consistently selling in an overvalued market. The latest update from Barron’s of insider activity shows that insider activity at a neutral level, despite the proximity of all-time highs in stock prices.
The week ahead: Will Santa show up?
Looking to the week ahead, the Santa Claus rally may be just getting ready to get rolling. Now that the equity market has successfully navigated the hawkish FOMC rate hike, the seasonal pattern is highly favorable. Rob Hanna at Quantifiable Edges observed that stock prices tend to rise and continue rising starting December option expiry (OpEx) week, which began last Monday.
In addition, the electoral pattern shows that stock prices tend to have an upward bias and peaks out just after Inauguration Day.
My inner investor remains bullish on stocks. My inner trader is positioning himself for the seasonal rally. Subscribers received an email notice last Thursday indicating that my inner trader had added to his long equity exposure with a purchase of small cap stocks.
Unless something earth shattering happens in the markets next week, postings will be light or nonexistent as I take a week off during the holidays. The next scheduled update will be on Monday, December 26 when I outline my Trumponomics bear case for stocks, and how I resolve the bull and bear scenarios.
In my post written last weekend (see Watch the reaction, not just the Fed), I suggested that the key to future stock market trajectory was not just the FOMC statement, but the reaction to the statement and subsequent press conference:
What happens to the dot plot?
How will the market react to the Fed’s message? Will the current market expectations of about two more rate hikes in 2017 change?
How will Donald Trump react to the likely quarter-point rate hike?
I had expected a stand pat Summary of Economic Projections (SEP), otherwise known as the “dot plot”. Instead, the FOMC shaded up the dot plot, which suggests that 2017 will see three quarter point rate hikes instead of two (chart via Business Insider).
The market reaction was understandably negative. Stock prices fell. Rates rose across the board, but the 2/10 yield curve steepened, which indicated market expectations of better growth.
Here is my perspective on the new dot plot and subsequent market reaction.
Bernanke on the “dot plot”
Former Fed chair Ben Bernanke recently wrote about how to use the “dot plot”, or SEP. Here is how not to use the SEP.
It is not a policy commitment by the FOMC
It is not an unconditional economic forecast
More revealing was his comment that investors should think of the SEP as a straw poll:
The FOMC is not a simple democracy but a consensus-driven organization, with the agenda set by the chair. Only twelve of nineteen participants have a vote at each meeting. Consequently, it is not straightforward to infer FOMC policy by looking at the median SEP projection of rates or other variables, without benefit of other information. Still, in conjunction with speeches and other public comments, the SEP does provide timely quantitative information about the range of views on the committee and how the thinking of participants is evolving. I think of the SEP as a straw vote, a reflection of the range of sentiment going into the full committee debate.
Does the SEP straw vote predict actual FOMC decisions? Interest-rate projections in particular are still a relatively recent innovation, so the data seem insufficient at this point to give a clear answer to that question. The SEP released after the September FOMC meeting showed a strong majority of committee participants (all but three) expecting another rate increase this year, and an increase does seem likely for December. On the other hand, recently, SEP rate projections over longer horizons have been too optimistic about the ability of the economy to sustain rate increases (for example, as of a year ago many participants saw four rate increases in 2016). As discussed further below, however, I believe that discrepancy is explained by systematic changes in participants’ outlooks in light of new economic information, not by the failure of the SEP to capture the range of views at a particular moment in time.
In other words, the dot plot represents individual FOMC members’ views of interest rate projections given all of each person’s view of how the economy is likely to develop. So what are we to make of the new development where the “dot plot” now expects three 2017 rate hikes instead of two?
From the market’s perspective, the combination of rising yields and a steepening yield curve indicates that bond market continues to focus on higher growth expectations. The steepening yield curve is directly contradictory to the reflex sell-off in stock prices. If the bond market’s verdict is to be believed, then this development should be interpreted as equity bullish.
What about Trump?
The one missing ingredient to the FOMC announcement was the reaction from PEOTUS Donald Trump. On one hand, the change in the “dot plot” from two 2017 rate hikes at the pre-election September meeting to three rate hikes could be seen as a challenge to the incoming president’s agenda. Not only did the Fed raise rates in December, it went on to signal a faster pace of rate normalization in 2017.
On the other hand, if Trump were to appoint any of his hard-money supporters to the two open positions to the Federal Reserve board, they are likely to be more hawkish than the current FOMC. Potential board members from the “audit the Fed” and hard-money school are likely to support a rule-based approach to monetary policy, such as the use of the Taylor Rule to set interest rates. I indicated in my weekend post (see Watch the reaction, not just the Fed) that my Taylor Rule estimate puts the target Fed Funds rate at 2.8%, which is significantly above the even raised Fed Funds target.
Further analysis by Holger Zschaepitz of Die Welt using his Bloomberg terminal showed that the Taylor Rule target is even higher at 4%: Everything else being equal, the adoption of an equilibrium Fed Funds rate of between 2.8% and 4.0% is likely to accelerate the pace of rate hikes, which would largely negate the pro-growth effects of Trump’s fiscal policy stimulus.
So we are left waiting for the next shoe to drop. What will Trump say? Will he go on Twitter and criticize the Fed for adopting a more hawkish outlook, or will he acquiesce to hard-money supporters and prefer an even aggressive pace of monetary tightening?
Further to my last post (see Watch the reaction, not just the Fed), I got a number of questions that asked if there are any factors or nuances from the FOMC statement or subsequent press conference to watch for.
Firstly, I reiterate my point that the reaction to the Fed is far more important to the future direction of stock prices than the Fed statement itself. I expect that the Fed will try very hard to remain apolitical and refuse to react to any possible changes in fiscal policy until they are actually announced. Nevertheless, I will be watching if the committee makes any references to:
The strength of the US Dollar; and
Any possible changes in the projected path of inflation.
How the Fed views these factors will influence affect the pace of interest rate normalization in 2017.
What about the USD?
A rising currency has a natural deflationary effect, because imports become cheaper, which puts downward pressure on inflation. The recent bout of USD strength has a similar effect of tightening monetary policy.
If the FOMC statement makes a reference to the strength in the greenback, interpret it as dovish.
Wither inflation?
The chart below shows the number of instances in a trailing 12-month window when the annualized monthly increase in core PCE exceeds the Fed’s inflation target of 2%. In the past, the Fed has embarked on a tightening cycle when the number of instances has reached 6. The current reading is 5, which is close, but not yet.
How the Fed views the development of inflation develops will be a critical input in the future path of monetary policy. Here, the picture is mixed. As the chart below shows, market based inflationary expectations metrics have been rising, but survey based data has remained steady.
Higher inflationary expectations will put more pressure on the Fed to have a hawkish tilt, while steady inflationary expectations can give the Fed cover to remain dovish and adopt a wait and see attitude.
Preface: Explaining our market timing models
We maintain several market timing models, each with differing time horizons. The “Ultimate Market Timing Model” is a long-term market timing model based on the research outlined in our post, Building the ultimate market timing model. This model tends to generate only a handful of signals each decade.
The Trend Model is an asset allocation model which applies trend following principles based on the inputs of global stock and commodity price. This model has a shorter time horizon and tends to turn over about 4-6 times a year. In essence, it seeks to answer the question, “Is the trend in the global economy expansion (bullish) or contraction (bearish)?”
My inner trader uses the trading component of the Trend Model to look for changes in direction of the main Trend Model signal. A bullish Trend Model signal that gets less bullish is a trading “sell” signal. Conversely, a bearish Trend Model signal that gets less bearish is a trading “buy” signal. The history of actual out-of-sample (not backtested) signals of the trading model are shown by the arrows in the chart below. Past trading of the trading model has shown turnover rates of about 200% per month.
The latest signals of each model are as follows:
Ultimate market timing model: Buy equities
Trend Model signal: Risk-on
Trading model: Bullish
Update schedule: I generally update model readings on my site on weekends and tweet mid-week observations at @humblestudent. Subscribers will also receive email notices of any changes in my trading portfolio.
All eyes on the Fed
As market activity starts to wind down for the holiday season, the major event next week will be the FOMC meeting. The Fed’s policy move has been well telegraphed and a quarter-point rate hike will be a foregone conclusion. Bond yields have been rising, and so have inflationary expectations, but that’s not a surprise. Sometimes the best part of watching a play where you already know the plot is to watch the audience`s reaction.
Even as bond prices got clobbered, equities have soared. Major US indices achieved new record highs last week. At this rate, the SPX may achieve its point and figure target of over 2500 in the not too distant future.
To stay ahead of the markets, here is what I will be watching next week in the wake of the FOMC announcement:
What happens to the dot plot?
How will the market react to the Fed’s message? Will the current market expectations of about two more rate hikes in 2017 change?
How will Donald Trump react to the likely quarter-point rate hike?
Watch the audience, not just the show.
A well telegraphed rate hike
There are plenty of reasons why the Fed should start a rate hike cycle. The unemployment rate is falling, and the normalized initial claims to population metric is at an all-time low. The combination of these factors is pointing to cost-push inflationary pressure because of rising wages.
Economic conditions today are typical of a late cycle expansion. The combination of rising wages and rising core PCE generally lead to tighter monetary policy. It’s time for the Fed to tap on the brakes.
Global reflation is here
Economic growth is robust again after the mid-cycle slowdown early this year. The good news is that the economic expansion is global in scope. PMIs (Purchasing Managers’ Index) are rising and tell a story of global reflation.
Bloomberg reported that Citigroup’s Economic Surprise Index, which measures whether macro-economic releases are beating or missing expectations, are positive in all of the big regions.
Is the upturn sustainable? Gavyn Davies is hopeful. The improvement in growth is widespread and it’s coming from both EM (emerging markets) and AE (advanced economies):
[T]he main reason for the recent uptick in global growth has stemmed from the EMs, notably from the major easing in fiscal policy in China, and the flattening in deep recessions in Russia and Brazil. The main downside risks to growth prospects in the EMs are a return to tighter credit control in China and an outflow of capital as an aggressive tightening in Fed policy pushes the dollar higher. These risks need to be watched, but do not seem imminent.
In the AEs, fiscal policy is being eased, monetary policy is still accommodative and the manufacturing sector is gaining from firmer corporate investment as the energy shock dissipates. These developments may lead to an upgrade to growth forecasts in the AEs for the first time in many years, provided that a major shock to confidence can be avoided from a shift towards populism in elections in the Eurozone next year.
Overall, we can perhaps be hopeful, though certainly not yet confident, that the global economy will begin to overcome the powerful forces of secular stagnation next year.
Is it any surprise that the Fed is getting ready to raise rates?
Equity market reaction
What about the stock market? Won’t rising interest rates tank stock prices?
Under “normal” circumstances, the initial phase of a rate hike cycle tends to be equity bullish. That’s because the positive effects of better growth expectations overcome the negative effects of higher rates. As this chart from the JPM Asset Management shows (annotations are mine), stock prices tend to be correlated with changes in bond yields when yields are low.
As this chart from Factset shows, the trailing P/E ratio for the market is 20.5, which translates to an earnings yield of 4.9%. Factset also reported that the forward 12-month P/E ratio is 17.1, which corresponds to an earnings yield of 5.8%. I arrive at a ballpark earnings yield estimate of somewhere between 4.9% and 5.8%. That still compares favorably to a 10-year Treasury yield of 2.4%. TINA (There Is No Alternative) is still at play today (for now).
Moreover, earnings growth expectations are still rising. Factset’s analysis shows that forward 12-month EPS has been trending upwards for several months.
What could derail this rally?
Under “normal” circumstances, the market “should” focus on the rising growth outlook and bid up stock prices. But do the words “normal” and “should” apply to today’s market environment?
There are a few factors that could derail a potential stock market rally into 2017. First, the Fed could spook the market with a more aggressive path of rate normalization. New York Fed President William Dudley created some uncertainty in a speech last week. First, he stated that he supports starting a rate hike cycle:
If the economy grows at a pace slightly above its sustainable long-term rate, as I expect, the labor market should gradually tighten further, and the resulting pressure on resources should help push inflation toward our 2 percent objective over the next year or two. Assuming the economy stays on this trajectory, I would favor making monetary policy somewhat less accommodative over time by gradually pushing up the level of short-term interest rates.
But the election of Donald Trump creates “considerable uncertainty” for fiscal and monetary policy:
Obviously, there is still considerable uncertainty about how fiscal policy will evolve over the next few years. At this juncture, it is premature to reach firm conclusions about what will likely occur. As we get greater clarity over the coming year, I will update my assessment of the economic outlook and, with that, my views about the appropriate stance of monetary policy.
Does that mean a more aggressive dot plot? Probably not, but Janet Yellen’s body language in the subsequent press conference might signal a more hawkish tilt, depending on how the FOMC interprets the new administration fiscal policy proposals.
What about The Donald? How will Trump react? Will he tweet and express his displeasure with the FOMC decision? Will he view a rate hike as a personal challenge to his plan to revive the economy and Make America Great Again?
Already, we have sensational headlines from the likes of Zero Hedge. The market will not react well if war erupts between Trump and Yellen.
I am still struggling with a contradiction about Trump’s view of monetary policy. I understand that Trump may like a more dovish interest policy, but much of the criticism of the Fed voiced by ZH and many Trump proxies are contrary to that preference. As an example, CNBC reported that Trump advisor and transition team member Judy Shelton criticized the Fed for undue meddling in the economy:
The Federal Reserve shouldn’t be driving the United States economy because monetary stimulus is quite limited, Trump economic advisor Judy Shelton told CNBC on Wednesday.
“What you want is productive growth and the kind of growth that is truly stimulated by tax reform, by regulatory reform, trade reform and important infrastructure projects to upgrade our ability to be more productive as a nation,” she said in an interview with CNBC’s “Closing Bell.”
Similarly, ZH touted the likes of Jim Grant, David Stockman, Jim Rogers, and Ron Paul for the two open positions of governors on the Federal Reserve Board:
If it is indeed Yellen’s plan to tank the Trump presidency on her way out by raising interest rates, the Donald should fight back. He should take to his best medium, the TV, and begin making the public aware of the sabotage going on. When Yellen abandons her throne, Trump should appoint someone who is concerned about the dollar’s long-term stability. A few choices off the top of my head: finance writer and all-around mensch Jim Grant, former Director of the Office of Management and Budget David Stockman, commodity guru Jim Rogers, or former congressional representative and arch-Fed-critic Ron Paul.
Either would do nicely in turning the Fed from a politically-driven economy-destroying machine into something far less dangerous. And each could do their part in making King Dollar great again.
These potential candidates to the Federal Reserve board, which includes Shelton, all share one characteristic. They all hated the Fed’s quantitative easing programs and easy monetary policy. They would prefer to hold Fed policy to some fixed rule, such as a Taylor Rule, for determining interest rates.
Here is my problem. The chart below shows a projected Taylor Rule rate that assumes a 2% constant real rate and 2% inflation target. The Fed Funds rate be roughly 2.8% today, which would kill any recovery and choke off economic growth. Is this what Trump really wants to Make America Great Again?
Notwithstanding any potential war of words between the Yellen Fed and the incoming Trump administration, Business Insider reported that Deutsche Bank modeled the possible paths of monetary policy in light of Candidate Trump’s fiscal policy proposals.
Depending on how fiscal policy evolves, we could see a heightened pace of rate hikes in the last half of 2017 compared to the current market expectations. Just remember the trader’s adage, three steps and a stumble, where three consecutive rate hikes tend to signal the start of a bear market.
That’s why it’s important to monitor Trump’s reaction to any rate hike.
The week ahead
Looking to the week ahead, there is no shortage of seasonality studies with bullish conclusions. Dana Lyons pointed out that December stock markets tend to tilt bullishly if the VIX Index makes a 3-month low in the first half of the month.
Equity options expire on Friday. Rob Hanna at Quantifiable Edges observed that December OpEx is one of the most bullish OpEx weeks of the year.
However, positive seasonal effects go out the window in light of the possible volatility from next week’s FOMC meeting. As we stand now, the stock market is dramatically overbought as major equity indices have surged to record highs.
This chart from IndexIndicators of stocks above their 10 dma is a short-term (1-3 day time horizon) is flashing warnings of near-term downside risk.
This net 20-day highs-lows is a longer term (1-2 week time horizon) indicator that is also signaling caution for the bulls.
In addition, the CNN Money Fear and Greed Index is also overbought. Its own history shows that its signals can be several weeks early and this is not a precise contrarian indicator.
With those conditions in mind, I believe that any market consolidation or correction next week represents a great opportunity to buy stocks and to get positioned for a year-end rally. The trend in rising risk appetite is a signal of significant FOMO (Fear Of Missing Out) buying momentum.
My inner investor remains bullish on equities. My inner trader took an initial long SPX position. He is enjoying the rally but he is waiting for a pullback to put more money to work on the long side.
Disclosure: Long SPXL
About cookies on this site
Our site uses cookies and other technologies so that we, and our partners, can remember you and tailor your user experience on our site. See our disclaimer page on our privacy policy, how we manage cookies, and how to opt out. Further use of this site will be considered consent.
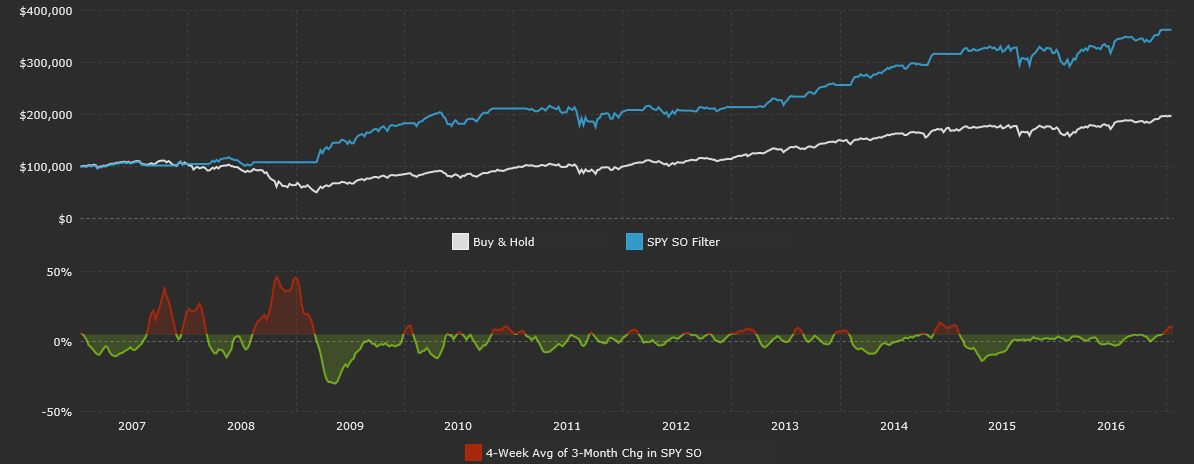


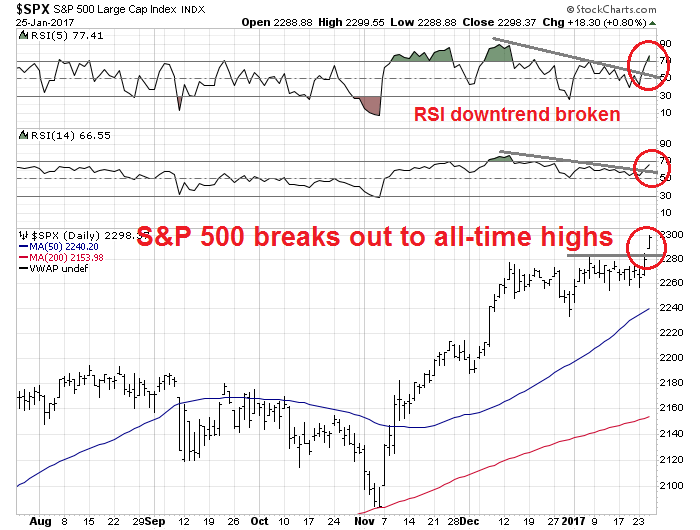


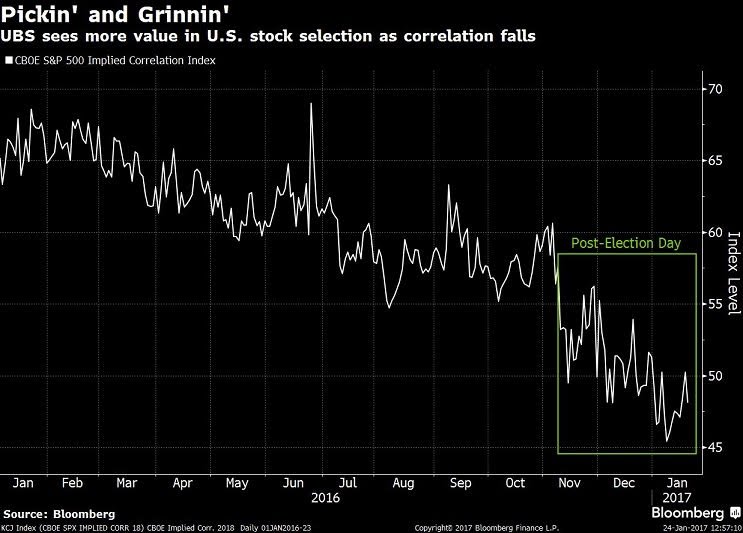

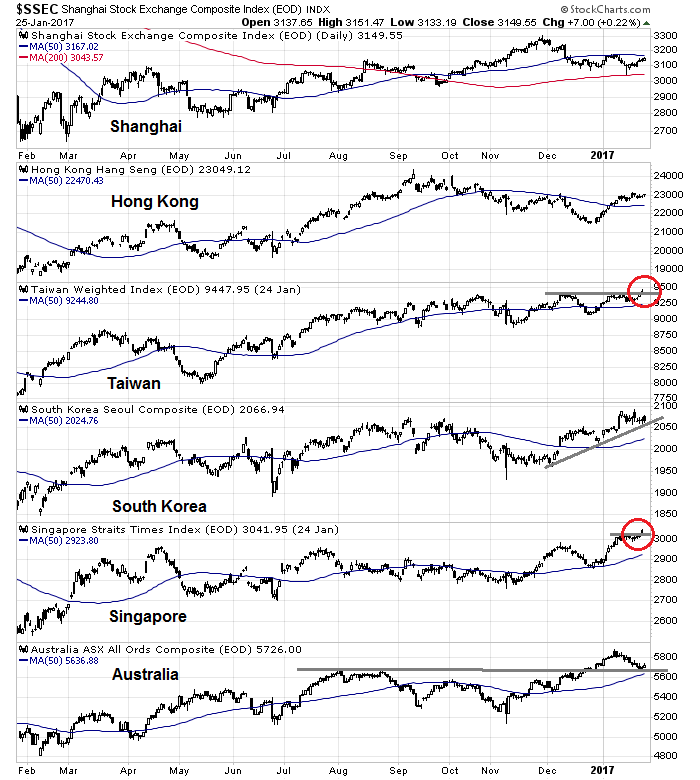
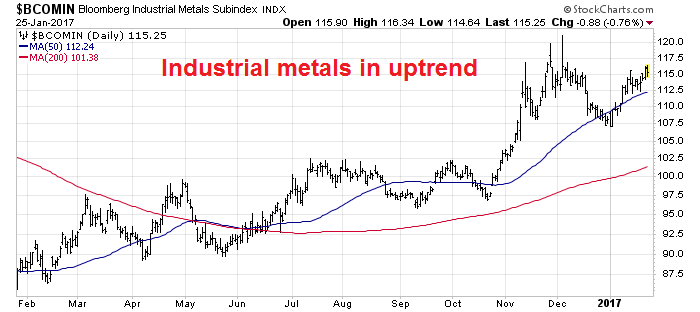
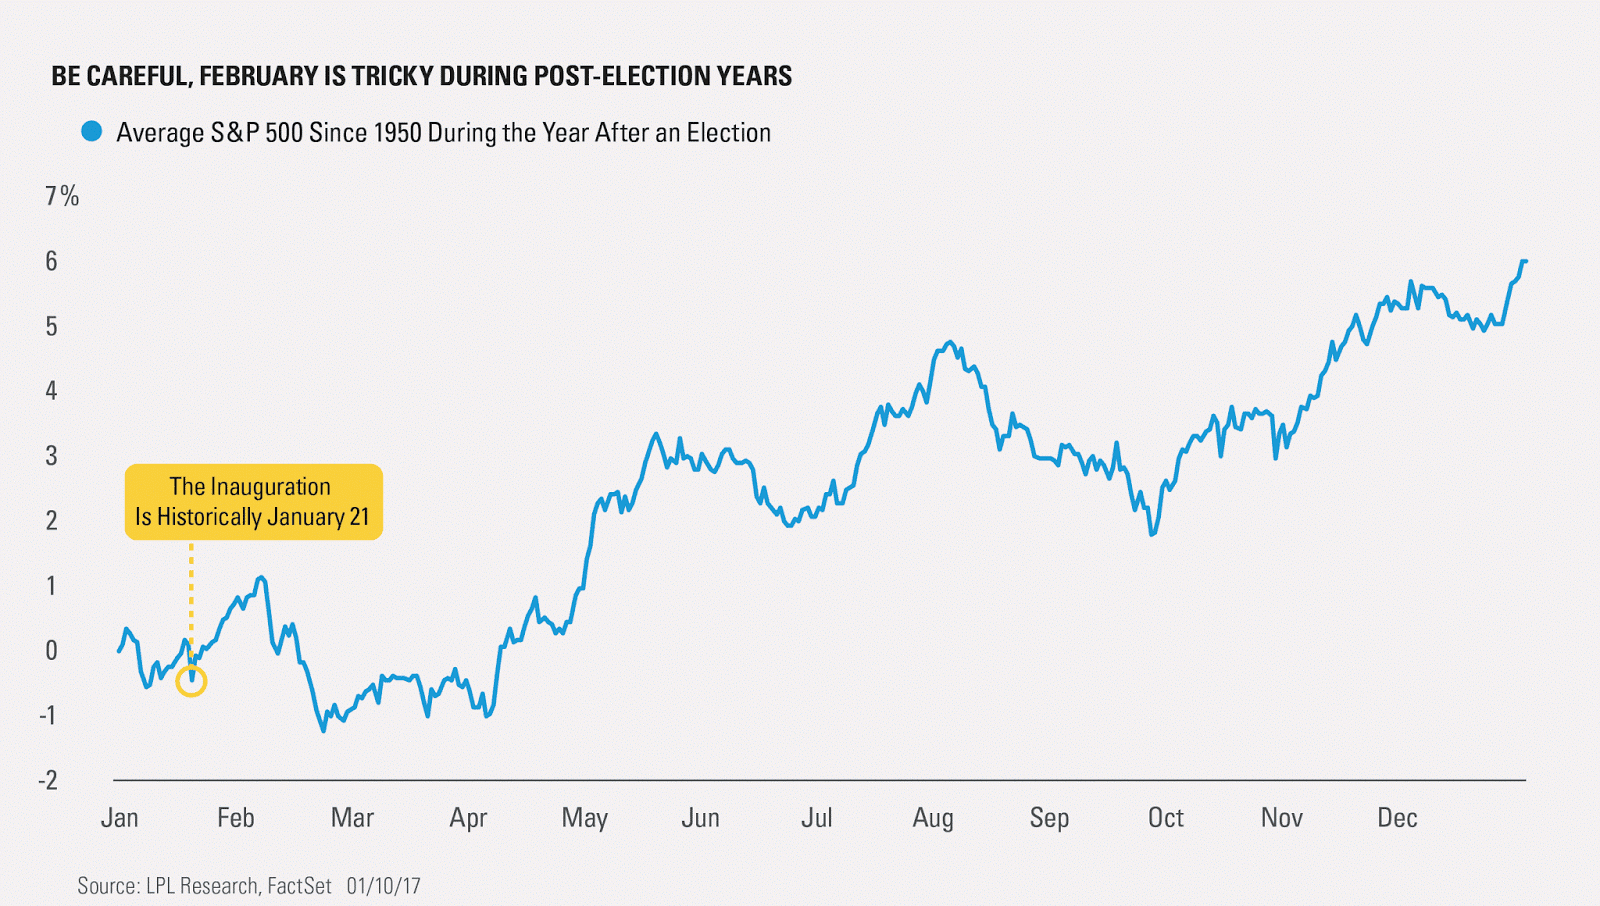
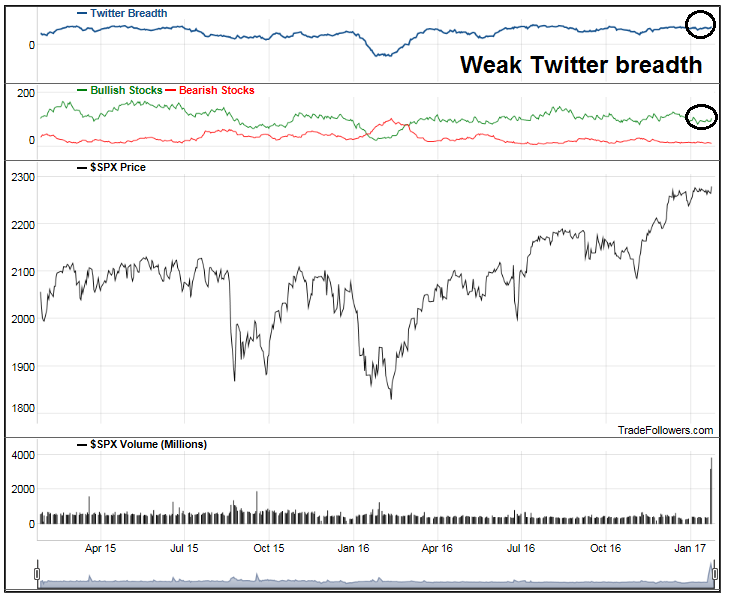
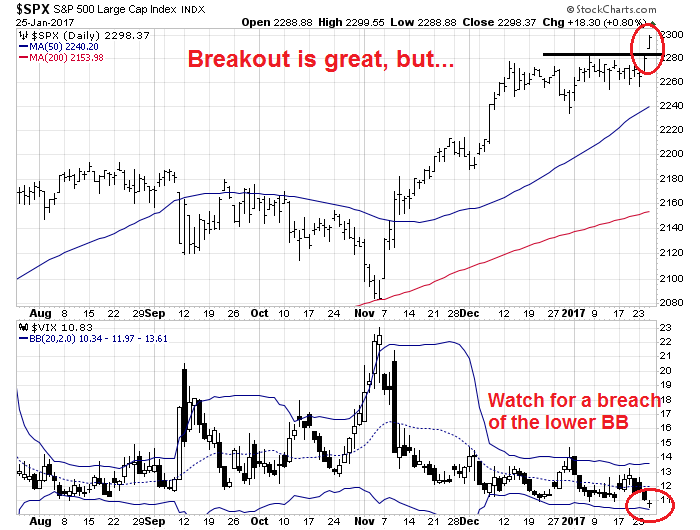
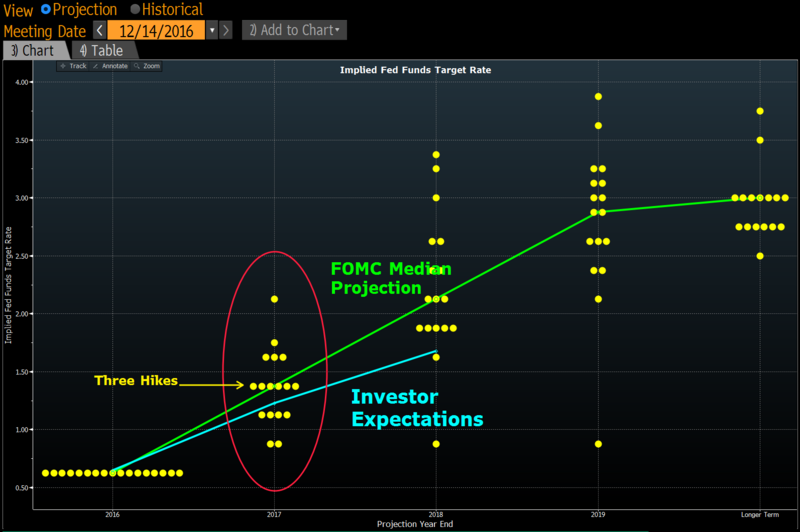
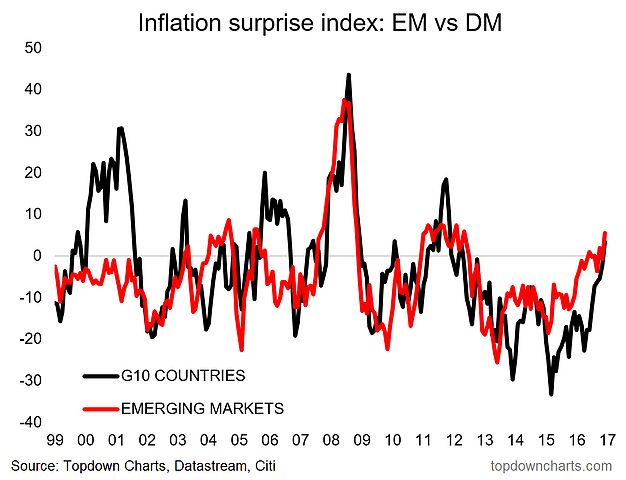
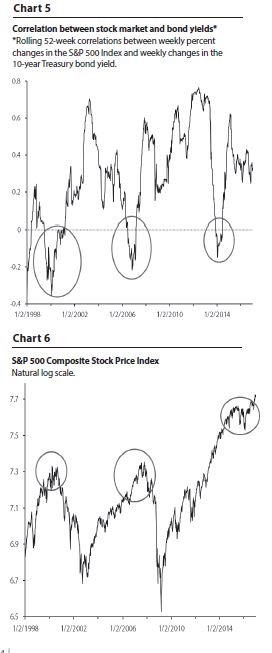


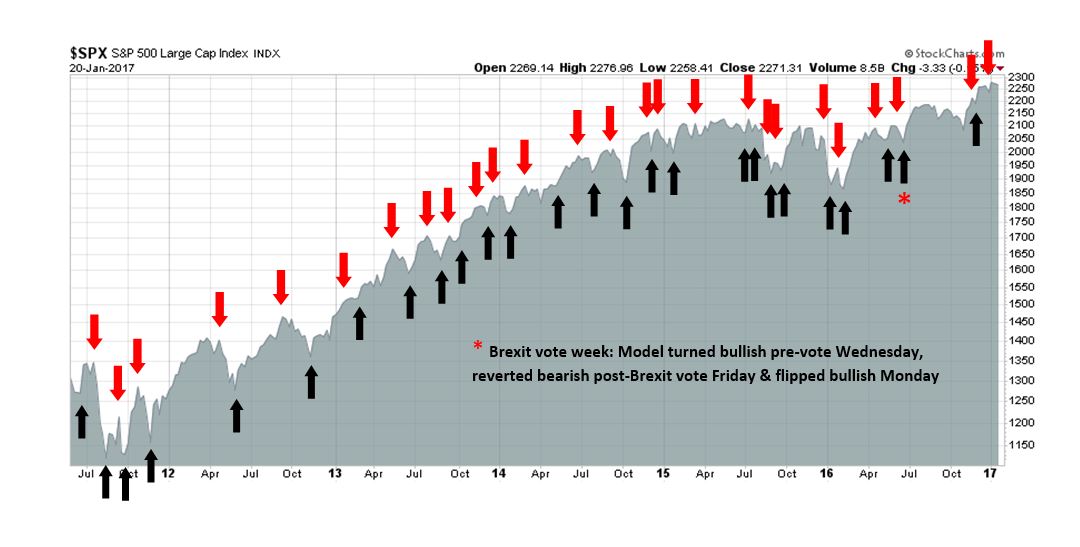


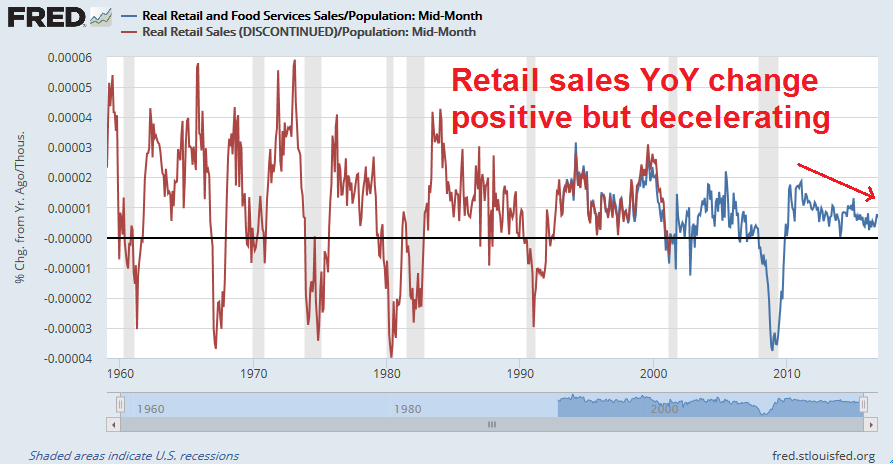


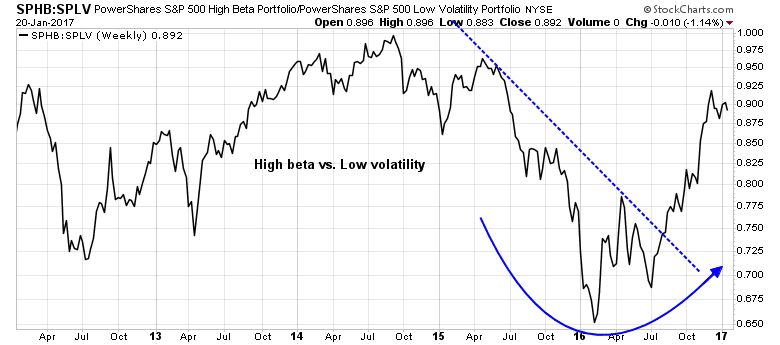
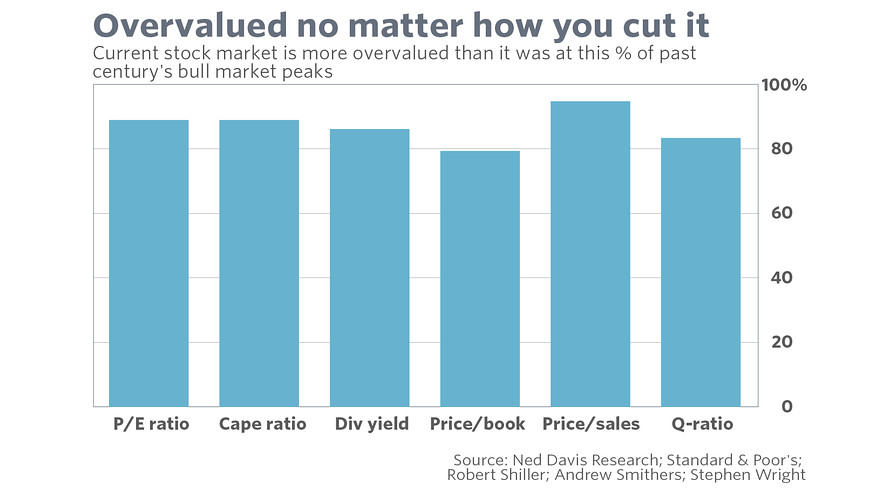

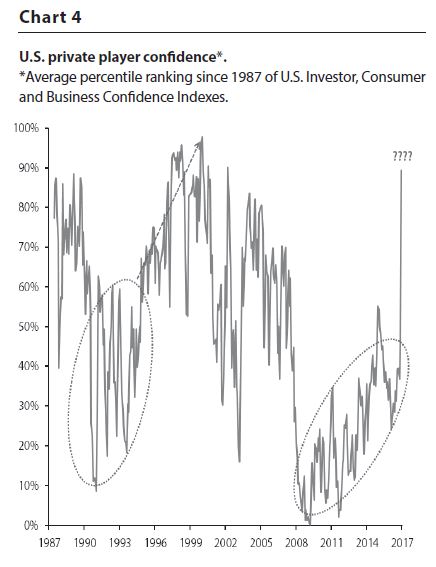


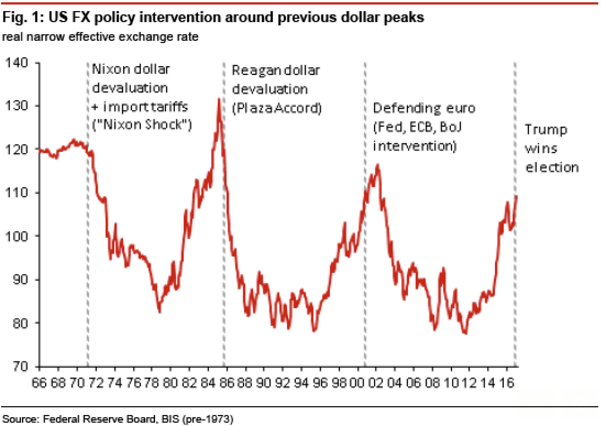


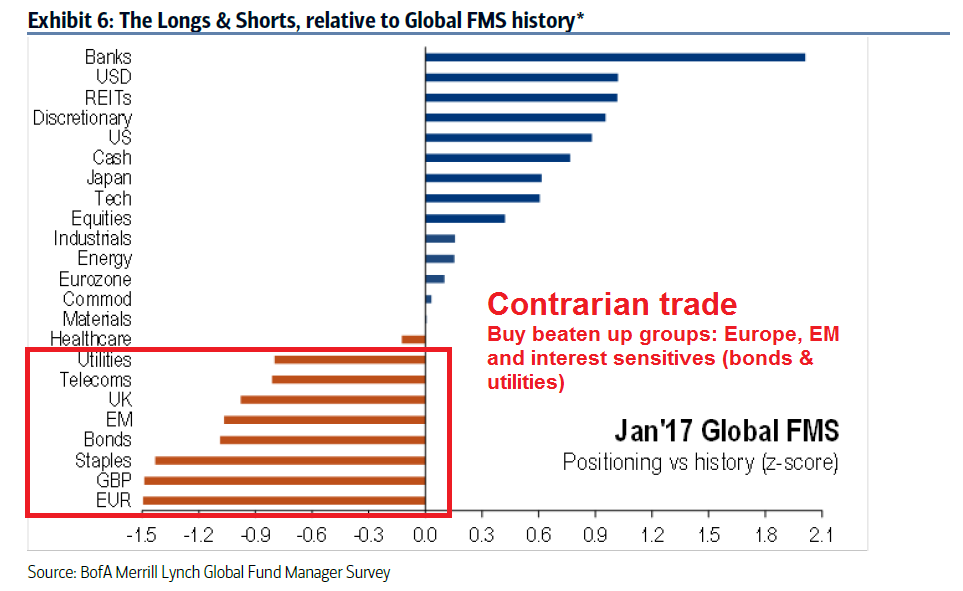
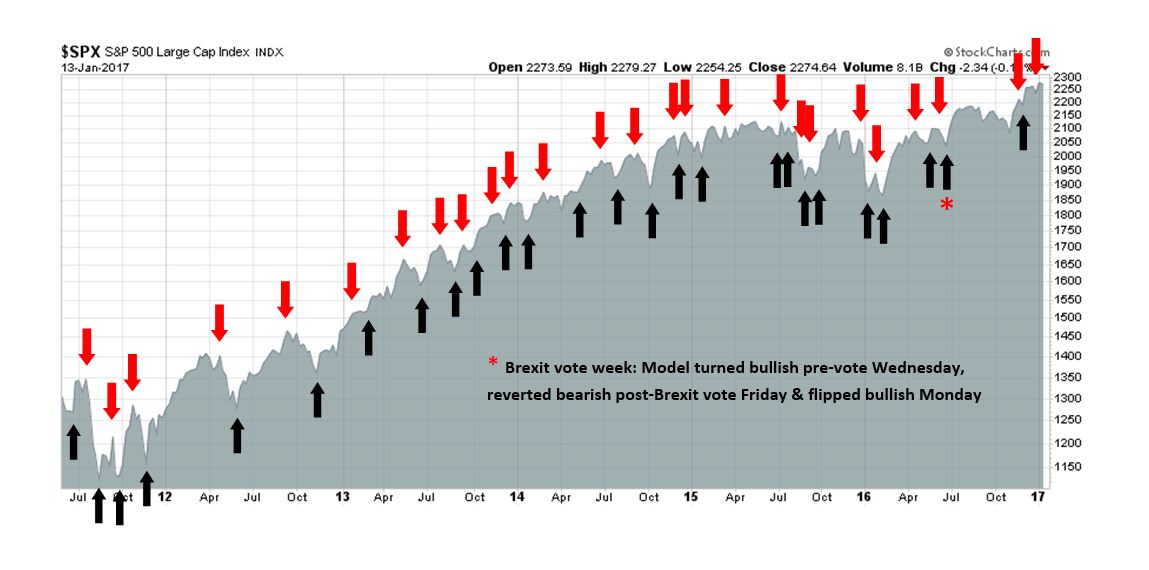
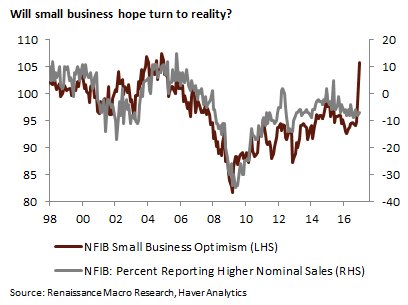
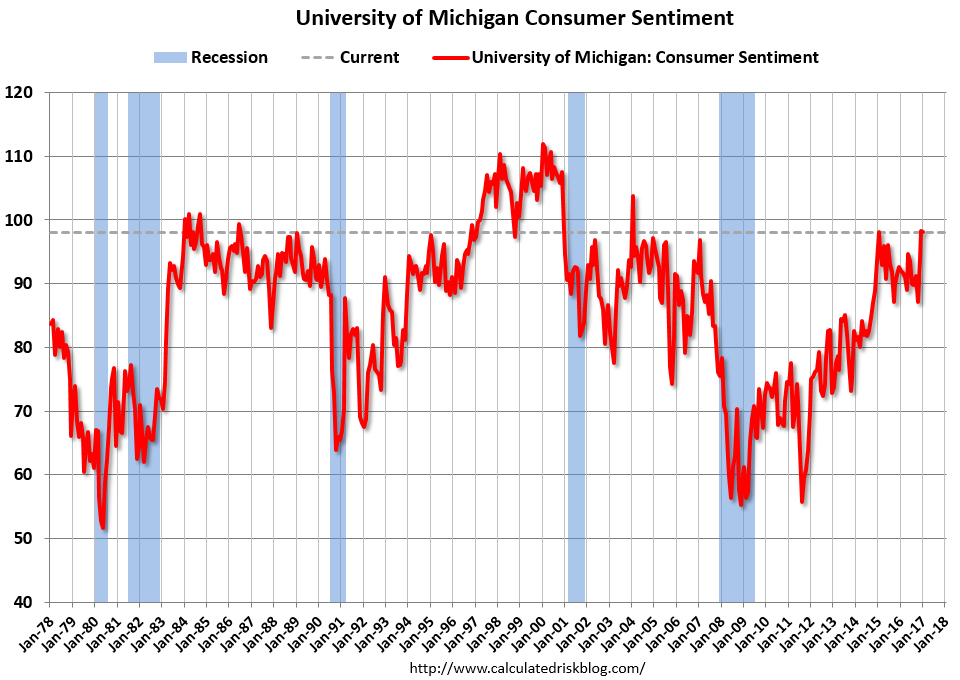

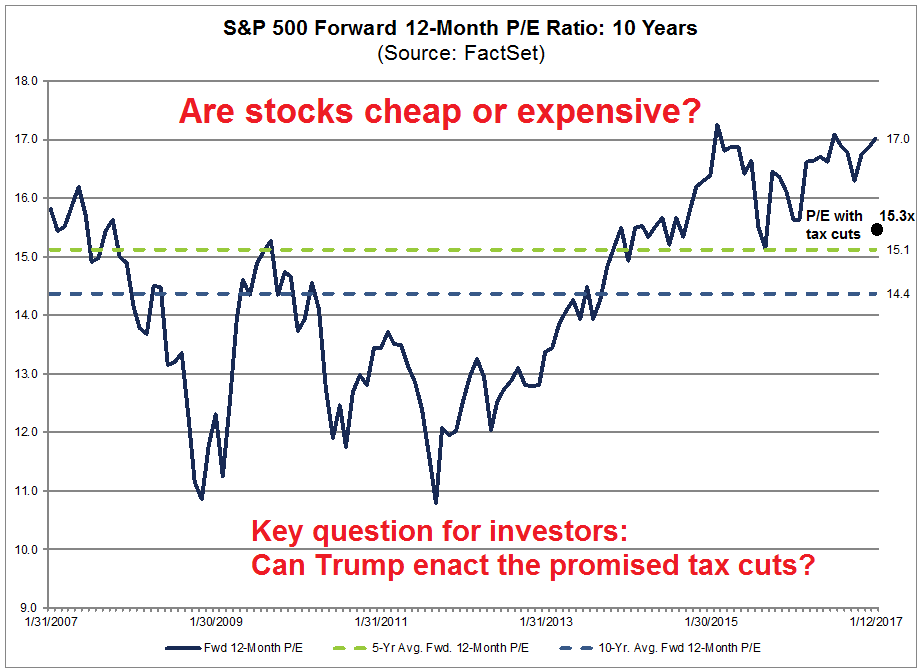

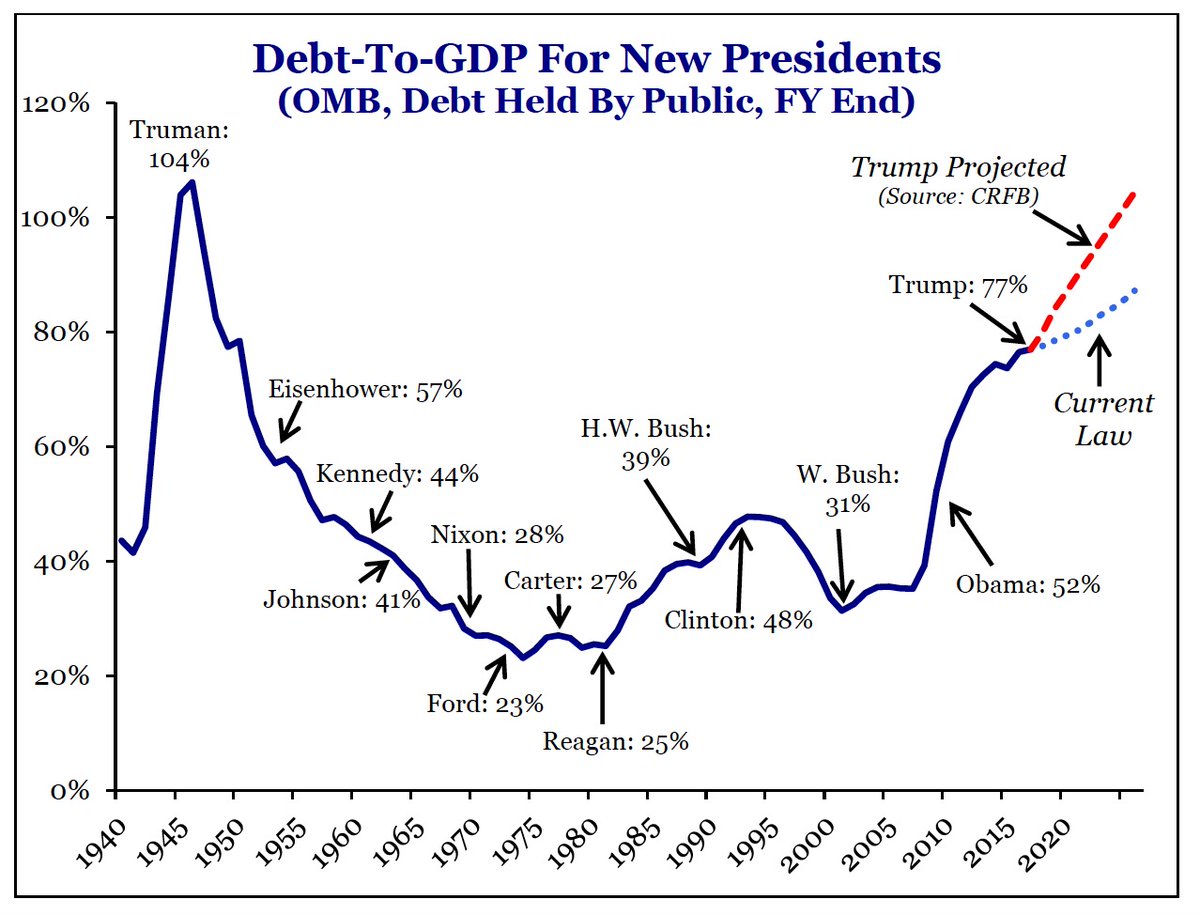
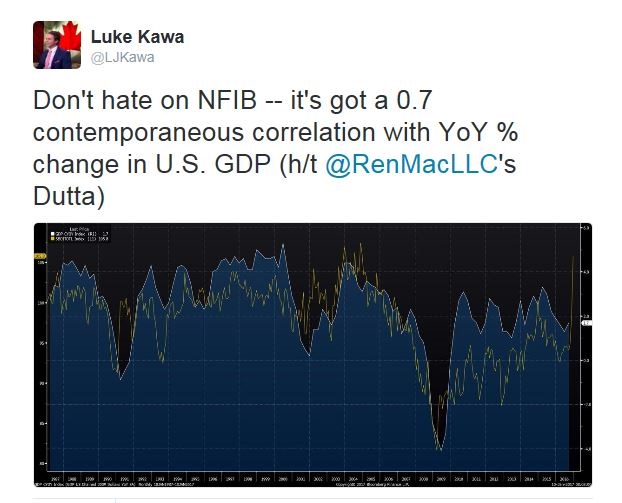
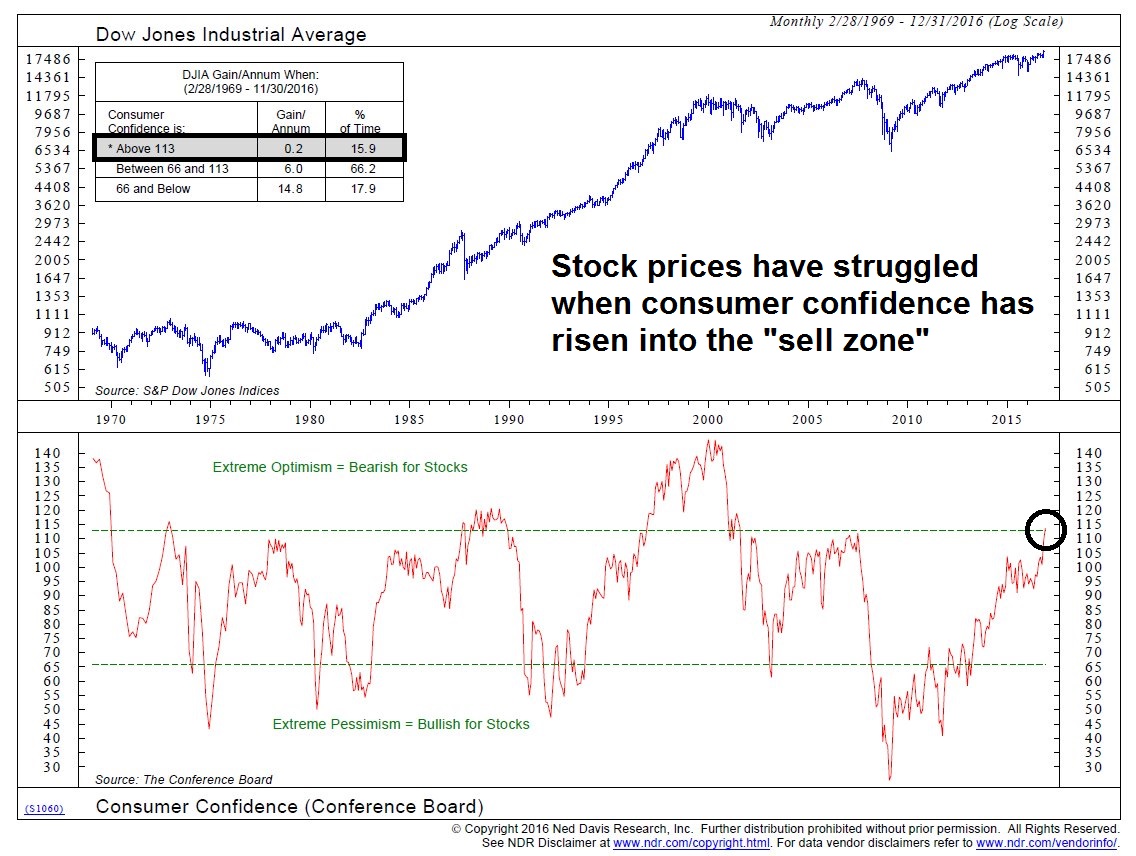


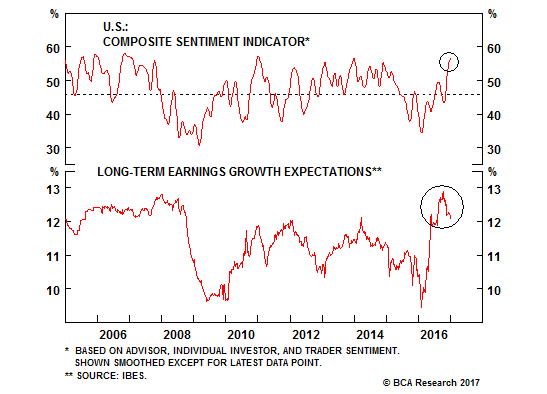
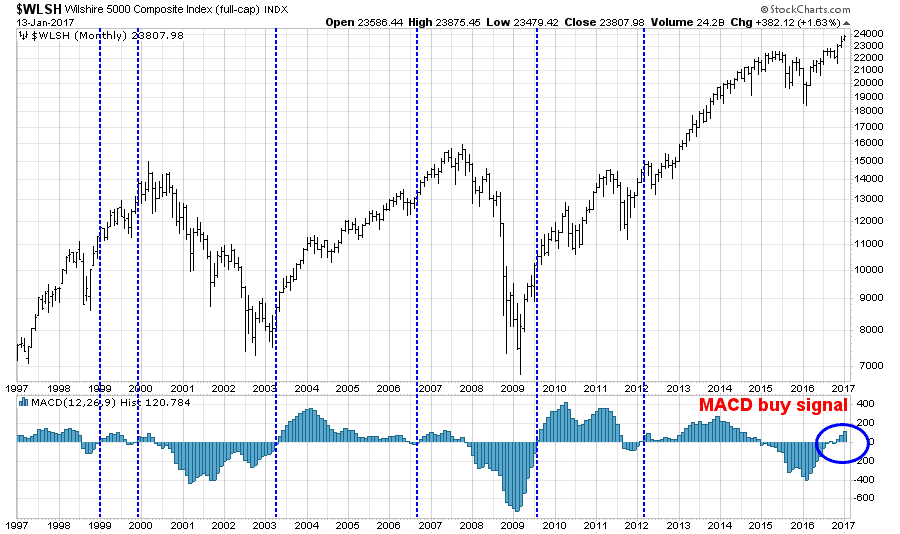
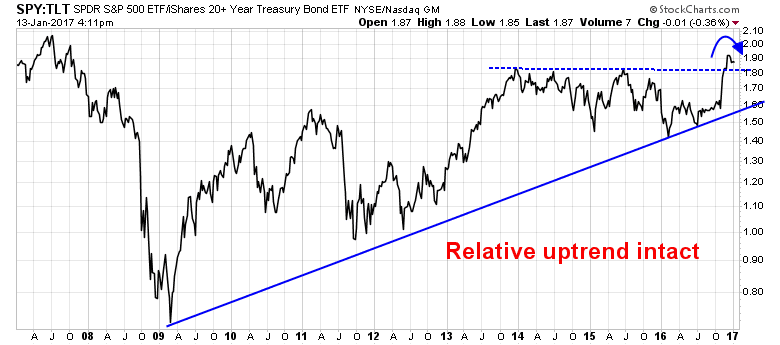
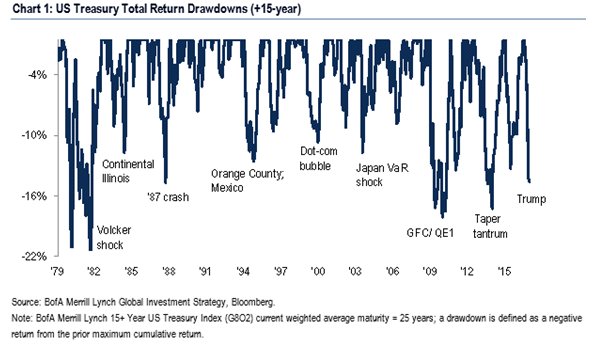
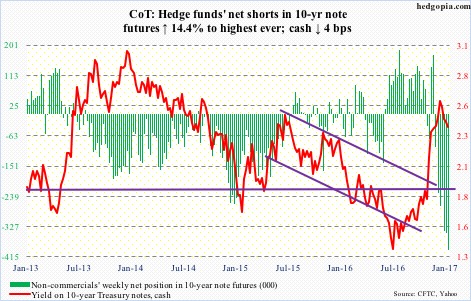

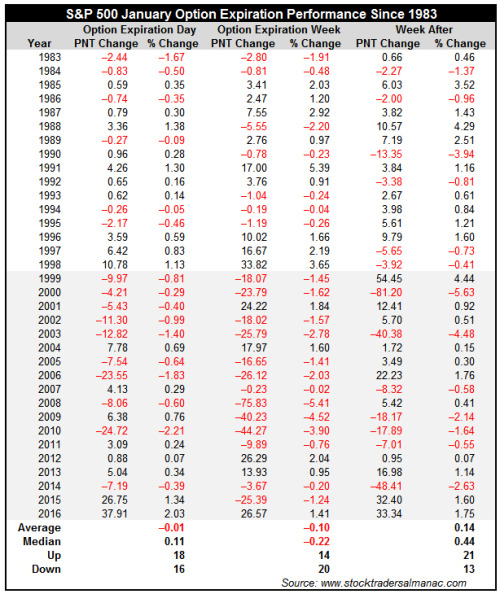
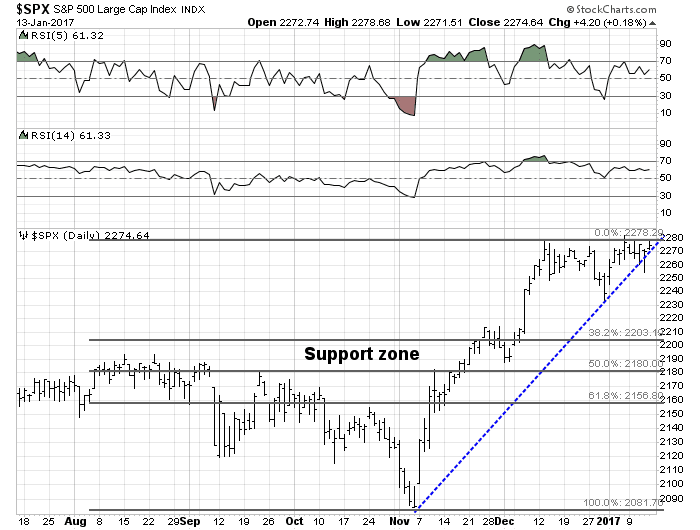
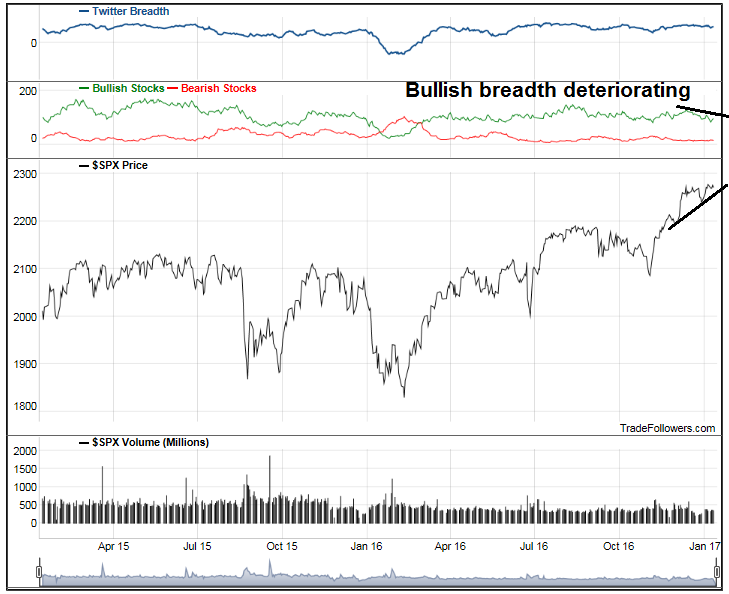


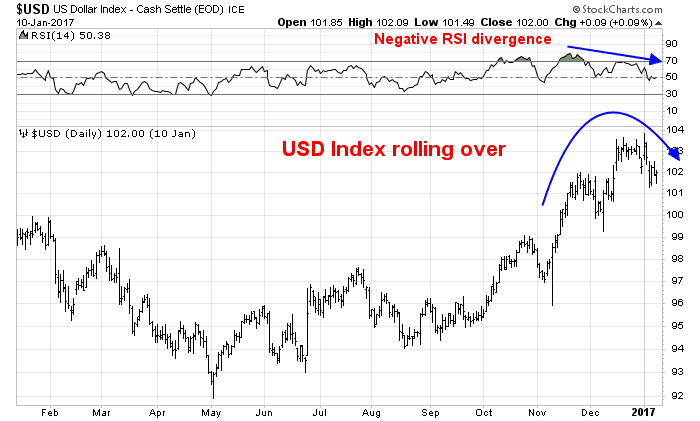
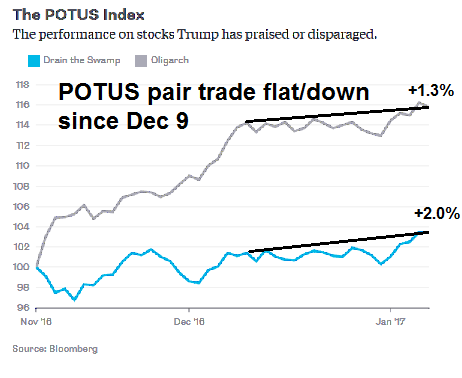


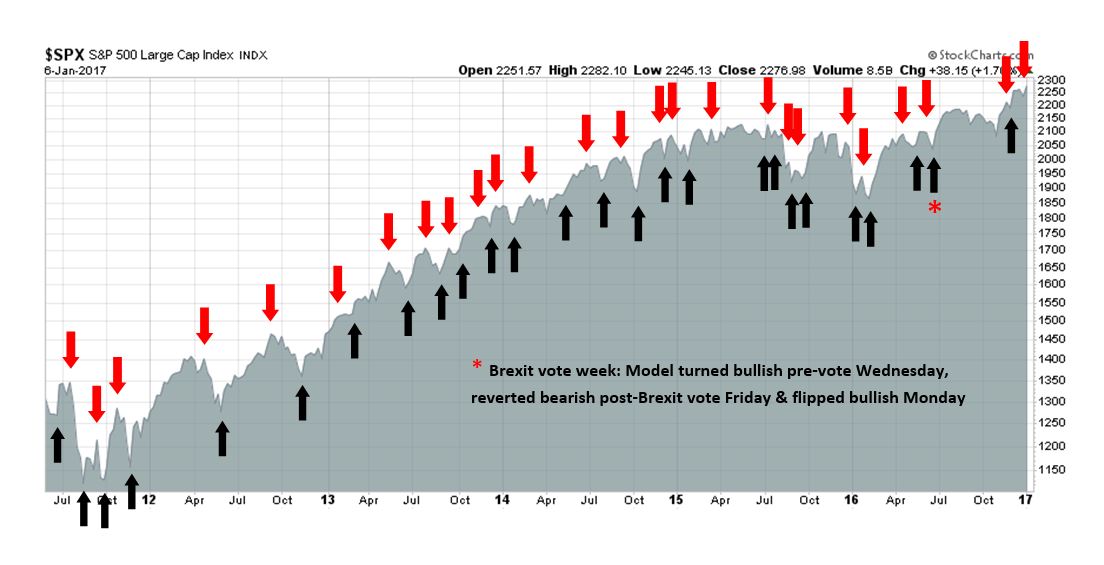
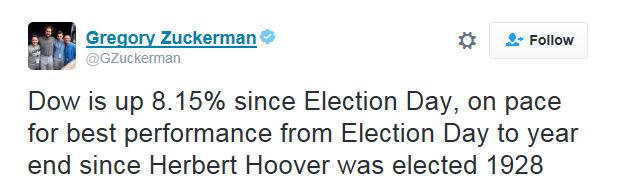
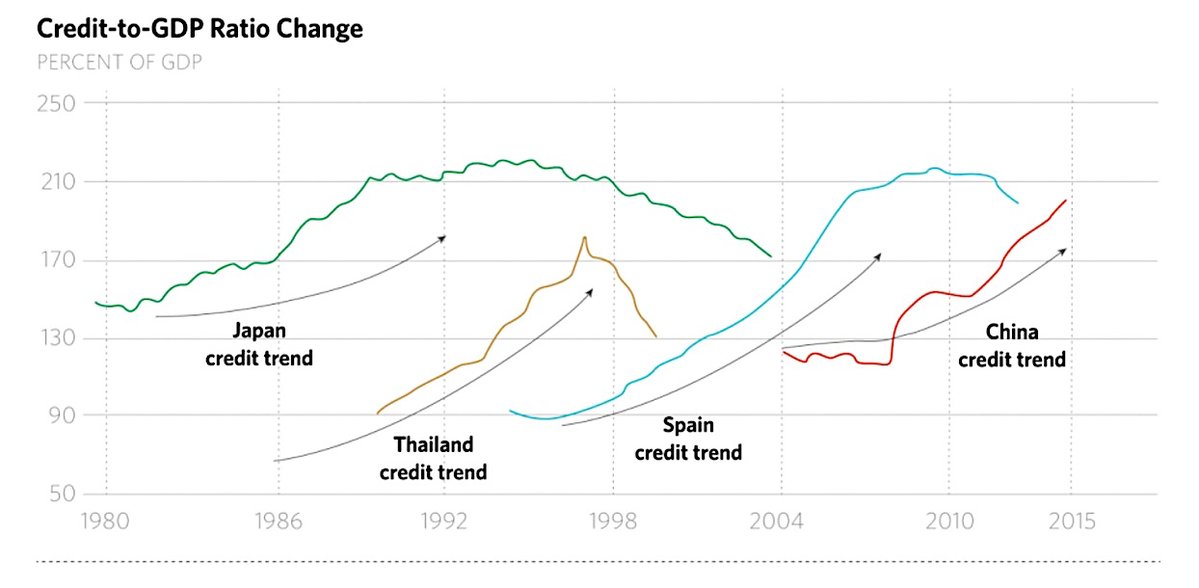
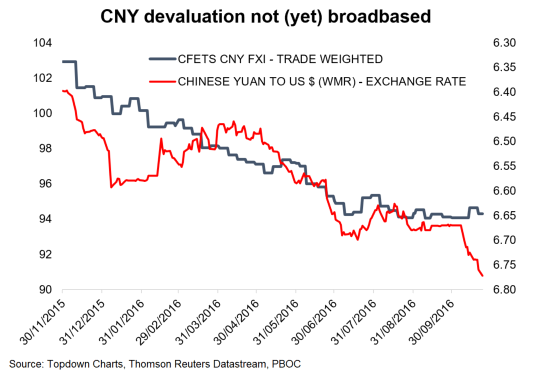

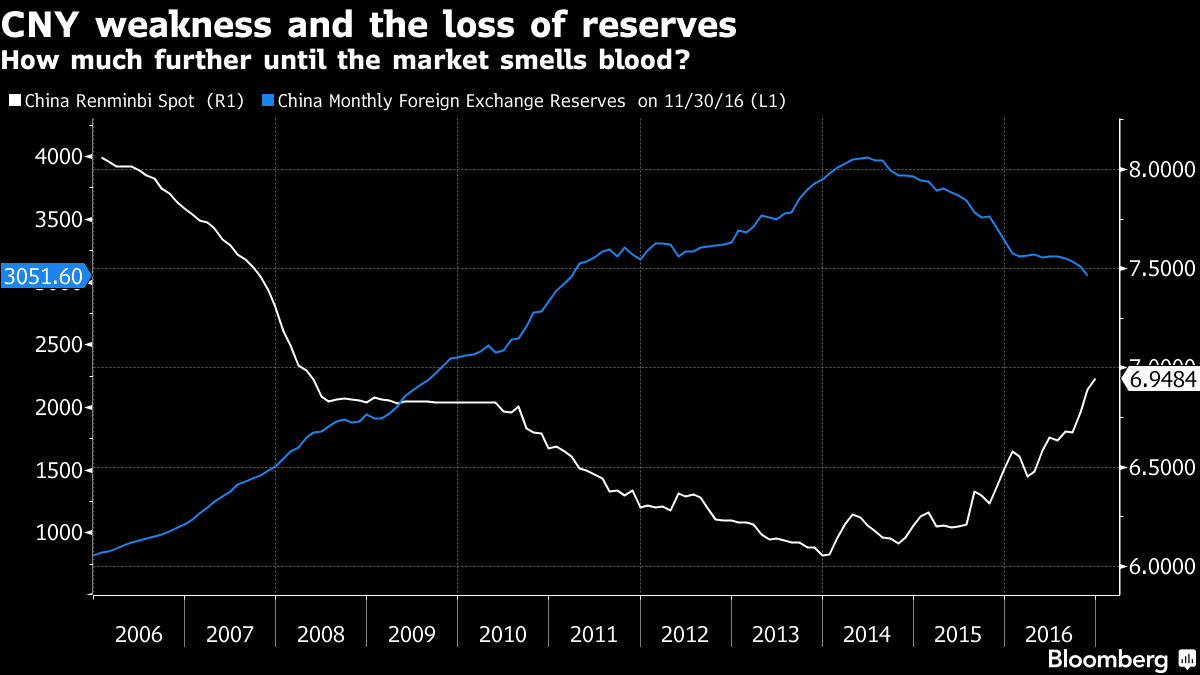
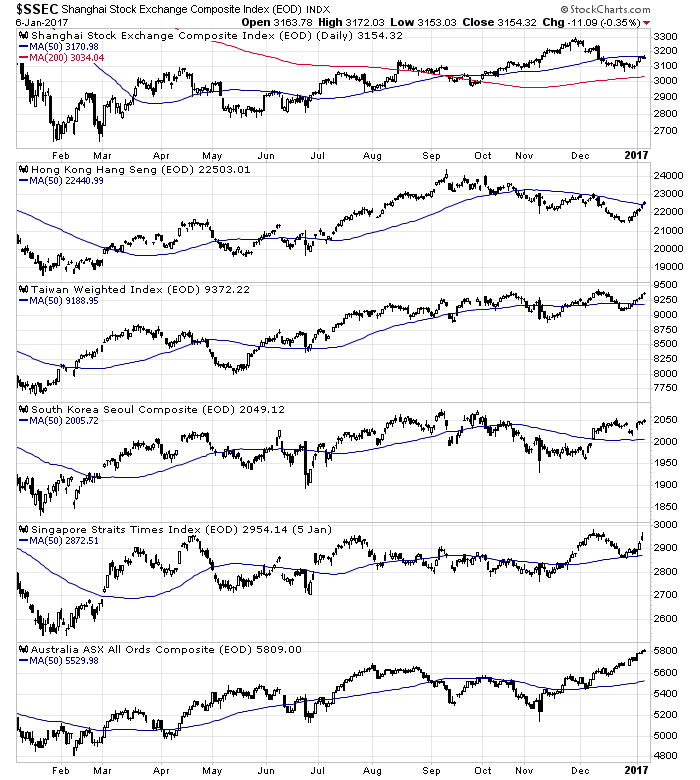
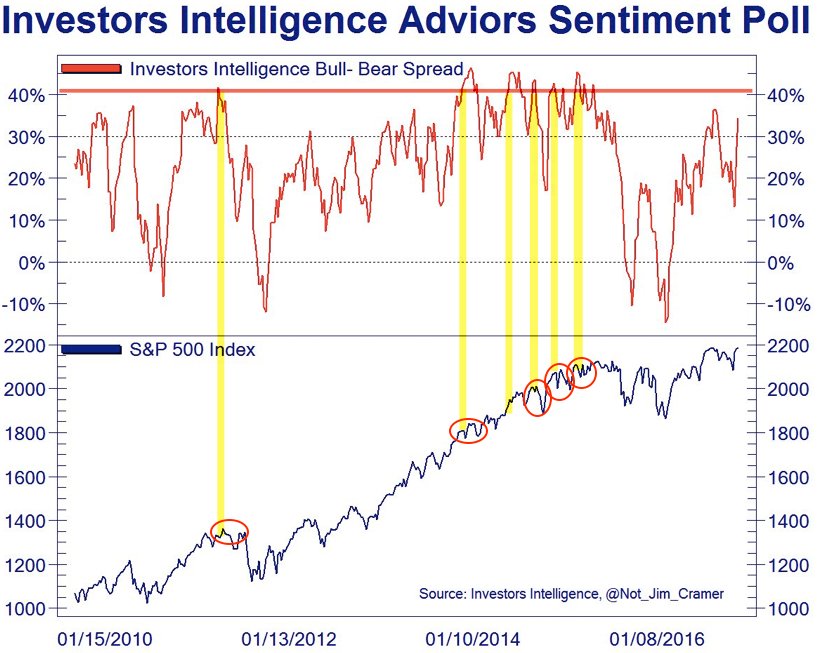
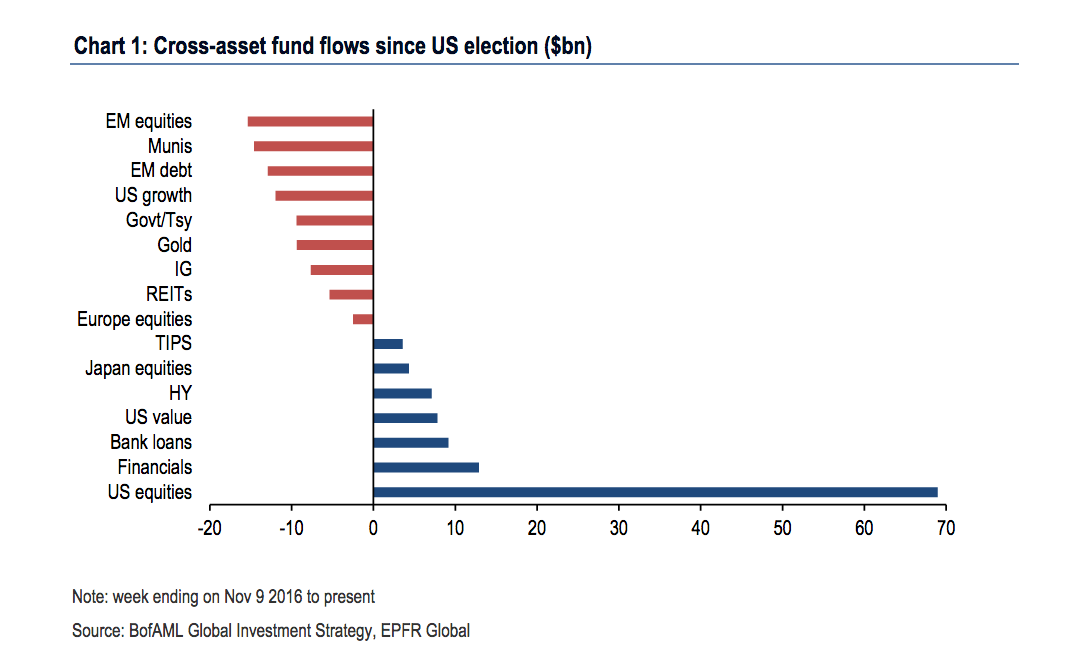
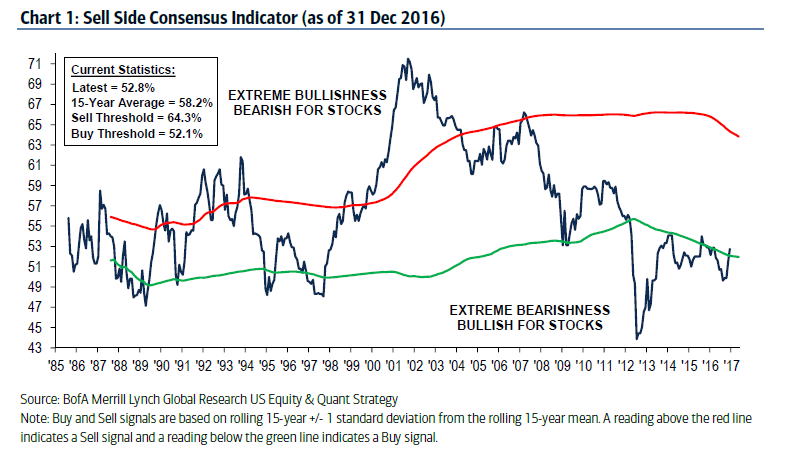
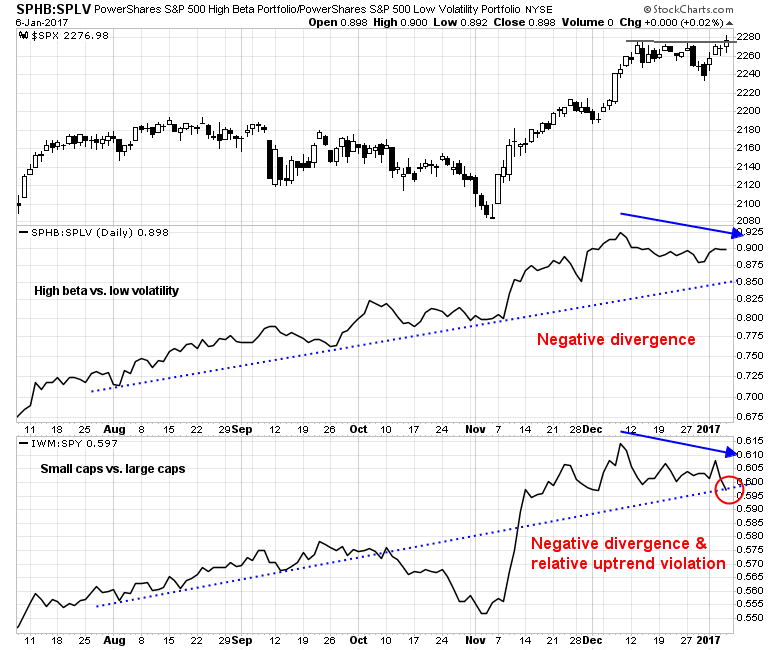
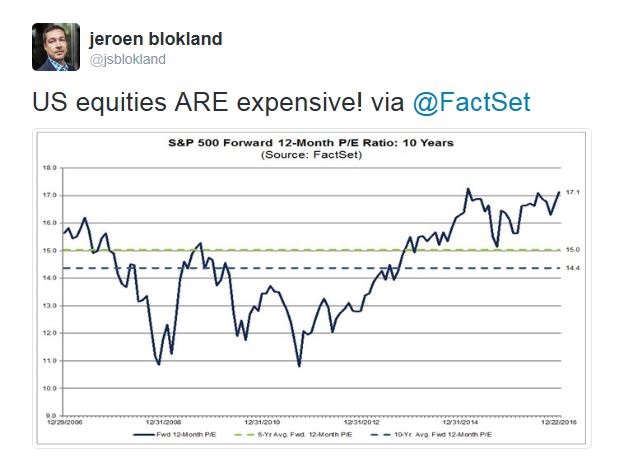
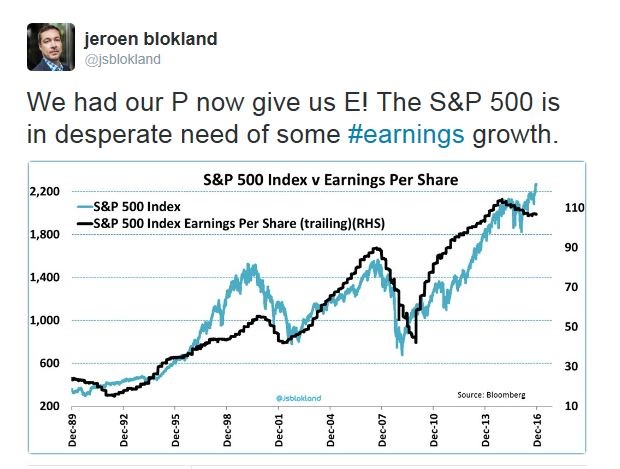
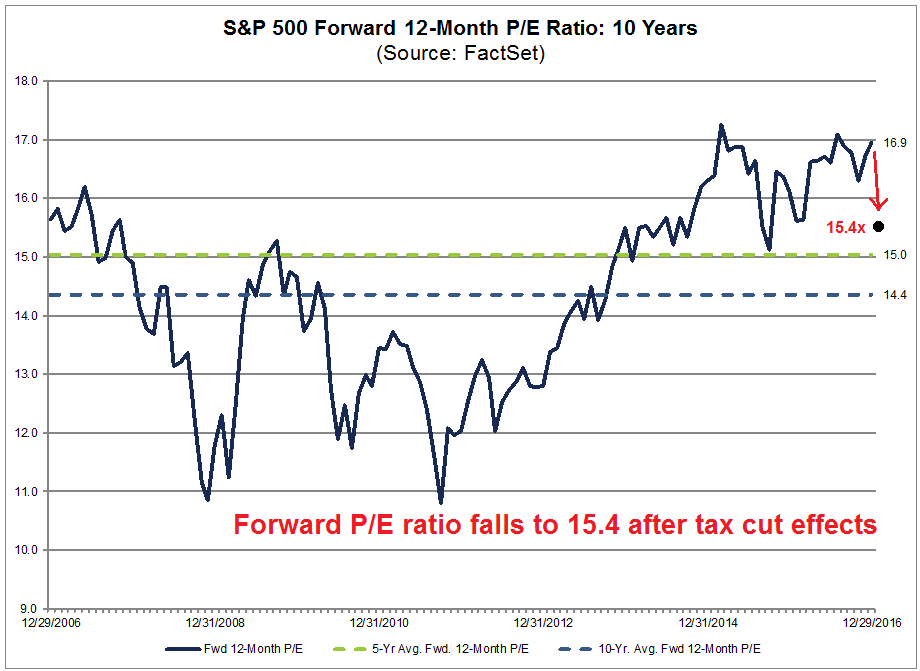
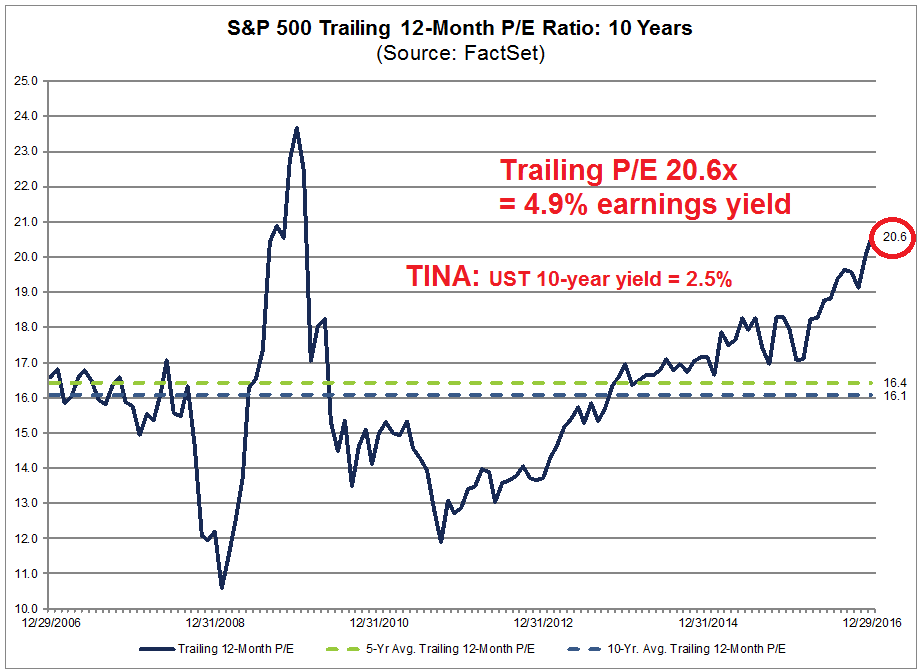
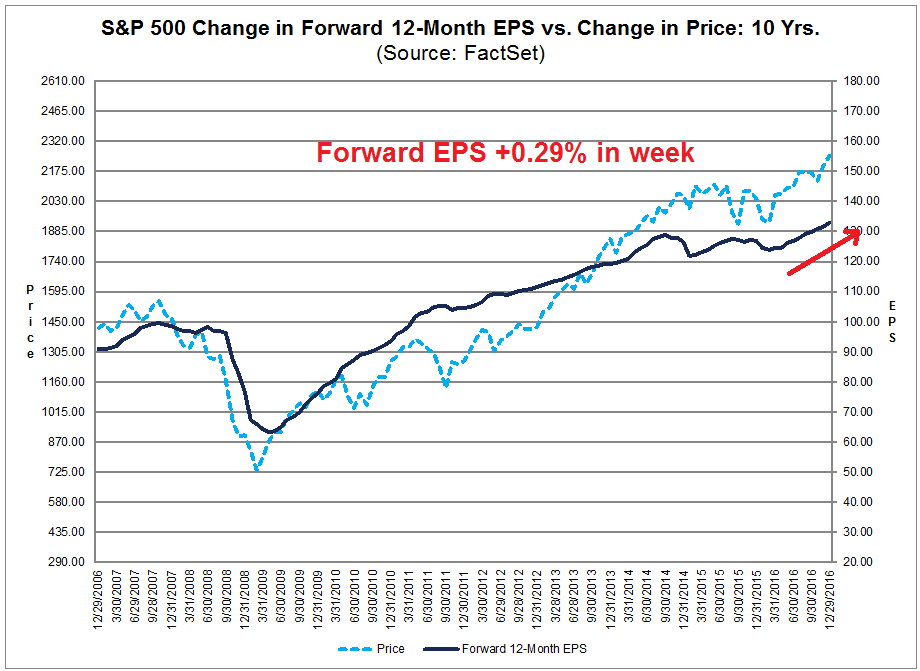

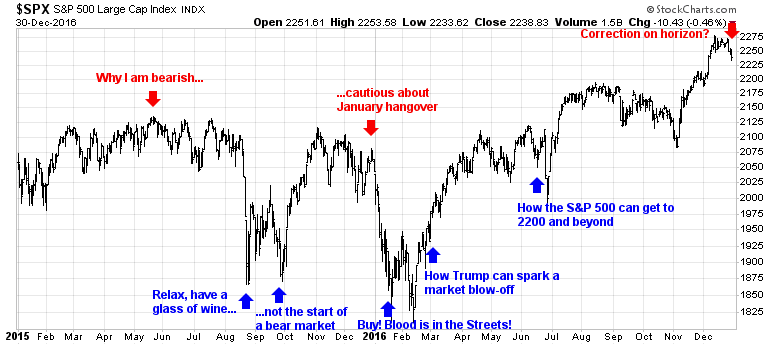
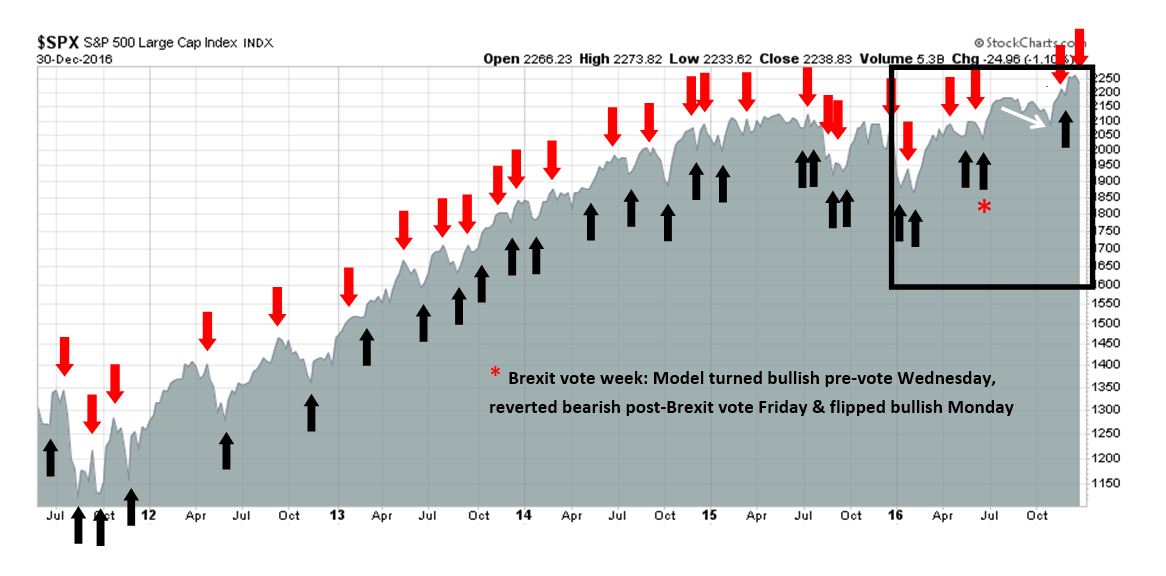

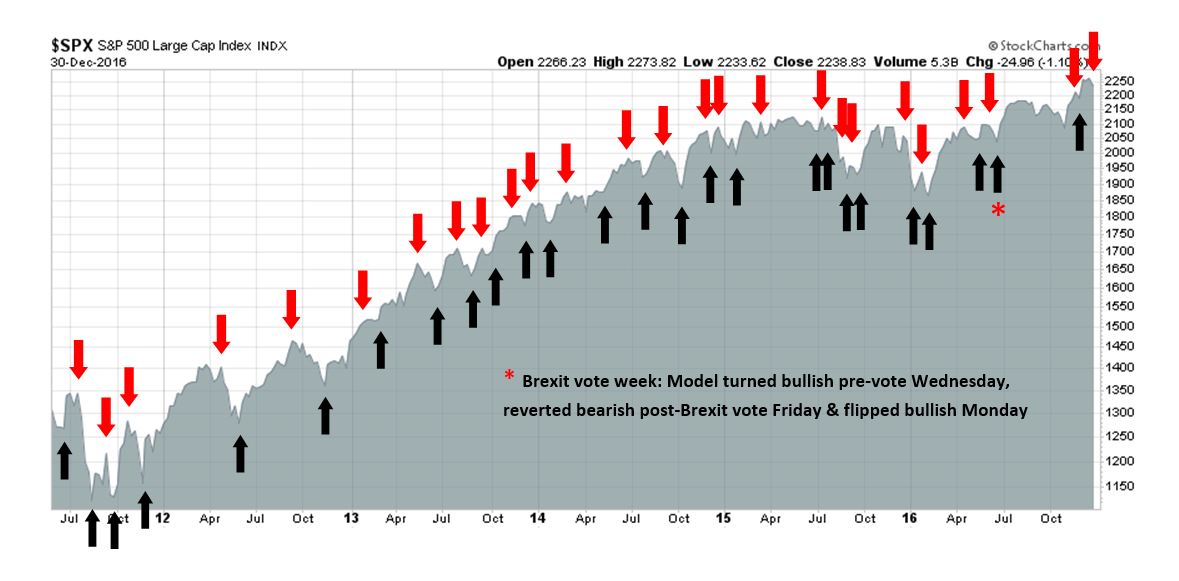


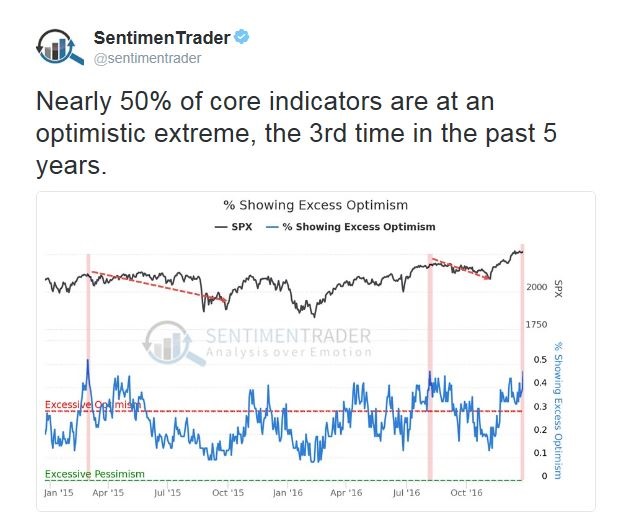
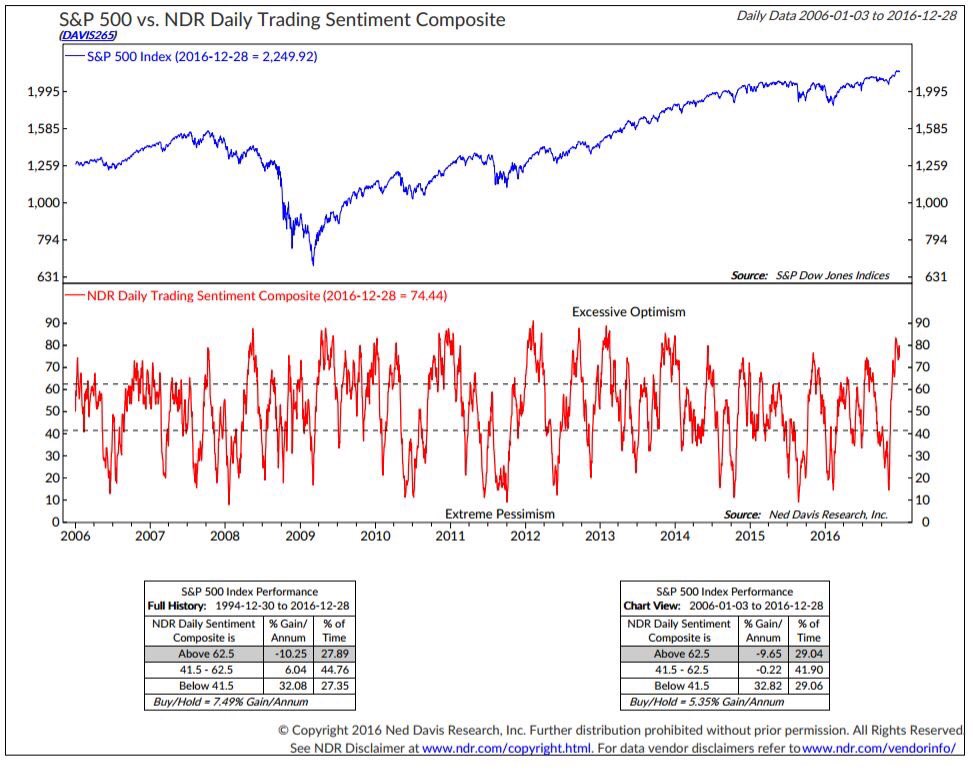


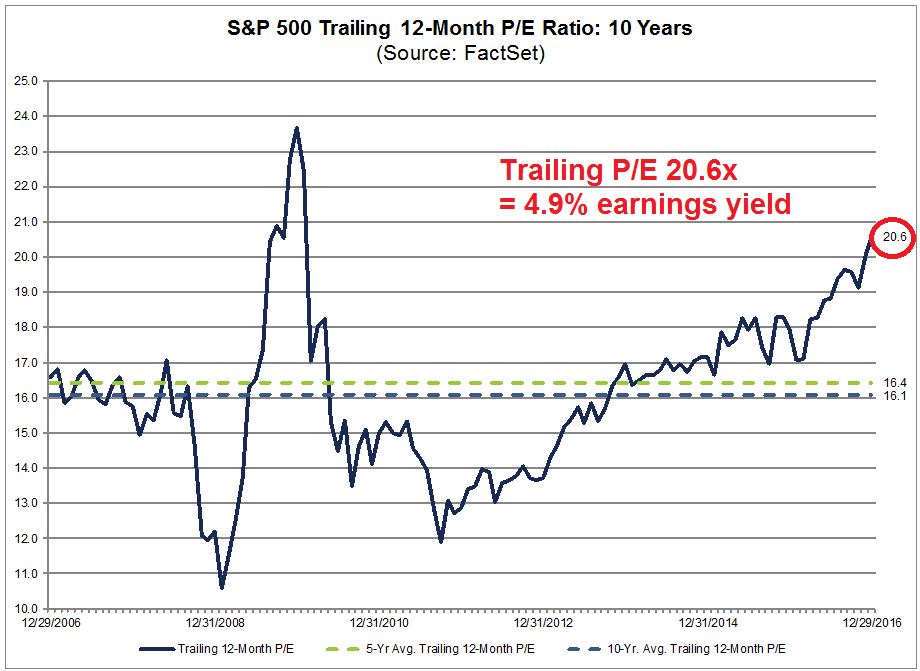


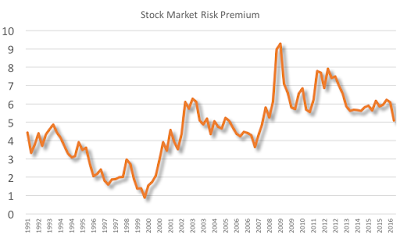
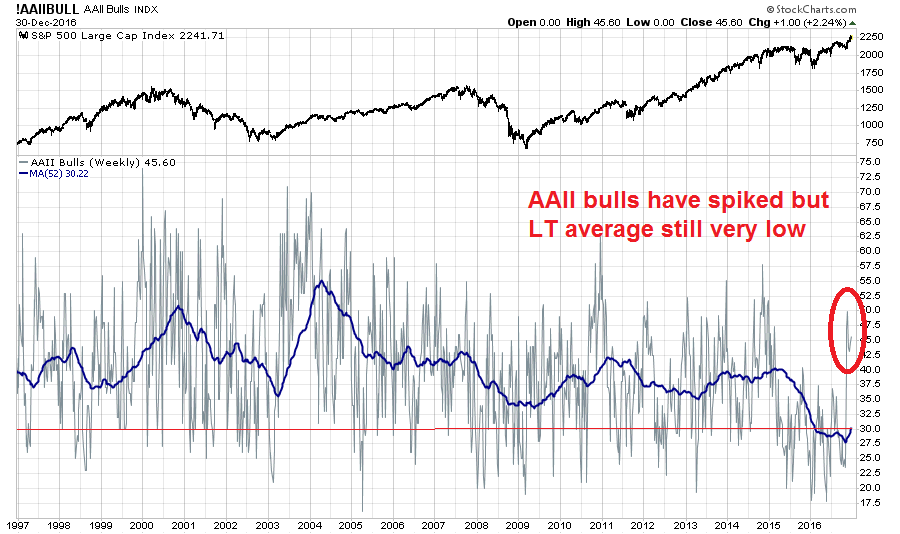
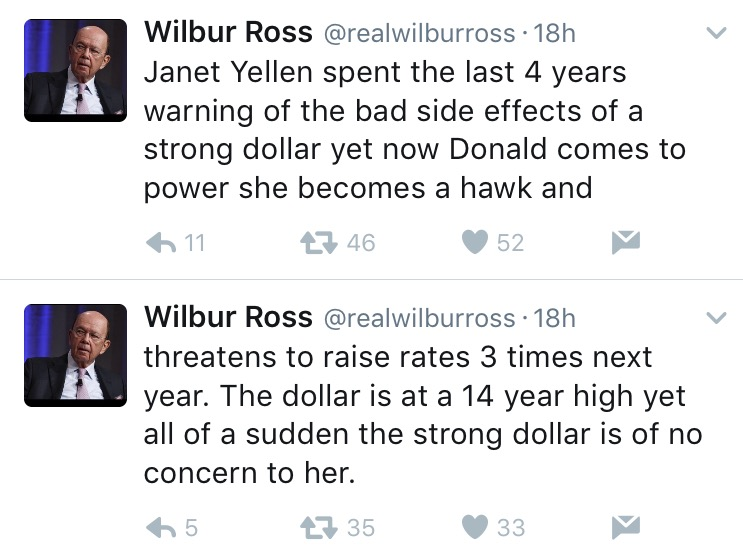
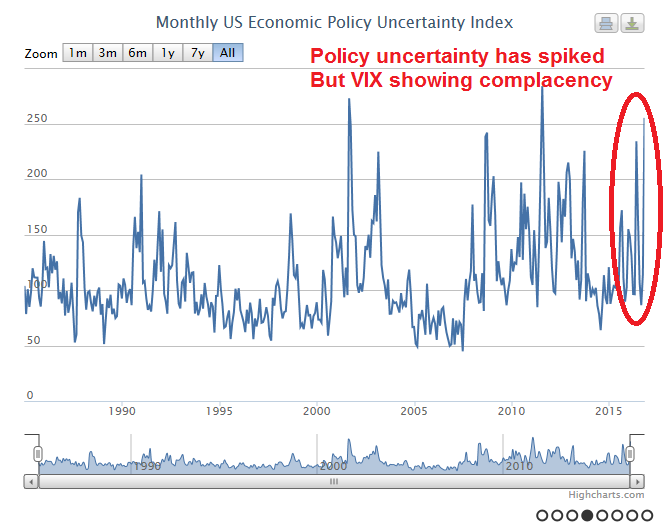
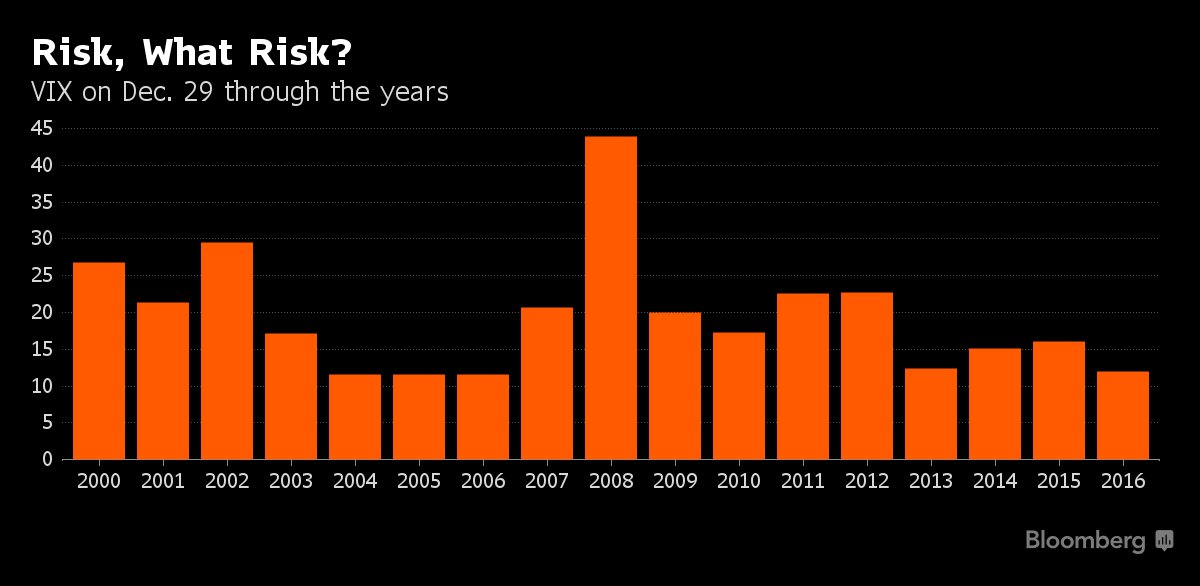
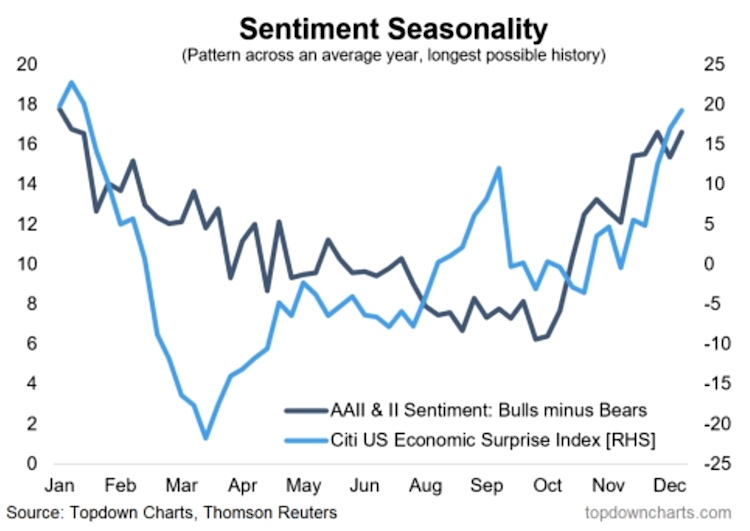

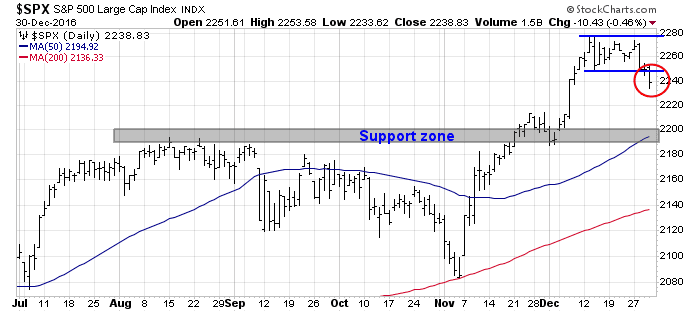
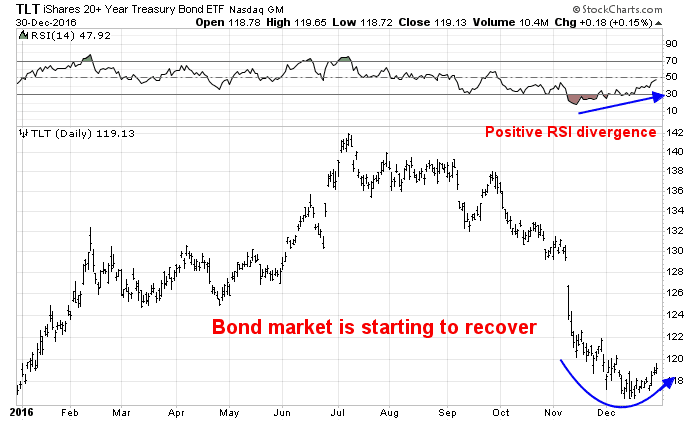
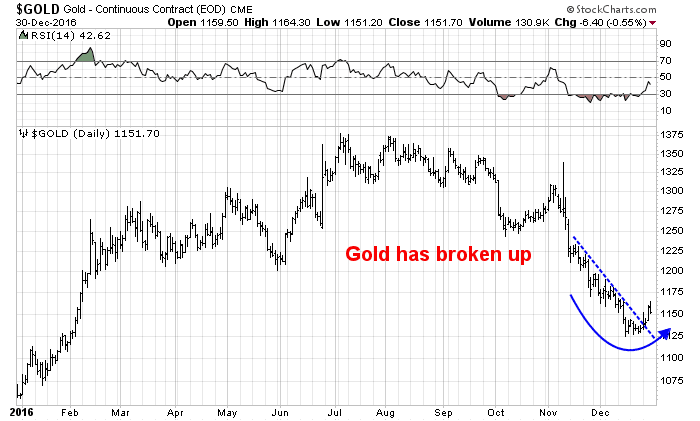

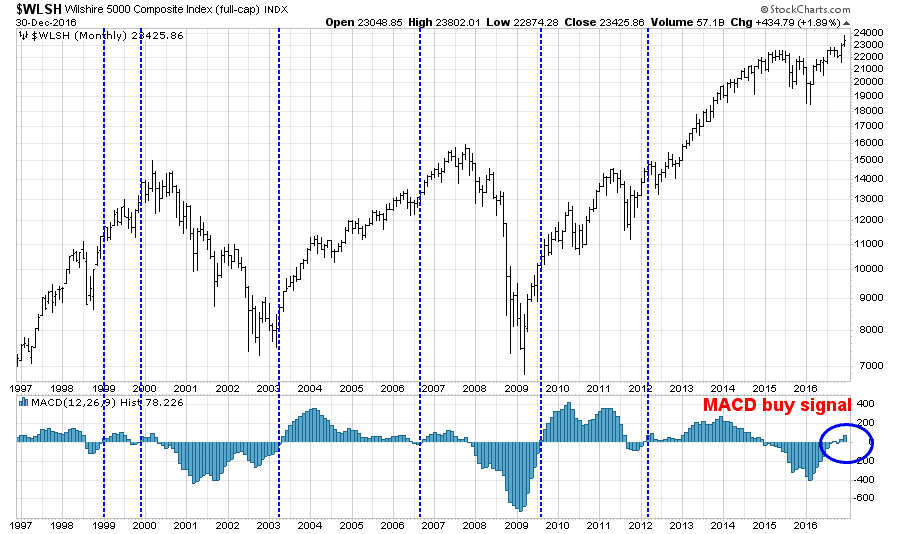
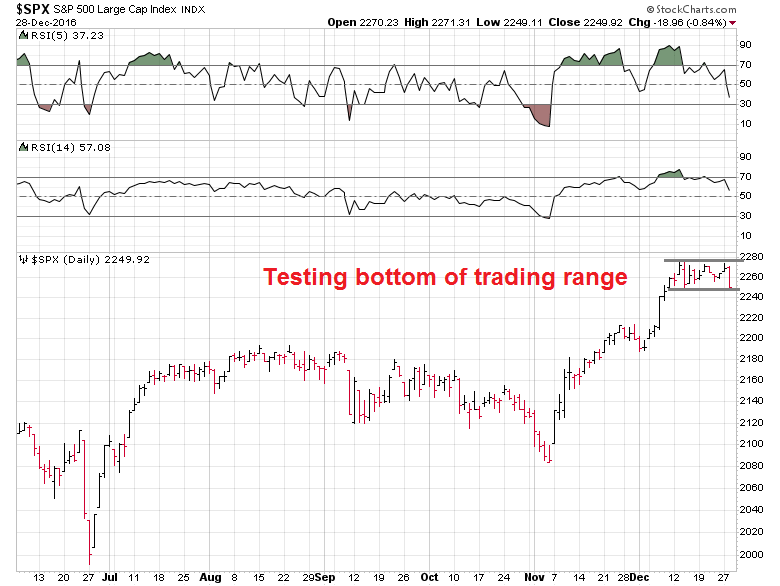

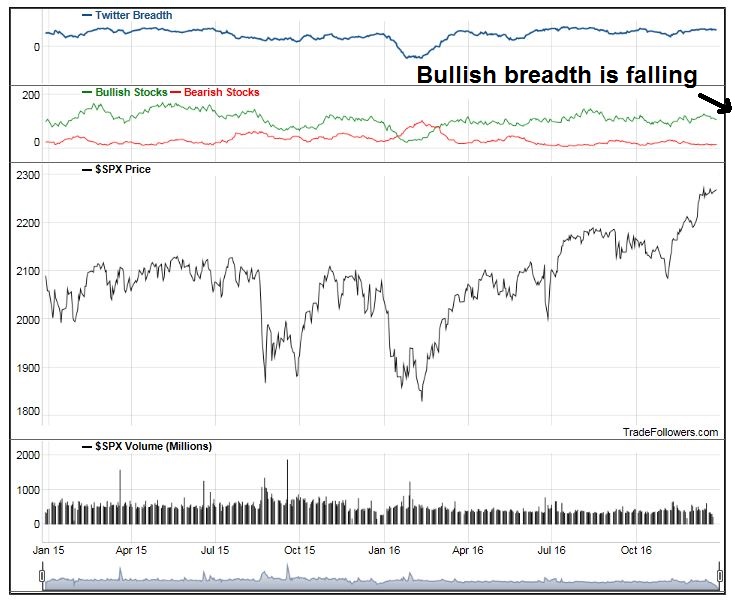


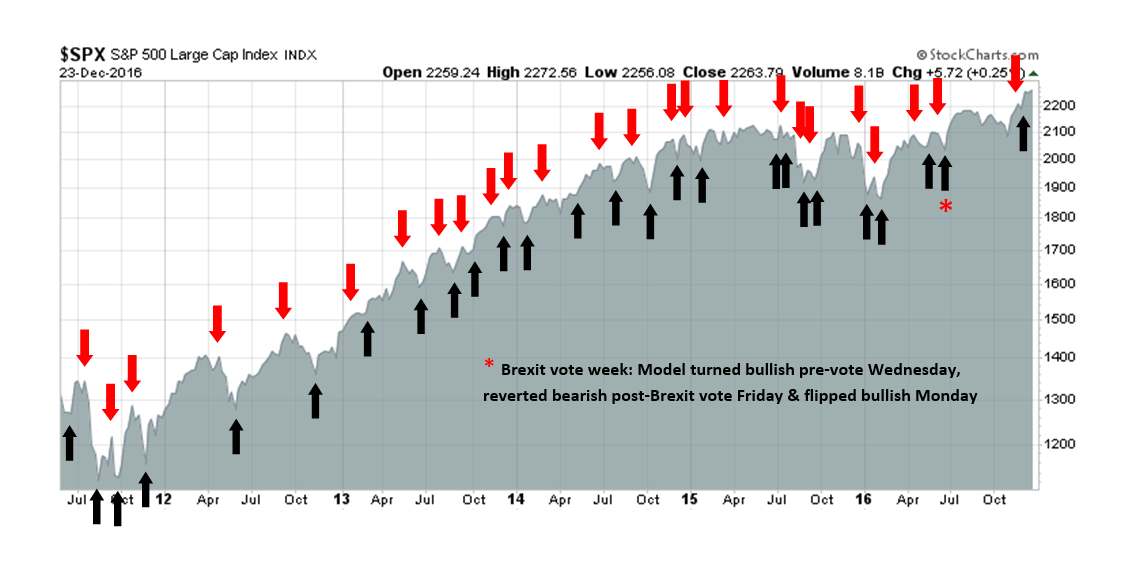
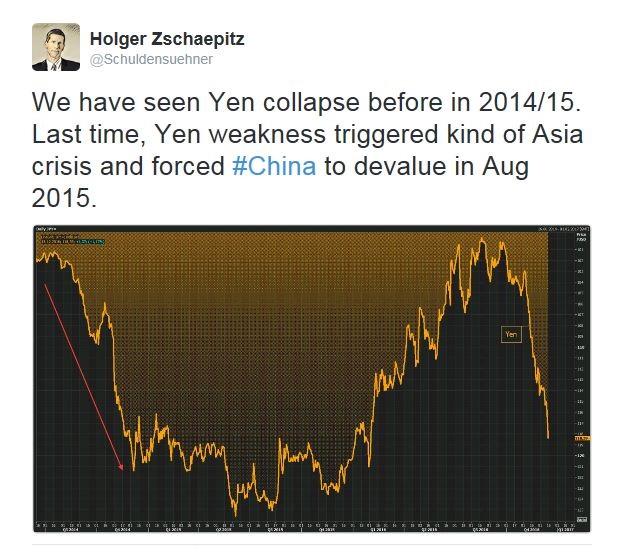


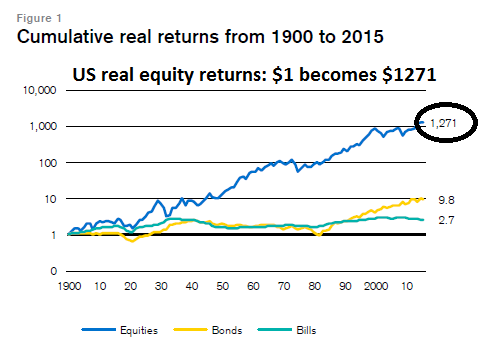
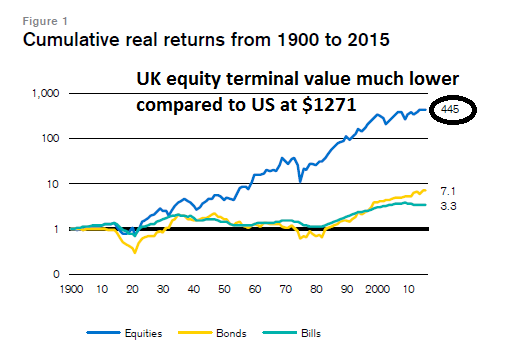
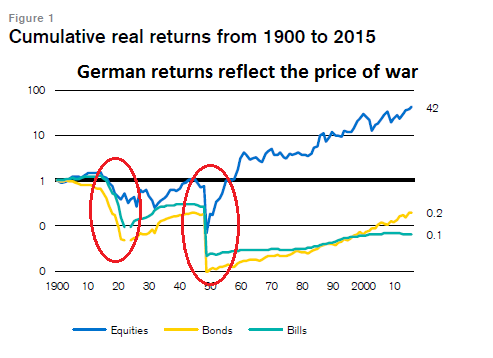
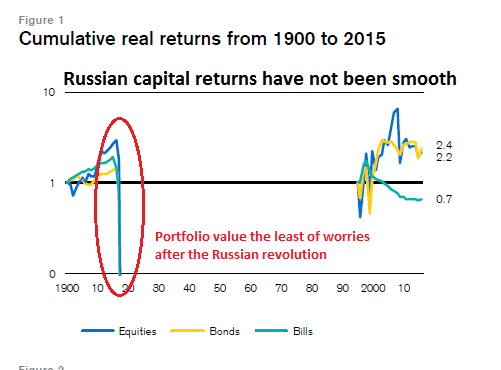
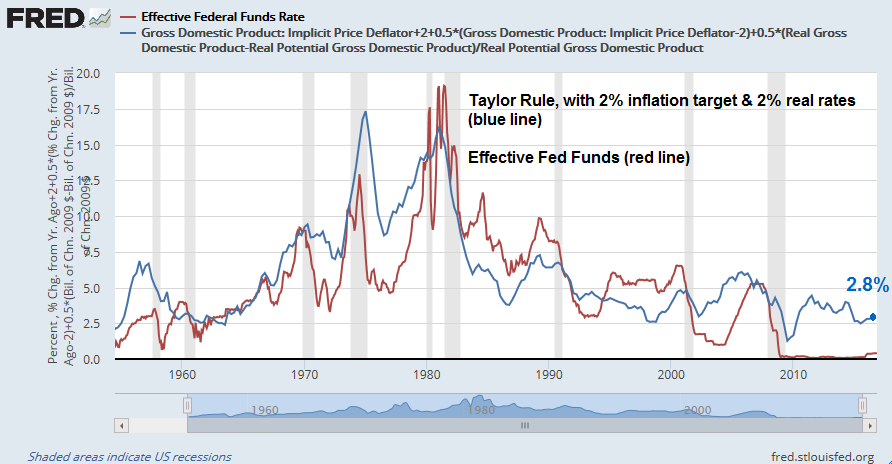
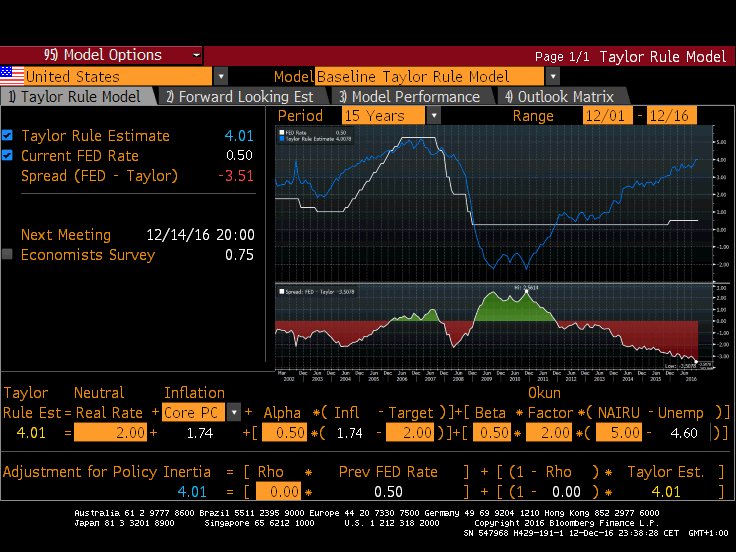
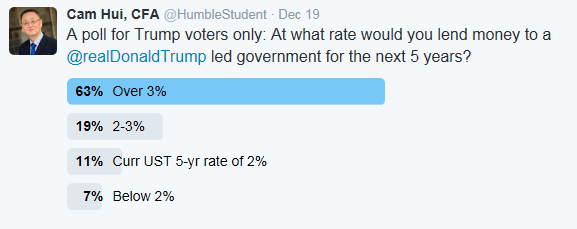


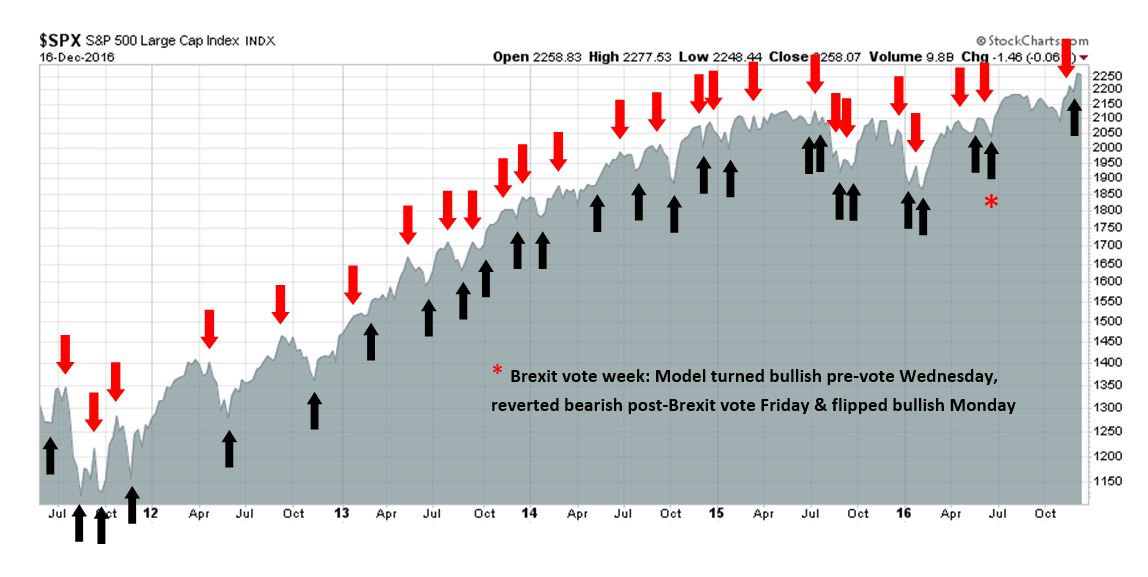
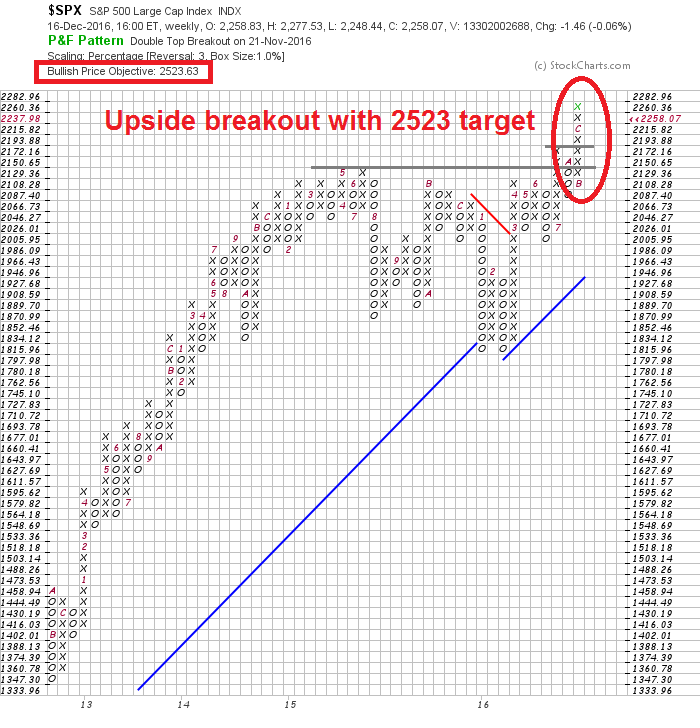

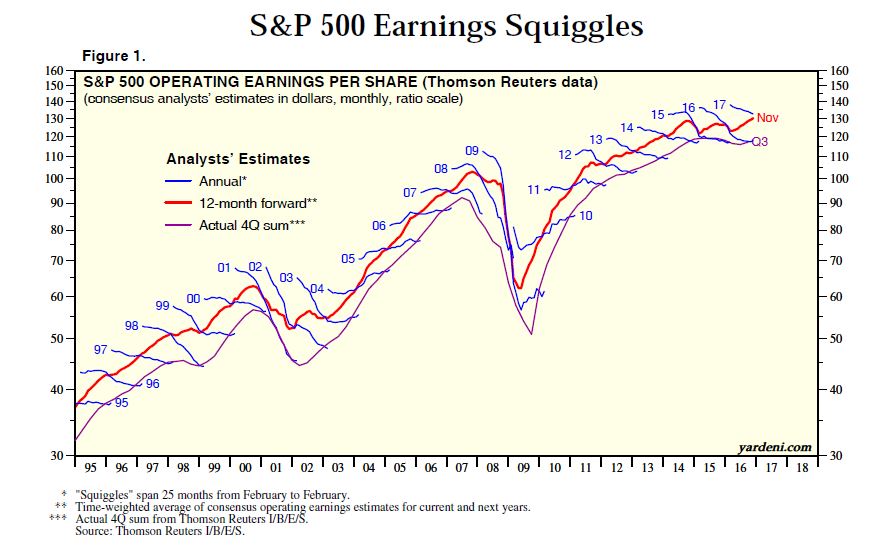
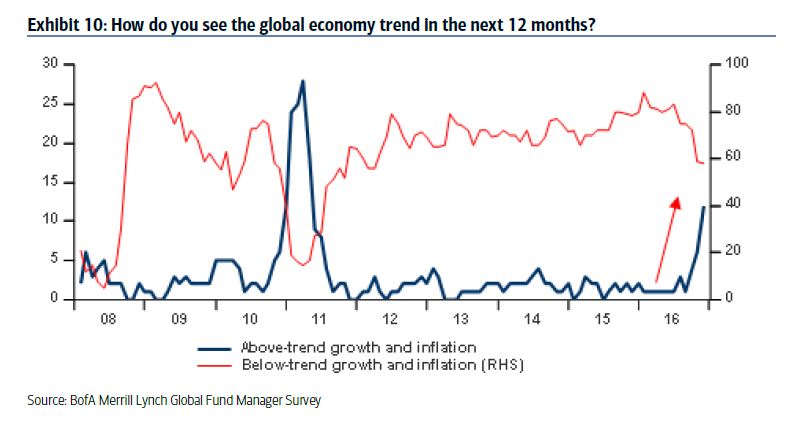
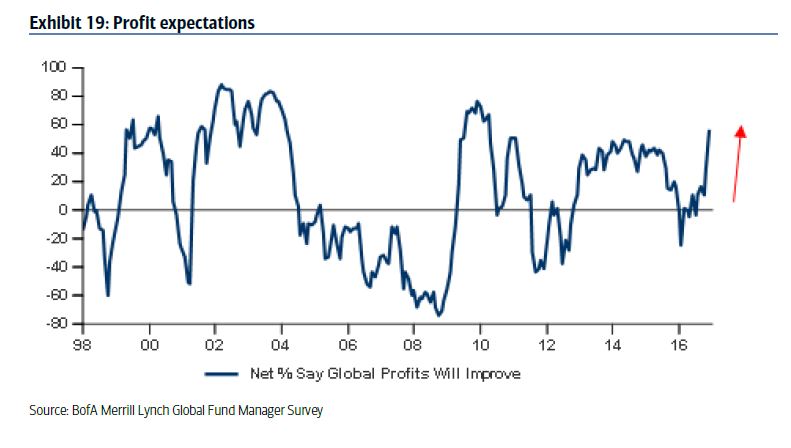
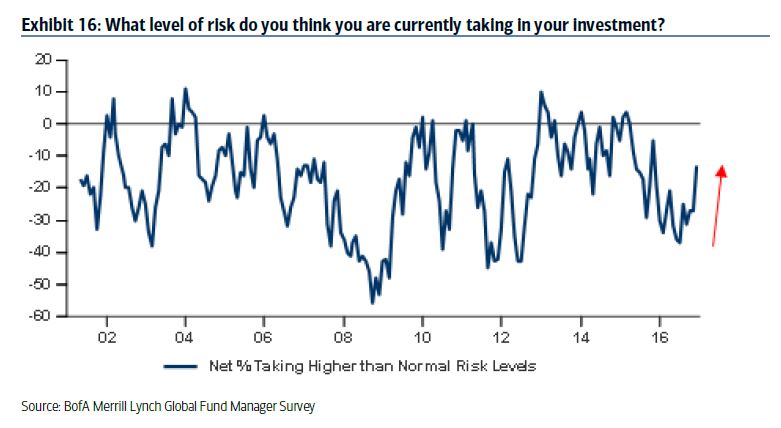
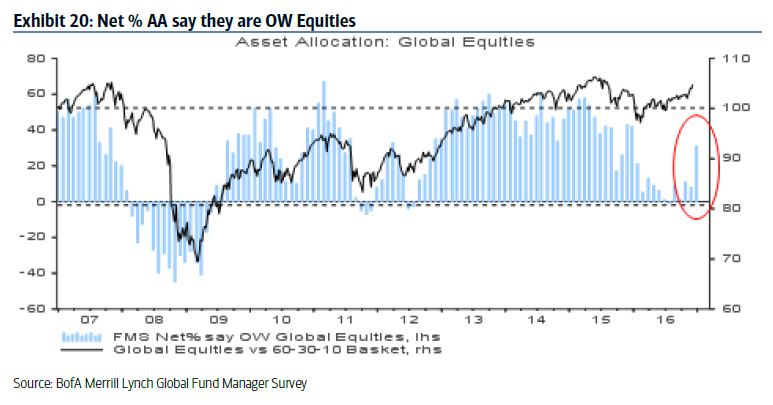
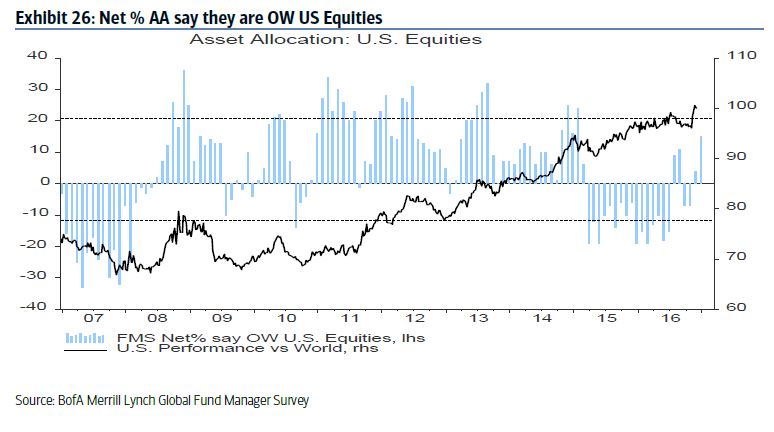
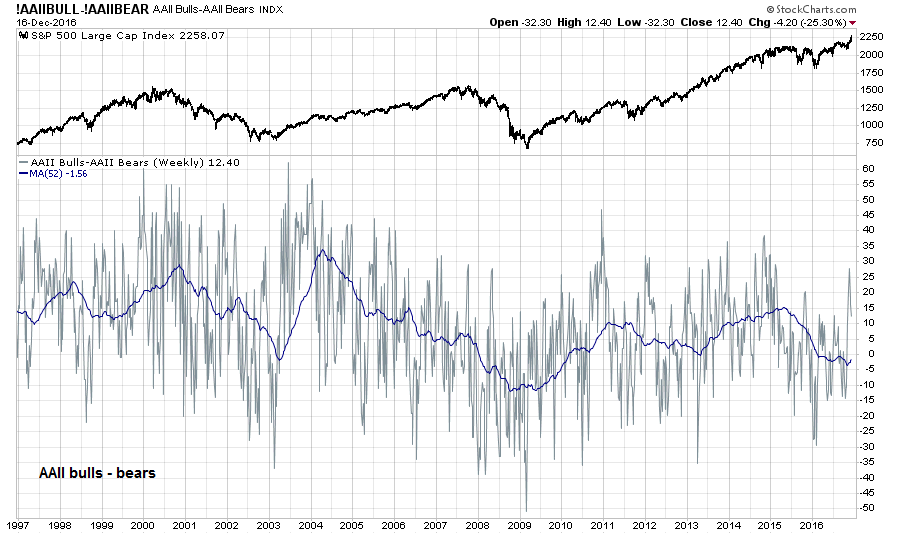

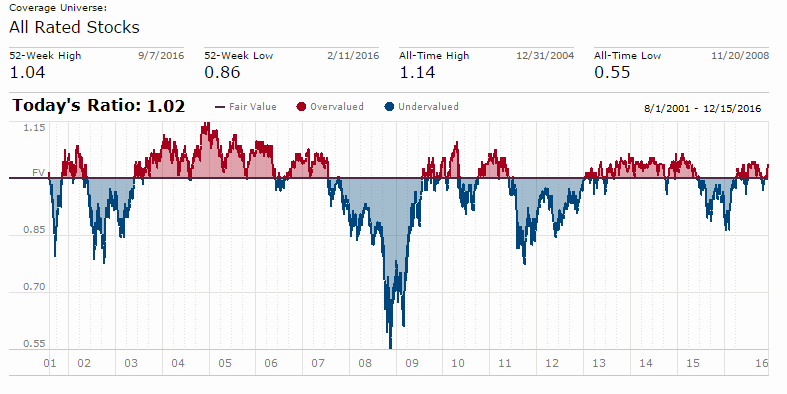

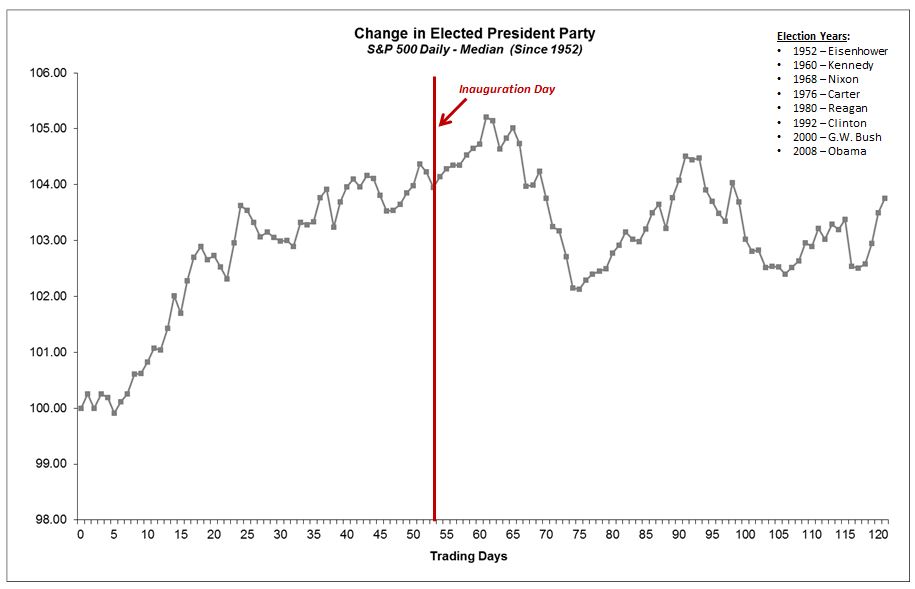
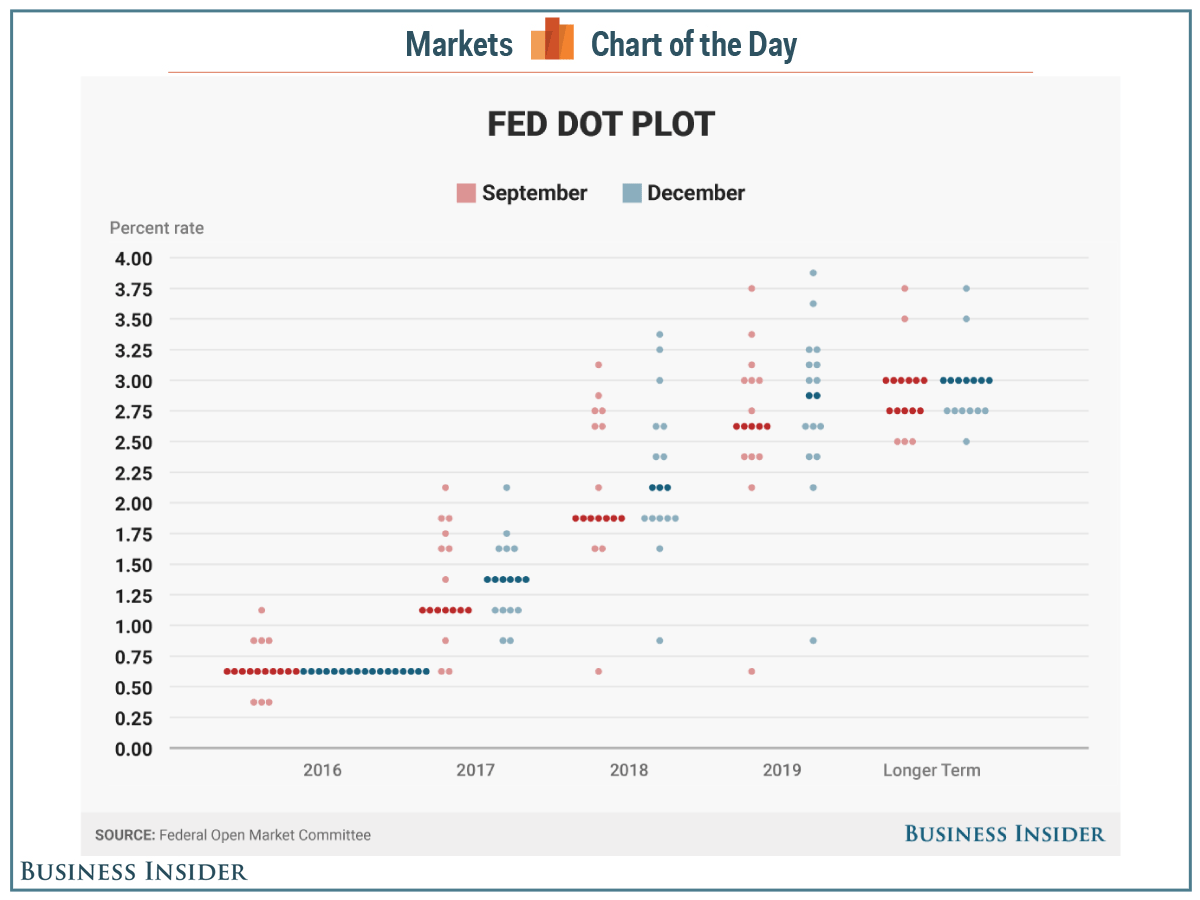


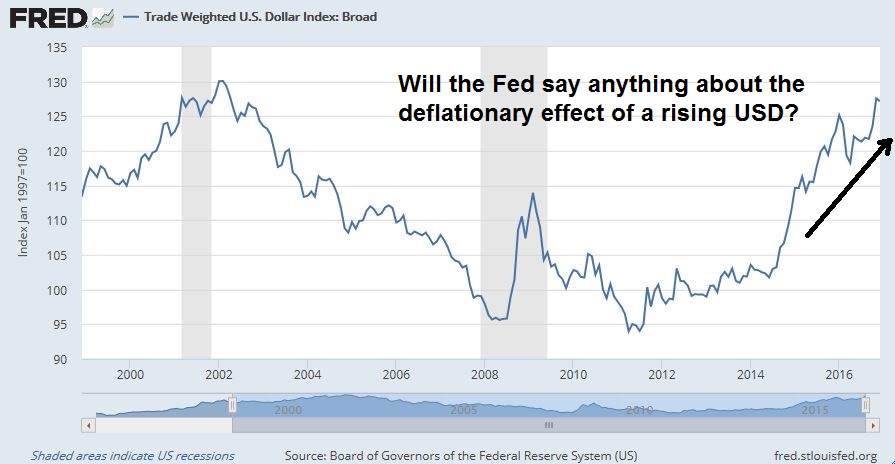

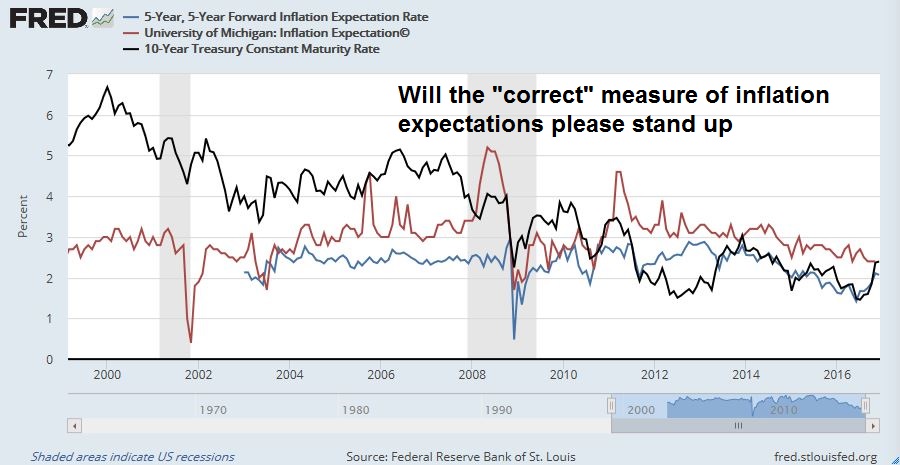
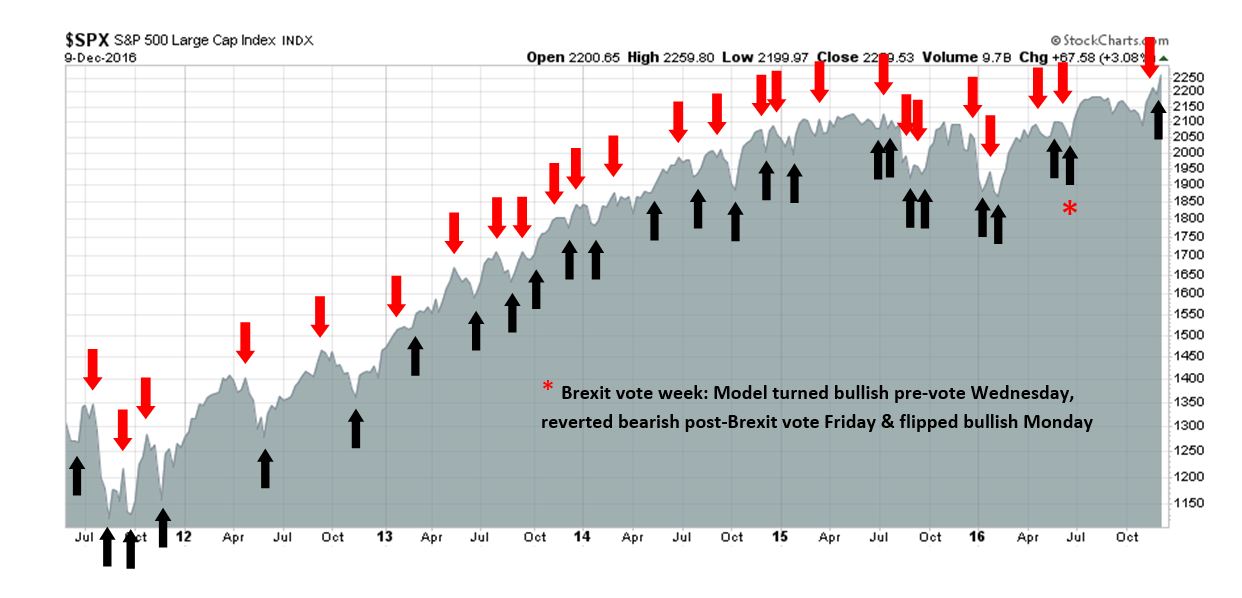


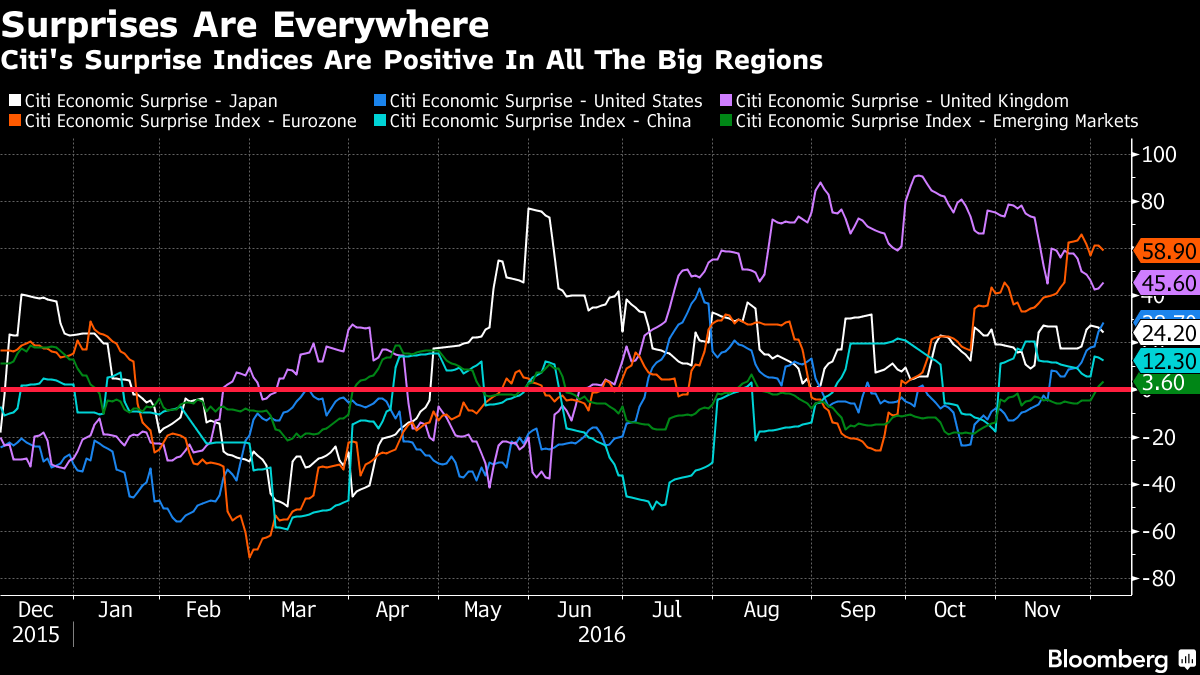


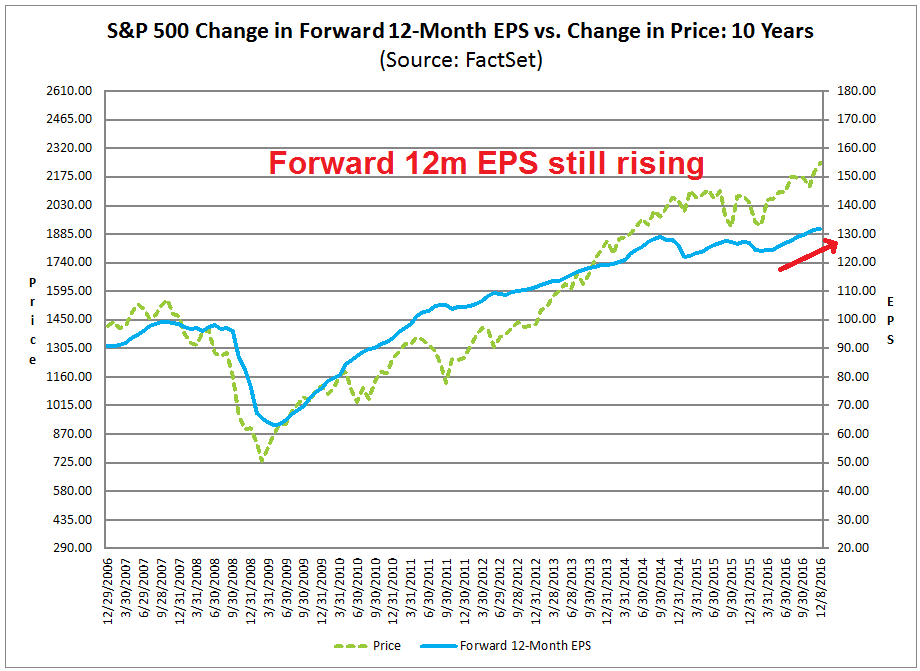


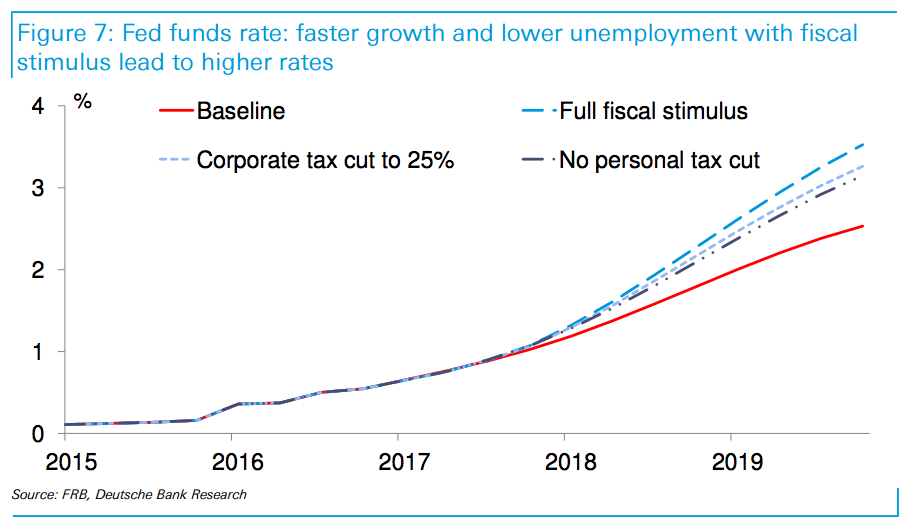

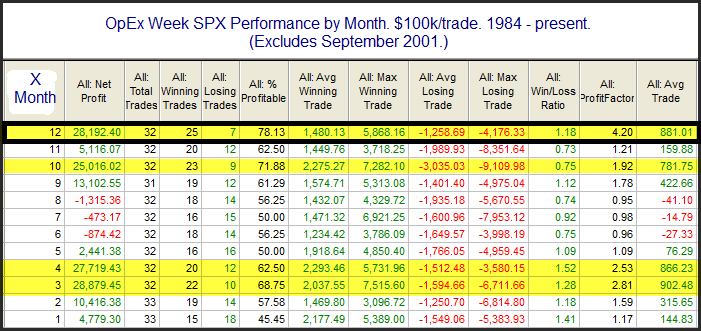
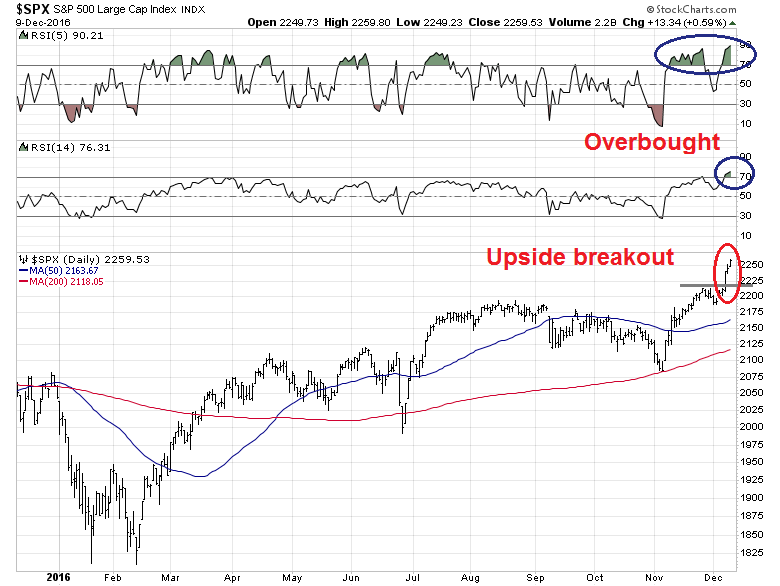
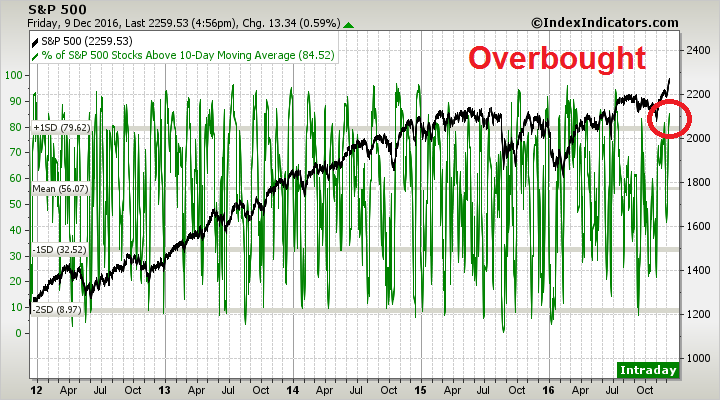


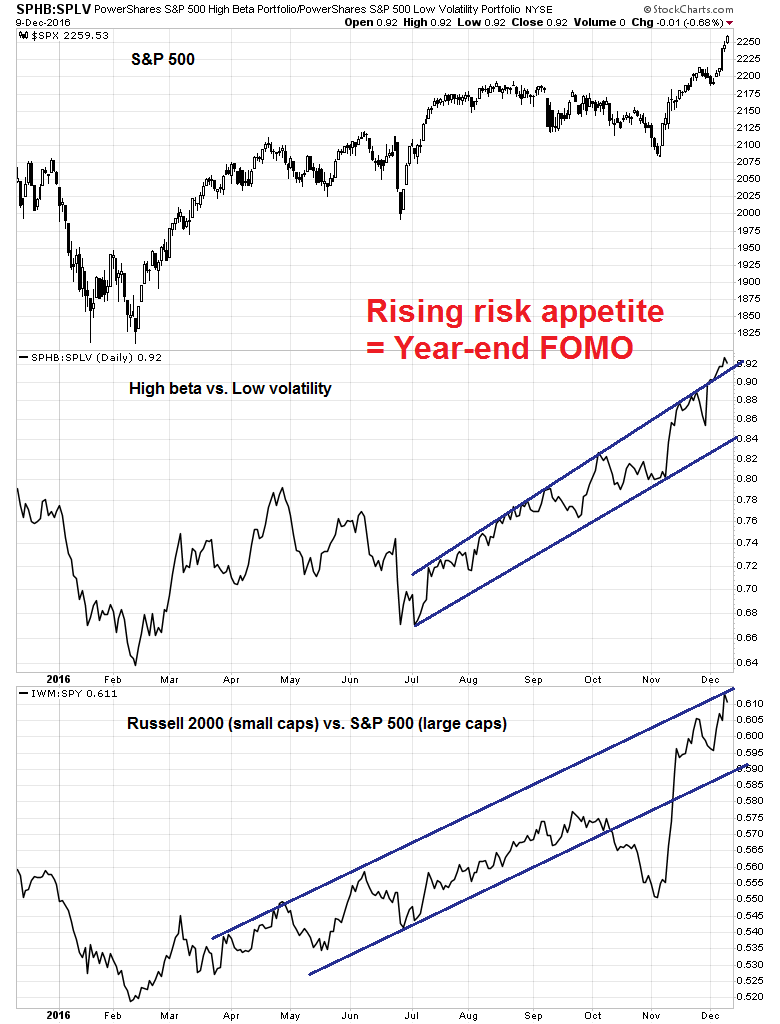