As I pointed out yesterday (see Brexit: LTCM or Lehman?), my Trifecta Bottom Spotting Model, which has shown an uncanny record of spotting short-term market bottoms. This model flashed an “exacta” buy signal as of Friday’s close and it has now flashed a “trifecta” signal based on Monday’s close.
The model is based on the following three components. An exacta signal occurs if two of the components are triggered within a week of each other and a trifecta signal occurs if all three are triggered:
- VIX term structure is inverted: When the ratio of 1-month VIX (VIX) and 3-month VIX is above one, it indicates a high level of market fear.
- TRIN above 2: When TRIN is over 2, it is an indication of indiscriminate forced selling by either risk managers or margin clerks – and often marks a capitulation bottom.
- Intermediate term overbought/oversold: When the intermediate term OBOS is below 0.5, the stock market is oversold and stretched to the downside.

The US equity market is setting up for a short-term face ripper of a rally very soon.
Short-term oversold
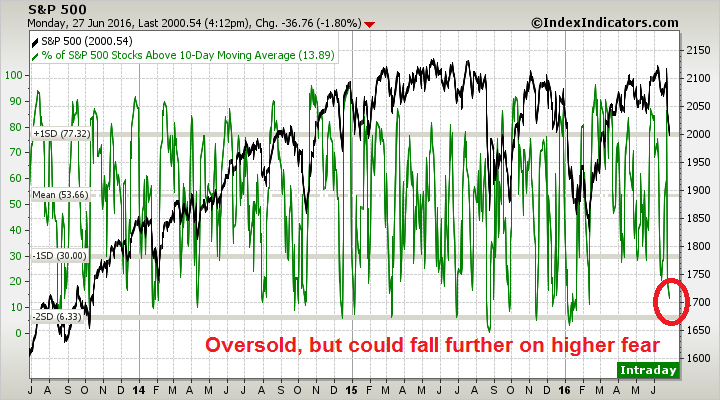
Other short-term breadth indicators are also showing oversold conditions that are usually followed by a market bounce. This chart of the % of stocks above their 10 day moving average from IndexIndicators is in oversold territory, though readings could go slightly lower if the market panic were to continue.

Got it! Thanks
Fritz
Cam, would like your feedback on the following:
– TRIN closed at 1.54 today (not 2) although intraday reading was slightly > 2 today. So is that still a trifecta “hit”?
– 10 year US treasury yeild dropped 7.5% (-12 bps) today on top of a > 5% drop on last Friday. Does this say that smart money “bonds” are screaming more trouble is ahead? Would it be premature to call bottoms? Or maybe your saying a short-term bottom is in but intermediate/long term could be still more chop/trouble ahead?
The rules of the Trifecta Bottom Spotting Model calls for a signal if those three conditions occur within 1-4 days of each other. So, yes – it does qualify as a buy signal.
UST yields dropping is another sign of risk aversion, so that’s not surprising.
As to your last question, it depends on what you mean by a “bottom”. Market is likely to bounce very soon. The bottom achieved today may not necessarily be THE LOW and I do expect some chop after the oversold rally.
thanks for the clarifications Cam!
Are you long now, Cam?
I am starting a vacation this weekend (though regular publications will continue). So I thought the prudent course of action is to stay in cash in the trading account for now.
Thanks. Have a nice vacation.
have a great vacation, Cam and thanks for your insights.
nice job!