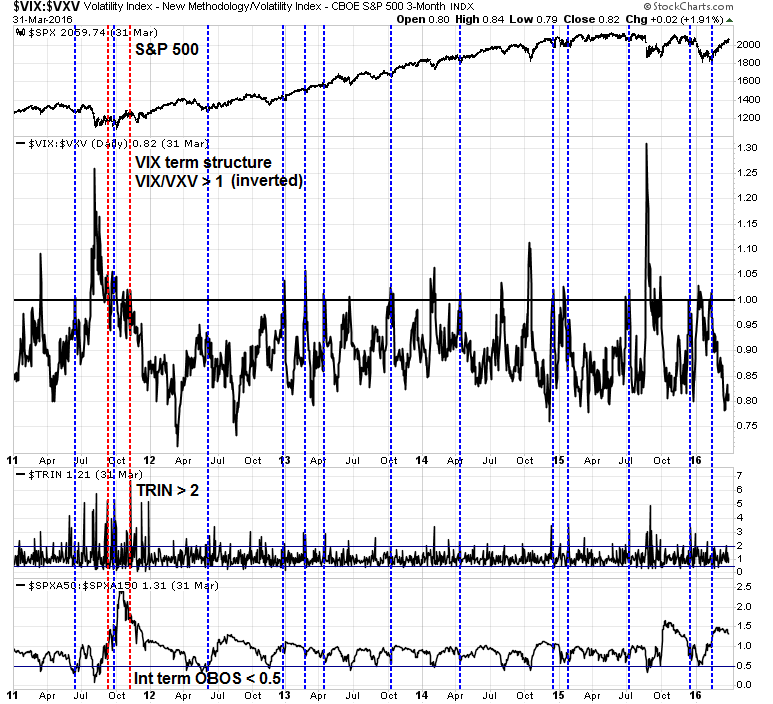
My Trifecta Bottom Spotting Model has been uncanny at spotting short-term market bottoms in the last few years. Since December 2010, the model has flashed eight buy signals and it has been correct seven out of eight times, or 87.5%. The chart below depicts the successful buy signals of this model by the blue vertical lines and the one early signal in red. For readers who want to follow along at home, here is a link to a real-time chart of the Trifecta Bottom Spotting Model.

Uncorrelated oversold signals
In constructing the Trifecta Bottom Spotting Model, I rely on three uncorrelated indicators that tell me whether the stock market is oversold:
- VIX term structure: Everyone knows about the VIX Index as a fear indicator, but did you know about the term structure of the VIX? The VIX Index is the implied volatility of nearby at-the-money options. There is an additional index, the VXV, which is the implied volatility of at-the-money options with a three-month term. When the VIX/VXV ratio is above one, it indicates that anxiety levels in the option market is much higher today that it is in the future, which is an indication of excessive fear. The term structure of the VIX is far more useful as a sentiment indicator than sentiment surveys as it measures what traders are doing with their money in real-time.
- TRIN: The TRIN Index compares the number of advancing/declining issues to the volume of advancing/declining issues. When TRIN is above 2, selling volume is overwhelming even the advance/decline ratio – that is a sign of fear-driven and price-insensitive margin clerk market.
- Intermediate-term overbought/oversold indicator: The Trader’s Narrative showed me one of my favorite intermediate term overbought/oversold indicators. It is calculated by dividing the number of stocks above the 50 day moving average (dma) into the 150 dma. In effect, this ratio acts as an oscillator showing how quickly the market is moving up, or down. A reading of 0.5 or less usually marks an intermediate-term oversold condition.
Exacta buy signals
When does the model fail?
While the Exacta and Trifecta Bottom Spotting Model has shown an uncanny record at spotting bottoms, no model is perfect and traders need to understand what makes a model tick and be prepared for conditions when it fails.
The Exacta and Trifecta Bottom Spotting Models are in essence oversold indicators. When they flash a buy signal, the market is oversold. As any good trader knows, oversold markets can get even more oversold. This model will fail when downward price momentum becomes overwhelming, just as it did during the market correction of September 2015 and the bear market of 2008-09. Therefore I recommend that traders apply this model judiciously by combining it with other analystical insights to ensure that the stock market is not encountering conditions where prices are cascading downwards
for macro-economic, fundamental or technical reasons.
As a reminder, here is a link to a real-time chart of the Trifecta Bottom Spotting Model for readers who want to follow along at home.
If you found this report to be useful, visit us at here to see the track record of market calls and all the other different ways we use to analyze markets.