Preface: Explaining our market timing models
We maintain several market timing models, each with differing time horizons. The “Ultimate Market Timing Model” is a long-term market timing model based on research outlined in our post Building the ultimate market timing model. This model tends to generate only a handful of signals each decade.
The Trend Model is an asset allocation model which applies trend following principles based on the inputs of global stock and commodity price. This model has a shorter time horizon and tends to turn over about 4-6 times a year. In essence, it seeks to answer the question, “Is the trend in the global economy expansion (bullish) or contraction (bearish)?”
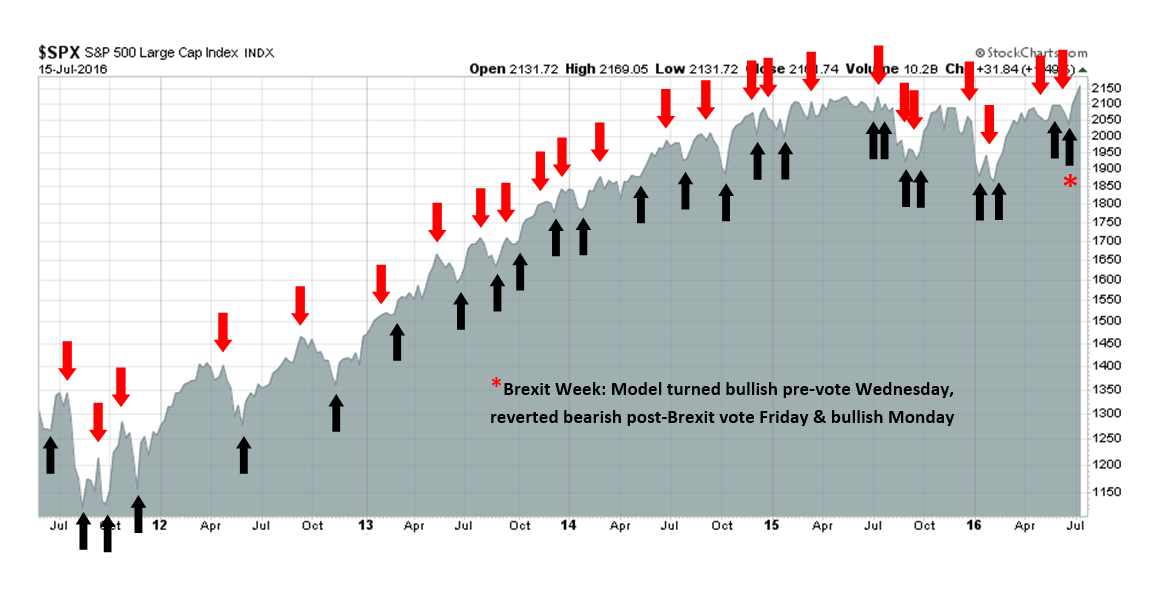
My inner trader uses the trading component of the Trend Model to look for changes in direction of the main Trend Model signal. A bullish Trend Model signal that gets less bullish is a trading “sell” signal. Conversely, a bearish Trend Model signal that gets less bearish is a trading “buy” signal. The history of actual out-of-sample (not backtested) signals of the trading model are shown by the arrows in the chart below. Past trading of the trading model has shown turnover rates of about 200% per month.
The latest signals of each model are as follows:
- Ultimate market timing model: Buy equities*
- Trend Model signal: Risk-on*
- Trading model: Bullish*
Update schedule: I generally update model readings on my site on weekends and tweet any changes during the week at @humblestudent. Subscribers will also receive email notices of any changes in my trading portfolio.
The all-time-highs explained
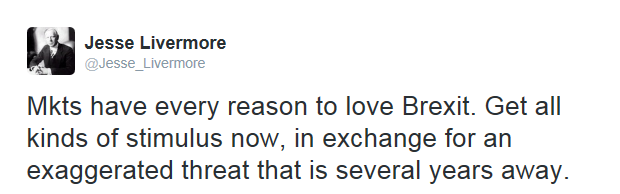
Regular readers know that I have been bullish on stocks for quite some time. It was therefore gratifying to see the stock market catapult to new all-time-highs. Just in case you were wondering why stock prices have been rallying in the face of Brexit uncertainty, the blogger Jesse Livermore pretty much nailed the reason with this tweet:
I also suggested last week that the market was on the verge of a growth surprise (see How to get in on the ground floor of a market bubble). The combination of an equity market friendly policy environment and positive growth surprises are acting to push stock prices higher.
Signs of renewed growth are everywhere
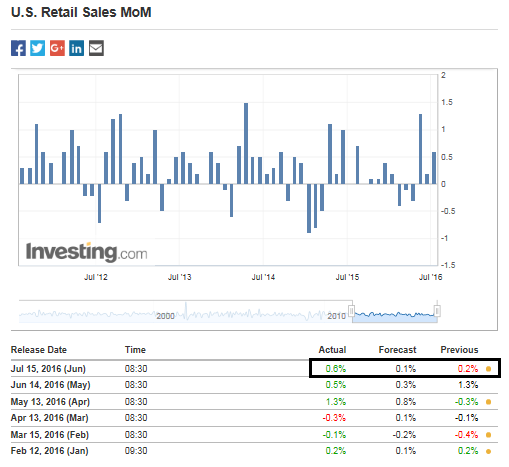
Indeed, we saw more data indicating robust US economic growth as industrial production and retail sales, which represent both the manufacturing and consuming parts of the economy, came in above expectations. Here is industrial production, which has recovered from its winter swoon:

June retail sales indicated that the American consumer remains healthy:
Other signs of a rebound are everywhere. NFIB small business optimism rose again in June, which contributed to a better growth tone for the economy.

As a result of these developments, we have seen a surge in the Citigroup Economic Surprise Index, which measures whether macro-economic releases are beating or missing expectations.

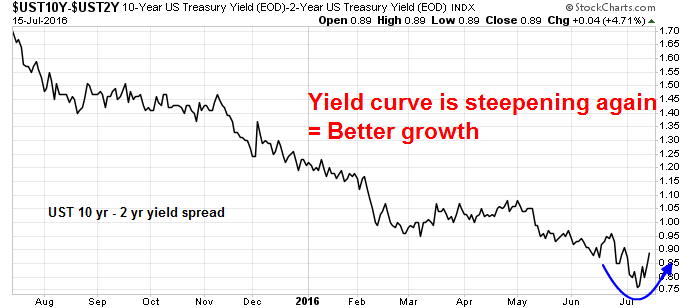
As well, the yield curve is steepening again, which is the bond market’s way of signaling higher growth.
Bottom-up analysis is also confirming the top-down view of economic strength. The latest earnings data update from John Butters of Factset shows that forward EPS continues to rise – which is another sign of positive fundamental momentum (annotations in red are mine).
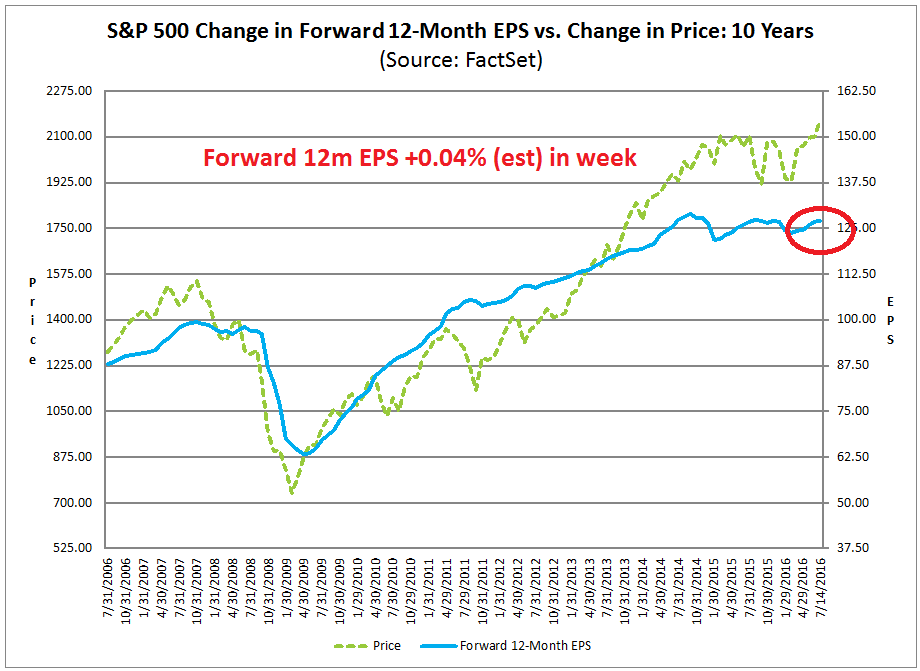
So far, all systems are flashing green for the bulls…
Cyclical sectors come back to life
The behavior of the market is also an important clue to market analysis.The bull case was bolstered when the SPX upside breakout to new all-time-highs was accompanied by leadership from cyclical stocks, which confirms my growth surprise thesis.
The renewed growth momentum seems to be global in nature. China is behaving well again, as the Shanghai stock market and the stock markets of its major Asian trading partners have all rallied above their respective 50 day moving averages (dma).

Commodity prices, and in particular the more cyclically sensitive industrial metals complex, are also important barometers of Chinese growth. Commodities have been in well-defined uptrends, which is a bullish sign especially in light of headwinds posed by the strong USD, which tends to be inversely correlated to commodities.

In addition, cyclical sectors and industries have also been showing signs of relative strength – which is another positive.

Bullish technical outlook
When I look at the market from a chartist’s viewpoint, the intermediate term picture looks bullish as well. The SPX staged an upside breakout through resistance and technicians can use such breakouts to measure the upside target for the index. When I apply a point and figure charting technique (using a 0.5% box and 3 point reversal), I get an upside target of roughly 2500.

The upside breakout in equities was also accomplished with strong momentum. Mark Hulbert highlighted analysis from Dan Sullivan indicating that the market has flashed a rare momentum buy signal that has occurred only 13 times since 1949. Such episodes have historically resolved themselves bullishly.

What more could the bulls ask for?
Near-term caution
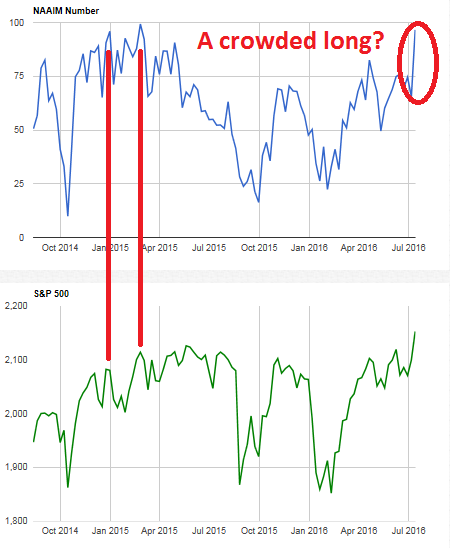
Despite all of the bullish backdrop, some caution is warranted as sentiment models suggest that the current advance is extended and the near-term risk-rewards is not necessarily skewed upwards. The latest NAAIM survey indicate that RIAs are in a crowded long. Historically, such conditions have resolved themselves with short-term pullbacks.
The 10 dma of the CBOE put/call ratio shows a high level of complacency, which has also led to consolidation or correction in the past (marked by the dotted red lines).

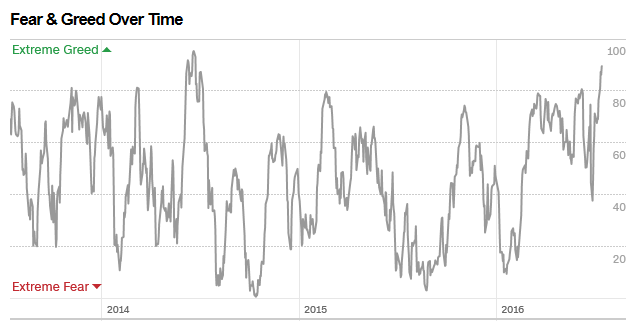
Similarly, the CNN Money Fear and Greed Index is flashing a very “greedy” reading.
My inner investor has been comfortably bullish on stocks for quite some time and he is riding out his position of an overweight position in equities. My inner trader has been in cash because he believed that it would be prudent to step to the sidelines as he was on vacation for the last couple of weeks. He will be back in the saddle next week and he will be waiting to get on stocks on any pullback, which is expected to be relatively shallow.
Disclosure: No trading positions
Yeah. Prob a retest of the spx breakout will make the bull more solid.
My bull case is built around ‘lower for longer ‘ interest rates. Last week we saw an extreme surge in bond prices that took yields to an historic low. Since then they have pulled back and we may have seen the lows for this cycle marked.
Dividend stocks have led the new bull market and any backing up of rates could see them pull back temporarily somewhat just like the research on momentum surges suggests.
The other leading group, commodities is not immune. Lower for longer effects the American dollar so a backup in yields could see the dollar rally and this will pressure commodity prices and the currencies of commodity producing countries.
In my opinion this is just a short term negative. Dividends yields are so rich compared to bond yields that stocks have a bright future even if interest rates back up. Commodity related stocks are not as definably cheap and their share prices are extended.
The person above by the name “Ken” is constantly pushing for dividend stocks. It is not only annoying but also beginning to sound like advertising. I think this should stop.
I enjoy his commentary. If it bothers you then skip over the post. I think he brings a lot to the board and has a lot of intelligent observation and comment. Keep up the good work!