Preface: Explaining our market timing models
We maintain several market timing models, each with differing time horizons. The “Ultimate Market Timing Model” is a long-term market timing model based on research outlined in our post Building the ultimate market timing model. This model tends to generate only a handful of signals each decade.
The Trend Model is an asset allocation model which applies trend following principles based on the inputs of global stock and commodity price. This model has a shorter time horizon and tends to turn over about 4-6 times a year. In essence, it seeks to answer the question, “Is the trend in the global economy expansion (bullish) or contraction (bearish)?”
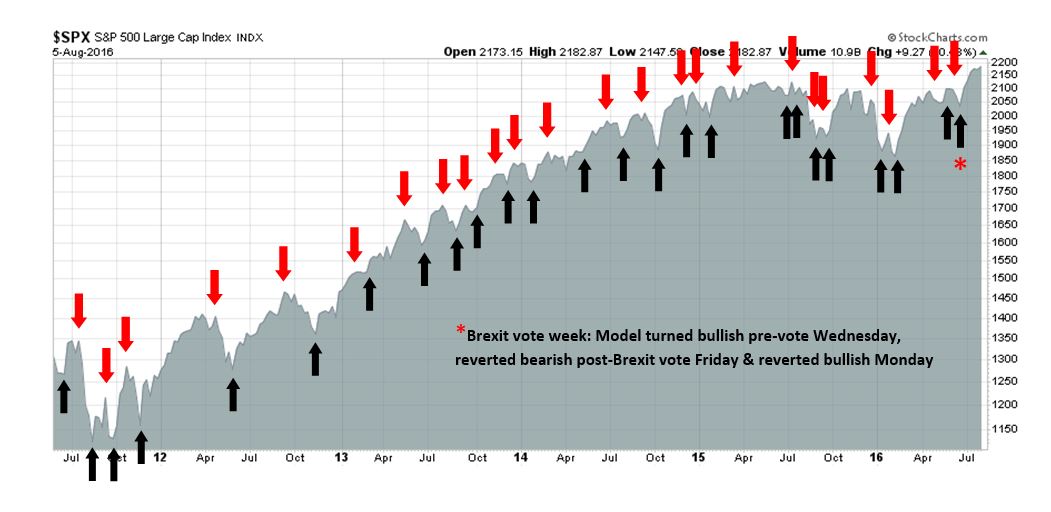
My inner trader uses the trading component of the Trend Model to look for changes in direction of the main Trend Model signal. A bullish Trend Model signal that gets less bullish is a trading “sell” signal. Conversely, a bearish Trend Model signal that gets less bearish is a trading “buy” signal. The history of actual out-of-sample (not backtested) signals of the trading model are shown by the arrows in the chart below. Past trading of the trading model has shown turnover rates of about 200% per month.
The latest signals of each model are as follows:
- Ultimate market timing model: Buy equities
- Trend Model signal: Risk-on
- Trading model: Bullish
Update schedule: I generally update model readings on my site on weekends and tweet any changes during the week at @humblestudent. Subscribers will also receive email notices of any changes in my trading portfolio.
A global growth rebound
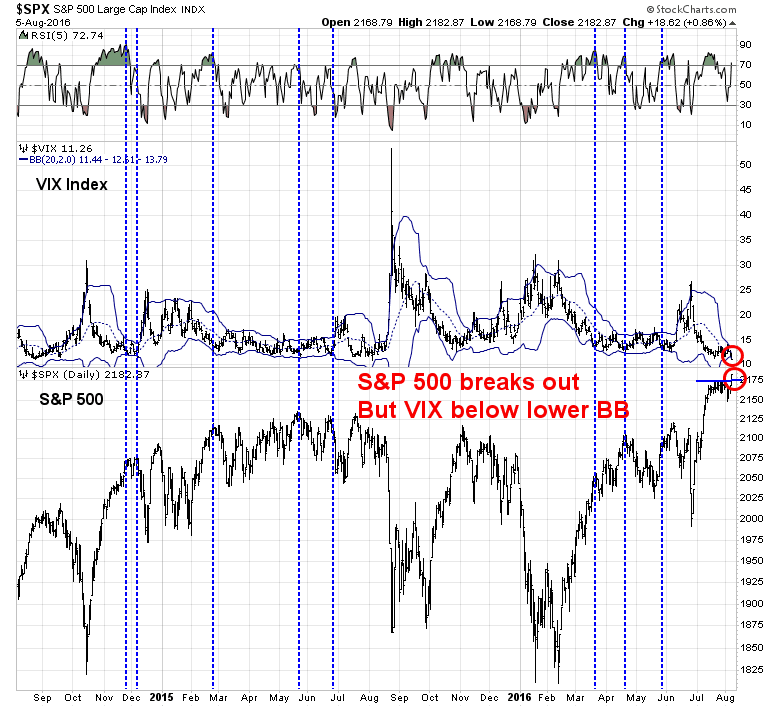
The SPX broke out to another all-time high on Friday in response to the positive surprise from the Employment Report. The upside breakout followed a false breakdown out of a narrow trading during the same week. The key question for traders is, “Is this an honest-to-goodness breakout, or just a fake out?”
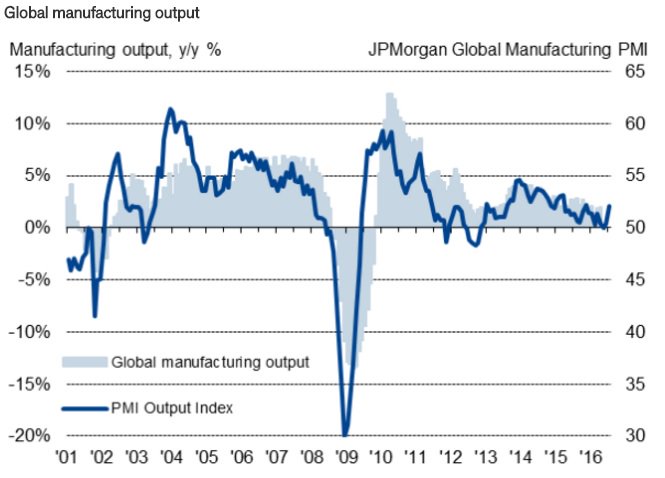
Indeed, there is an intermediate term bullish case to be made. I’ve been writing for the past few weeks about how the combination of overly defensively oriented investors and a US growth surprise is leading to a FOMO (Fear of Missing Out) rally in US equities. Now it seems that the growth surprise is spreading around the world. As the chart below shows, the Global Purchasing Managers Index (PMI) is turning up, which is a positive sign for global growth.
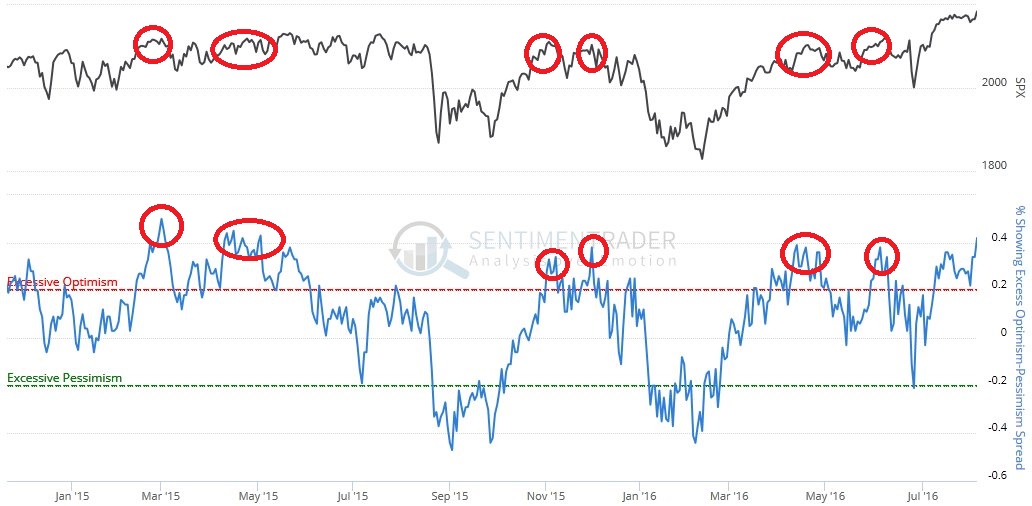
On the other hand, short-term technical indicators are flashing signals of extreme caution. The market appears to gotten ahead of itself and a pullback may be in order before stock prices can rise sustainably. The chart below from Sentiment Trader shows that sentiment is at an optimistic extreme, which is a worrisome sign (annotations in red are mine).
A tour around the world
As an overview of the intermediate term bull case, I would like to take a quick whirlwind tour around to world to see how each region’s growth outlook is progressing. My analytical framework is based on dividing the world into three trade blocs, centered around the US, Europe and China.
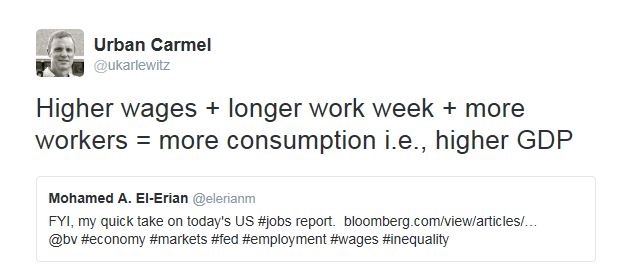
Let`s start our tour around the world with the US economy. Remember hand wringing over the recent disappointing Q2 GDP report? Friday’s July Employment Report has dispelled much of the anxiety over stalling growth. The headline job gains of 255K blew past Street expectations of 180K. The internals were equally positive, which was nicely summarized by this tweet from Urban Carmel.
Average weekly hours showed solid gains and it’s now at or above the levels seen at the peak of the last cycle. Note that average manufacturing weekly hours (red line) is a component of the Leading Economic Indicators and its strength is a positive sign for future growth.

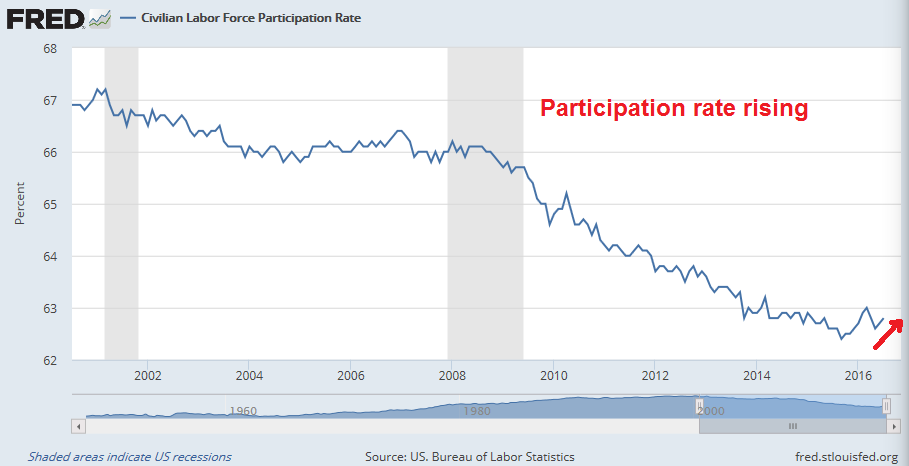
The participation rate continues to rise as discouraged workers re-entered the work force, indicating further momentum in employment.
Temporary jobs, which is a leading employment indicator, started to stall out last December but it`s on the rise again. This is a positive for future employment gains.

Wage gains are starting to show signs of acceleration.

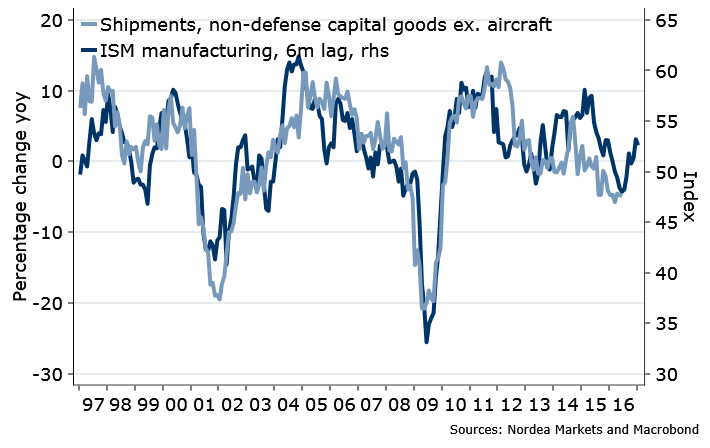
Putting this all together, we have the underpinnings of a healthy consumer who is ready to spend. On the industrial side of the economy, the upward trend in ISM is pointing a capital expenditure revival in the near future, even though the latest ISM Manufacturing survey missed market expectations.
There is also cause for optimism on the capex front, Bill McBride of Calculated Risk pointed out that much of the drop-off in non-residential investment came from the energy sector and it was actually positive, ex-energy.
The BEA reported that investment in non-residential structures decreased at a 7.9% annual pace in Q1. However most of the decline was due to less investment in petroleum exploration. Investment in petroleum and natural gas exploration declined from a $62.4 billion annual rate in Q1 to a $50.2 billion annual rate in Q2 – and is down from $106 billion in Q2 2015 (declined more than 50%).
Excluding petroleum, non-residential investment in structures increased at a 5.5% annual rate in Q2.
These upbeat views of the American economy are consistent with the analysis from New Deal democrat, who monitors high frequency economic releases and splits them into coincidental, short leading and long leading indicators. NDD had found that both the short and long leading indicator are positive, while coincident indicators have been a bit wobbly. Based on these results, I would expect more signs of economic improvement in the near future.
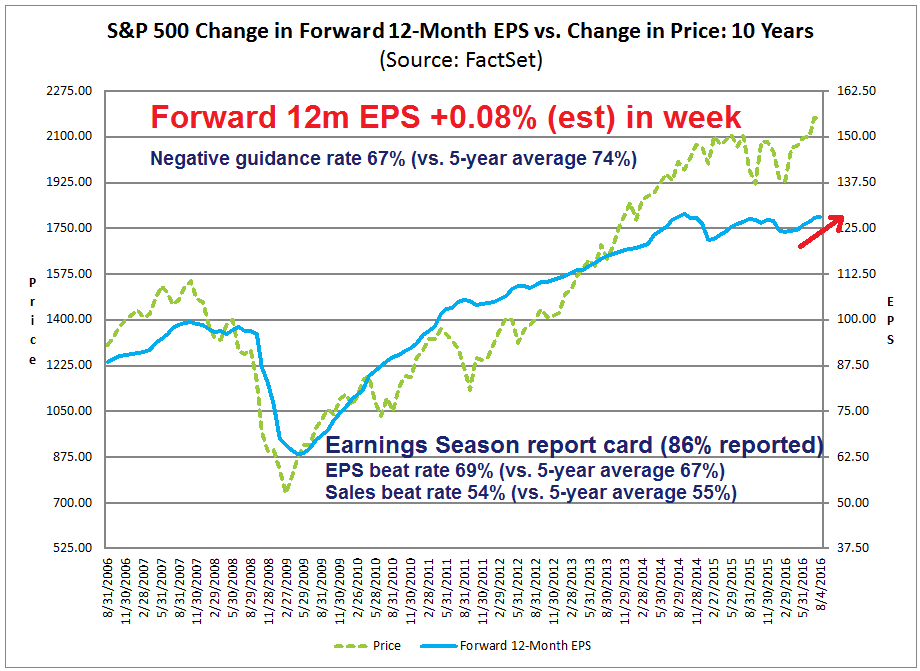
Equity investors should also be encouraged from a bottom-up perspective as corporate earnings expectations are still marching upwards. The latest update from John Butters of Factset shows that with Q2 Earnings Season is nearly over, the earnings and sales beat rates are roughly in line with historical experience. What management has been saying in their quarterly conference calls has been relatively upbeat, as the negative guidance rate is below average. Consequently, forward 12-month EPS is climbing, which reflect continued Street optimism.
In summary, there is no shortage of bullish news in the US.
Europe: Green shoots of recovery
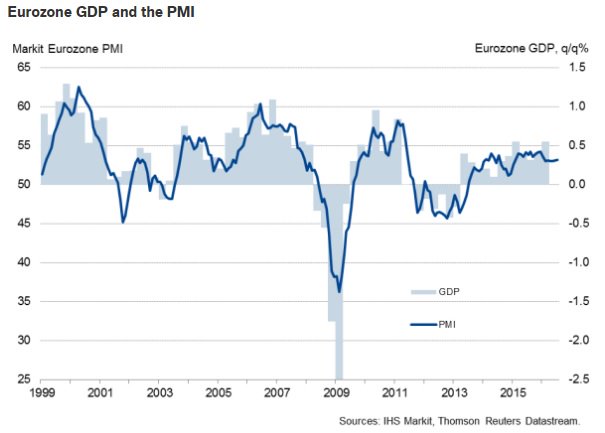
Across the Atlantic, Europe has been the sick man of the world, but there are signs of recovery. The latest Markit PMI shows a picture of steady growth.
Digging further, the employment component of PMI is turning up strongly, which is a cause for optimism.
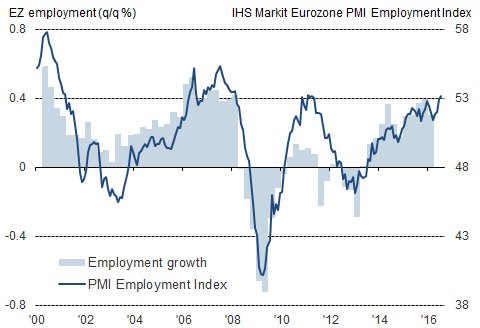
While it is the laggard, Europe is starting to look like an emergent turnaround story.
China: Don’t count on a hard landing
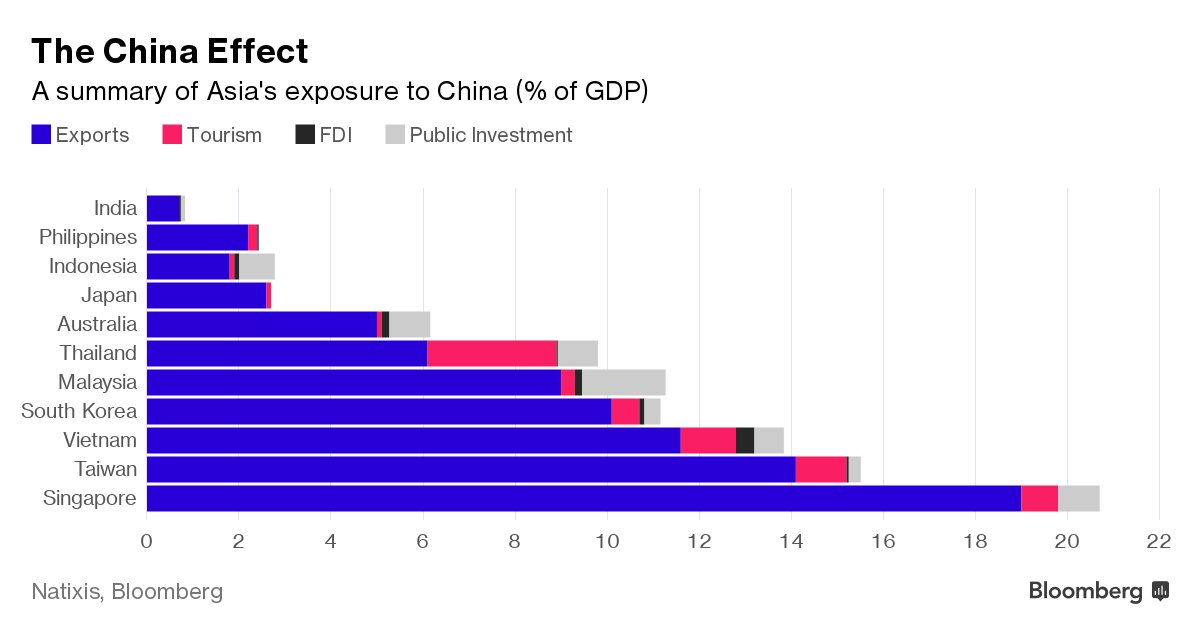
China’s economy statistics are notoriously unreliable and can be made up, so I have learned to rely on more indirect means of measuring Chinese growth. Here are the two ways that I use. One way is to monitor the stock markets of China’s major Asian trading partners, whose sensitivity to Chinese growth is shown in the chart below (via Bloomberg):
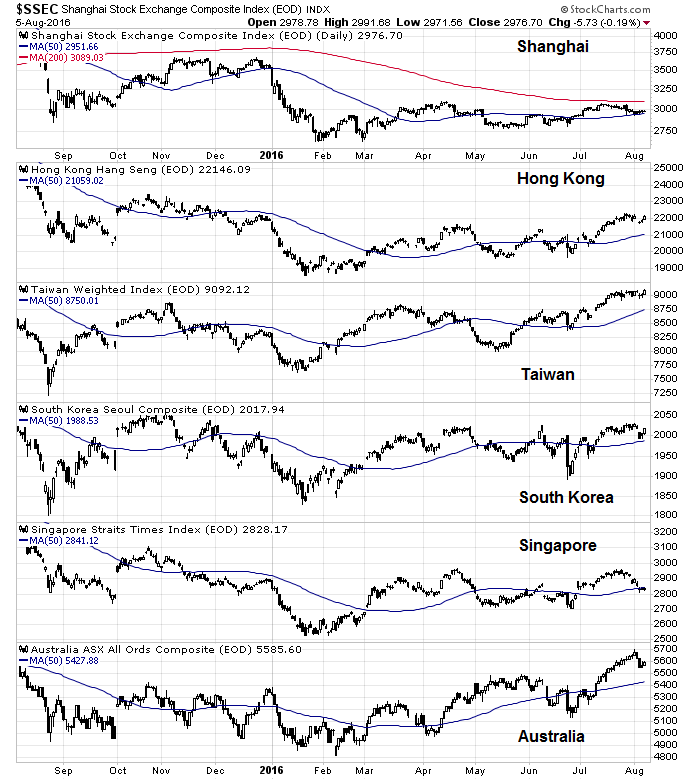
The charts of the “Greater China” stock markets are shown below. All markets, except one, are above their 50 day moving averages (dma). The only exception is Singapore, which is testing its 50 dma support.
Another way to measure the health of Chinese growth is through the price of industrial metals. The chart below shows that industrial metals are in a solid uptrend, even net of currency effects.

While I have expressed concerns about the longer term growth outlook for China (see How much “runway” does China have left?), the prospect of a hard landing is not in its immediate future.
The week ahead: Cautionary flags everywhere
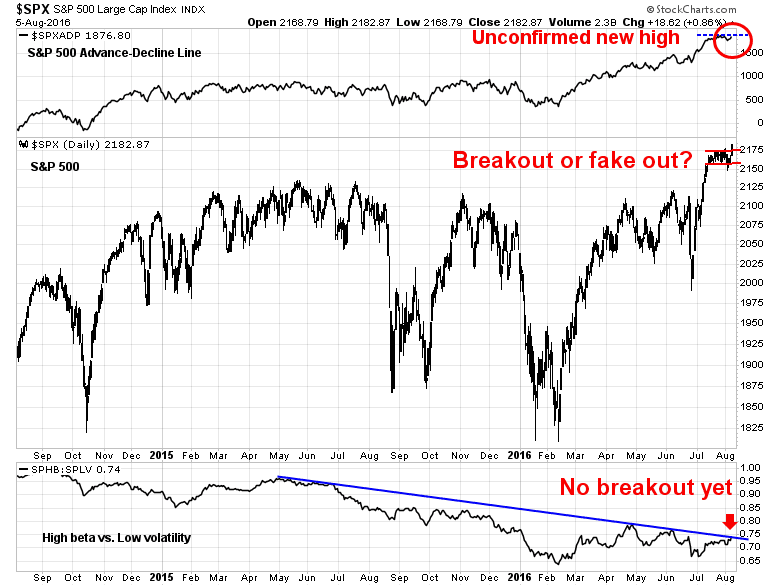
Looking to the week ahead, however, short-term cautionary flags are popping up everywhere. The chart below shows the SPX A-D Line (top panel), SPX (middle panel) and the relative performance of a high beta ETF (SPHB) against a low volatility ETF (SPLV) as a measure of risk appetite (bottom panel). As the chart shows, the SPX A-D Line (top panel) also did not confirm Friday’s upside breakout with a new high. In addition, risk appetite has not been able to break out of the relative downtrend and therefore constitutes another non-confirmation signal.
I also tweeted the following warning on Friday. The VIX Index had fallen below its Bollinger Band in the course of Friday’s market rally. Past instances (marked by vertical lines) have tended to resolve themselves with either consolidations or minor pullbacks.
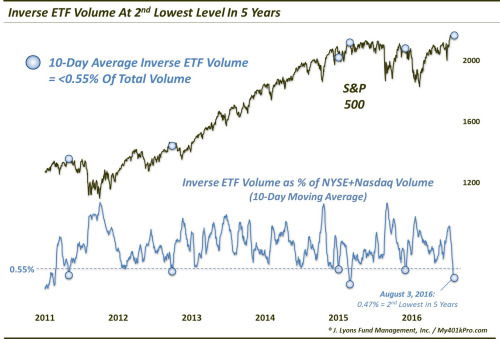
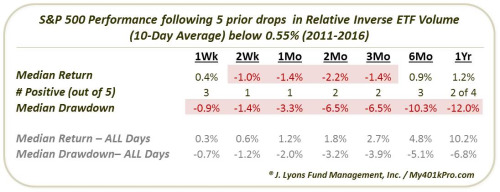
Dana Lyons pointed out last week that inverse ETF volume is historically low, which is a sign of trader complacency that can lead to short-term corrective action. As the sample size is low (N=5), so take this analysis with a grain of salt.
My inner investor remains upbeat on the US stock market and he has an overweight position in equities. Any corrections that occur are likely to be mild and he is unconcerned about minor squiggles in stock prices.
My inner trader has been very bullish, but he took some partial profits Friday by selling his high-beta small cap ETF. While he remains constructive on equities, the short-term risk-reward ratio has deteriorated sufficiently to take some chips off the table. Should the market weaken in the days ahead, he anticipates that he will be buying again.
Disclosure: Long SPXL
Nice to see you using SentimenTrader.com. They are the best sentiment indicator website.
As to the current high optimism reading, I have studied sentiment and have found that signals are different as we progress in a market cycle. At the beginning of a bull market sentiment stays in the optimistic to extremely optimistic range for the first year. It’s my contention that a new bull market started from the bear market low of February 11, 2016. So this high sentiment reading will not cause me to sell. The same reading next year will have me tactically selling and reducing equity exposure.
After the first year of a new bull market, the sentiment indicators swing from optimism to pessimism extremes and back again as bull market corrections come along. After the bull market peaks, sentiment can stay in the pessimistic to extremely pessimistic range for over a year without even briefly hitting optimism. If you look back at the 2008 chart period of the SentimenTrader.com chart you are using above, you will see that as well as the the consistent optimism in 2009 in the first year of the last bull market.
All this to say, if you just get in habit of using sentiment the same way at all stages of the market cycle you will make the mistake of selling too early in the new bull market and be frustrated by not getting a pessimistic low to get back in. You will also make the mistake in the next bear market of buying on a pessimistic low point too early in the new bear market and not get a bout of optimism to sell. You will sink with the rest of investors.
On the subject of whether we are in a new bull market or in the seventh year of the 2009 bull market, James Stack, newsletter writer extraordinare of Investech, (I’ve been a subscriber for 18 years) has seen all his key indicators turn positive. He is in the ‘seventh year’ camp and is confused because he says these indicators only turn positive like this at the start of a bull market. I see this commentary in other places too. Strategists are confused when they see economic stats and market action that doesn’t jive with their cherished ‘seventh year’ late cycle normal actions.
If the economy would have been slightly weaker last year to give us a shallow recession and if the S&P 500 would have had an extra couple of extra bad days and hit the magic 20% bear market decline like EVERY other index in the world (including the Russell 2000 small cap US index), then the strategists could see that a new bull market could and did start in February. But the American economy and stock market was slightly too strong (don’t get me started on the Moonless Economy and Stock Market) and strategists are wrong-footed and now off looking for reasons a bear market will happen in far-off places like China or Italian banks when they have a decently growing economy outside energy, low interest rates for longer and a generally nervous investing public. That is what the doctor orders for a bull market prescription.
Also, there is a general viewpoint that we are in a sideways secular range in the stock market indexes and we are now at the ceiling just like the year 2000 and 2007. The public is nervous that nasty decline is baked in the cake like those peaks and this time they won’t be fooled. WRONG. I was in the investment business in the 1970’s when we bounced off the 1000 Dow Jones Industrial Index ceiling four times before we finally broke out in 1982. That secular sideways action ended just like this one now, ended. People forget that companies grow. They pay dividends and keep some earnings to grow their business and pay higher dividends. Things compound, up and up. This is how the DJIA went from 50 in 1900 to 18,500 on Friday, one hundred and sixteen compounding years later..
All I can say is what I have been saying to my own company’s Chief Strategist about this new bull market, “if you diss it, you’ll miss it.”
Reading Ken’s comments I feel that Cam’s blog is being hijacked by Ken’s desire to propound on his knowledge. These tangential verbose statements have little relevance to what Cam has stated in the above letter. If my reading is correct Cam is stating that sentiment has become extremely bullish and there is a likelihood of a pullback. Sentiment indicators are best used for short to intermediate timing. They can also be used as an adjunct to oversold indicators thus providing an optimum period to enter or exit the market.
Cam thank you for your wonderful letter. It will help in future if you get can provide support and resistance points on the S&P 500 index and QQQ when you are expecting a pull back or a rally.
The logical support level for the S&P 500 would be a test of the breakout at 2120. Given the powerful momentum behind this rally, I`m not sure if we will even get there, though.
My comment about it being best to ignore overbought sentiment indicators in the first leg up in a new bull market is relevent to Cam’s post.
Since most people don’t think we have started a new bull market, I needed to add some proof statements around that belief of mine as well.
Just trying to help out. 🙂
Ken,
Keep up your good work. I enjoy reading your inputs, though I am here for Cam’s posting. =)
I for one appreciate Ken’s words.
Thanks. I am here for Cam’s brilliant work as well. But occasionally it hits an area of my interest and I find it hard/impossible to keep quiet.