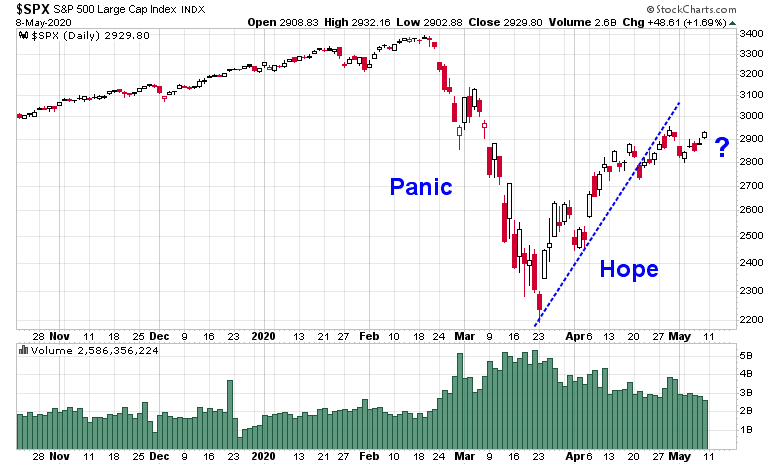
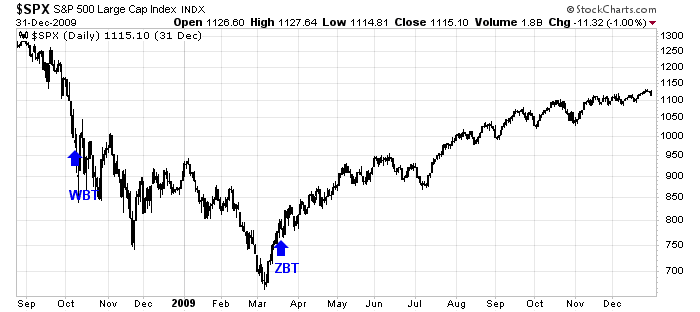
This crisis has so far gone through two phases of market psychology. The first phase was panic, as it became apparent that COVID-19 had become a global pandemic, and economies around the world were shutting down. Stock prices rebounded during the hope phase, supported by a flood of fiscal and monetary stimulus, and the hope that reopening the economy might bring some semblance of normalcy.
What’s the next phase of the market’s narrative, and how should investor position themselves? Here are a few ideas:
- Will the economy be able to reopen successfully?
- Will the trade war return, and what are its implications of the fight against COVID-19?
- The risks of a wave of bankruptcies, or worse, an Apocalypse of zombie companies.
- More European theatre: The German constitutional court decision’s threat to eurozone stability.
- The evolution of a business environment that is increasingly hostile to businesses.
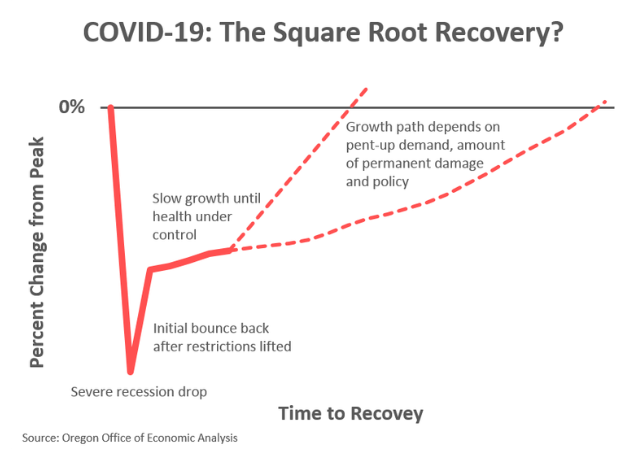
A successful reopen?
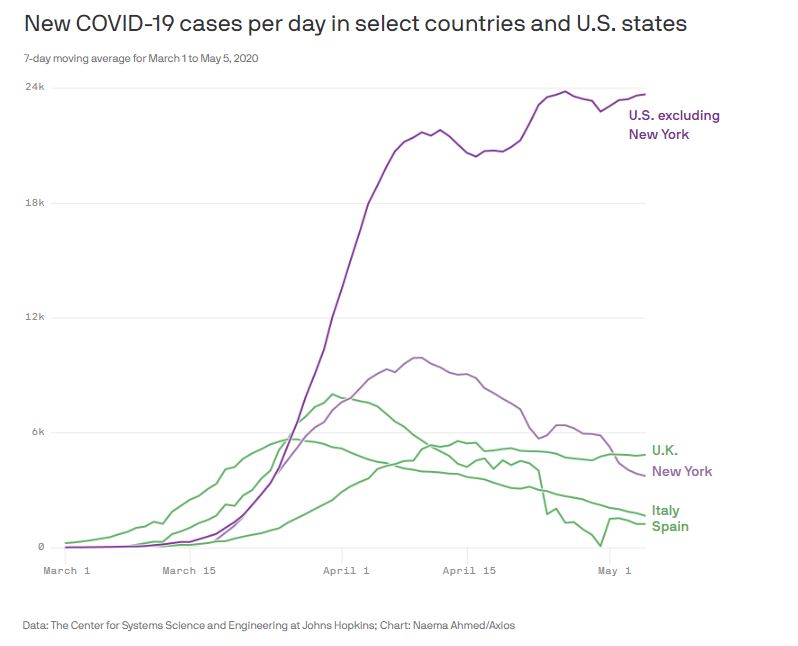
As various countries have begun to flatten and bend the COVID-19 infection and fatality curve, we are starting to see phased initiatives to reopen economies again all over the world. Within the US, different states are reopening at different speeds, but it is unclear whether the pandemic is fully under control outside of New York State.
The first risk is that COVID-19 is not under control within US borders. As well, the market is likely to look ahead and recognize that reopening does not equal normalization and growth is unlikely to continue as before. The New York Times reported that most states which are reopening failed to meet Trump Administration recommendations to resume activity.
Even if the reopening efforts were to be successful, Guggenheim Investments analyzed the output gap, which is the difference between actual GDP and potential GDP, and concluded that it will take years for growth to return to potential.
Assuming that there are no hitches in individual states’ initiatives to reopen their economies, there are plenty of other risks facing investors as well.
A trade war revival
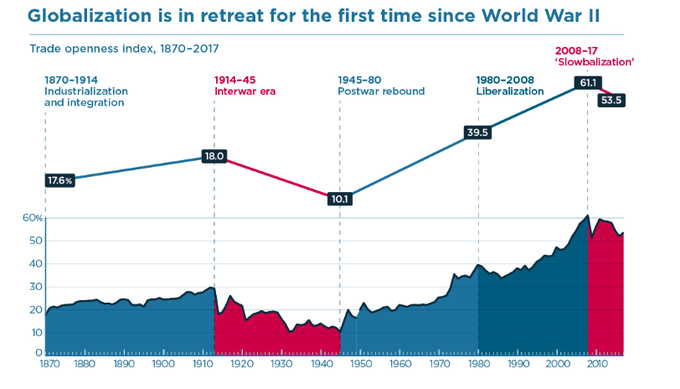
One of the key risks is the return of the trade war. Since the onset of the GFC, Douglas Irwin of the Peterson Institute documented globalization was in retreat. Trump’s arrival in the White House accelerated that trend as protectionist tendencies rose.
The COVID-19 pandemic is just the latest episode in a long trend. The Trump Administration has undertaken a two-pronged attack on China. The first is to blame China for its slow response to COVID-19, and to insinuate that the virus was deliberately released from a lab in Wuhan (via CNBC):
In the U.S., critics allege Beijing wasn’t upfront about the dangers of the virus, was too slow to respond and under-reported the extent of the outbreak within its borders.
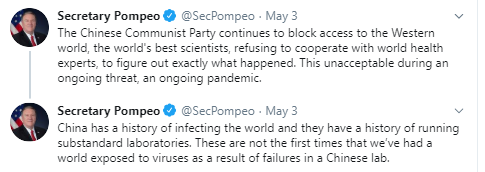
In the past week, President Donald Trump said he believed that China’s “mistake” was the cause of the global pandemic, while Secretary of State Mike Pompeo said “a significant amount of evidence” suggested that the virus originated in a Wuhan laboratory.
Secretary of State Mike Pompeo’s language was even more provocative, which was supported by Trump last Sunday in a virtual town hall on Fox News.
Even as Pompeo cited American intelligence sources for his assertions about the source of the virus from the Wuhan lab, an article in Australia’s Sydney Morning Herald revealed that Australian officials found the source of the claim came from open news sources, and not from intelligence channels.
Senior members of the Australian intelligence community told The Sydney Morning Herald and The Age a research document shared in political circles under the Five Eyes intelligence arrangement was mostly based on news reports and contained no material from intelligence gathering.
A 15-page “dossier” has been widely quoted by local and international media about China’s alleged cover-up of the virus. Australian intelligence officials have since identified a research report which was based entirely on open source material. The officials said it was likely the reports were the same.
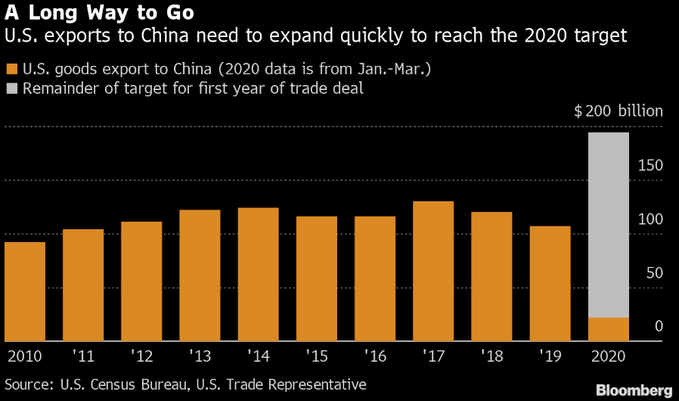
The second threat is an escalation of the trade war. To no one’s surprise, China is falling far short of the import targets because of its economic slowdown. Trump has threatened to scuttle the Phase One deal inked in January. American and Chinese negotiators discussed the problem on Friday and issued a statement that “good progress is being made on creating the governmental infrastructures necessary to make the [Phase One] agreement a success” . Trump said on Wednesday that he would decide within the next two weeks if he is happy with how the deal is progressing.
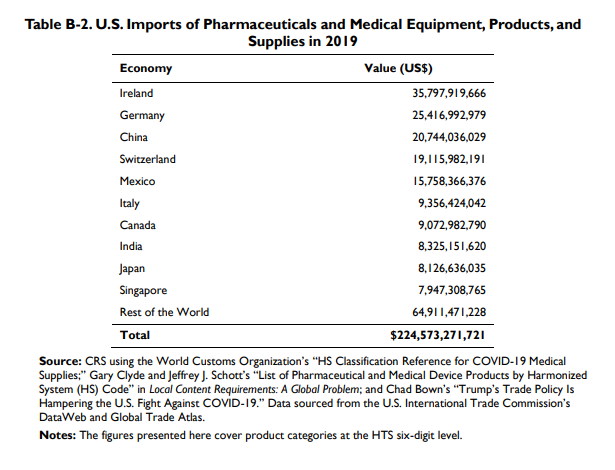
Notwithstanding the fact that the last thing the global economy needs is more protectionism, this threat creates complications against the fight against COVID-19. A Congressional Research Service report study that Germany and China accounts for 11% and 9%, respectively, of US imports of medical equipment and pharmaceuticals.
In particular, China accounts for a substantial portion of the supply chain for the many pharmaceuticals and chemical drug precursors.
While these supply chain vulnerabilities highlight the desire of American negotiator Robert Lightizer to return jobs back to American shores, they nevertheless create gaping holes in the global preparedness in the fight against COVID-19.
The New York Times reported that of the roughly 90 initiatives to find a vaccine against COVID-19, seven are undergoing clinical trials. Notwithstanding the obstacles of these efforts, one roadblock that is likely to slow down research is the Trump Administration’s suspicion of intellectual property theft by Chinese researchers.
In an era of intense nationalism, the geopolitics of the vaccine race are growing as complex as the medicine. The months of mutual vilification between the United States and China over the origins of the virus have poisoned most efforts at cooperation between them. The U.S. government is already warning that American innovations must be protected from theft — chiefly from Beijing.
“Biomedical research has long been a focus of theft, especially by the Chinese government, and vaccines and treatments for the coronavirus are today’s holy grail,” John C. Demers, the assistant attorney general for national security, said on Friday. “Putting aside the commercial value, there would be great geopolitical significance to being the first to develop a treatment or vaccine. We will use all the tools we have to safeguard American research.”
Even if a vaccine were to be found, the resultant risk-on rally may be cut short because of supply chain and production problems.
Even when promising solutions are found, there are big challenges to scaling up production and distribution. Bill Gates, the Microsoft founder, whose foundation is spending $250 million to help spur vaccine development, has warned about a critical shortage of a mundane but vital component: medical glass.
Without sufficient supplies of the glass, there will be too few vials to transport the billions of doses that will ultimately be needed.
Even if there are no production problems, distribution will be a challenge. The Washington Post reported that there is a scramble among American hospitals to get doses of the experimental Gilead drug remdesivir. Can you imagine the chaos if a vaccine became available, but in only limited supply? For policy makers, the next key question after a vaccine is available becomes, “There are over 300 million people in the US, and 7.8 billion people around the world. Who gets the first doses?”
Given the stakes, it is no surprise that while scientists and doctors talk about finding a “global vaccine,” national leaders emphasize immunizing their own populations first. Mr. Trump said he was personally in charge of “Operation Warp Speed” to get 300 million doses into American arms by January.
Already, the administration has identified 14 vaccine projects it intends to focus on, a senior administration official said, with the idea of further narrowing the group to a handful that could go on, with government financial help and accelerated regulatory review, to meet Mr. Trump’s goal. The winnowing of the projects to 14 was reported Friday by NBC News.
There is a significant chance that the breakthrough will not occur on American soil, or by US affiliated researchers. It would be political suicide for the leader of any country whose researchers that develop a vaccine to refrain from export controls before that country’s population receives the first doses.
But other countries are also signaling their intention to nationalize their approaches. The most promising clinical trial in China is financed by the government. And in India, the chief executive of the Serum Institute of India — the world’s largest producer of vaccine doses — said that most of its vaccine “would have to go to our countrymen before it goes abroad.”
In light of the rising level of animosity between Beijing and Washington, a discovery by Chinese researchers is likely to set the stage for a debilitating trade conflict.
In China, the government’s instinct is to showcase the country’s growth into a technological power capable of beating the United States. There are nine Chinese Covid-19 vaccines in development, involving 1,000 scientists and the Chinese military.
China’s Center for Disease Control and Prevention predicted that one of the vaccines could be in “emergency use” by September, meaning that in the midst of the presidential election in the United States, Mr. Trump might see television footage of Chinese citizens lining up for injections.
“It’s a scenario we have thought about,” one member of Mr. Trump’s coronavirus task force said. “No one wants to be around that day.”
If you thought the Sino-American trade war spooked the markets, wait for the second round, if a single country were to develop a vaccine and imposed export controls.
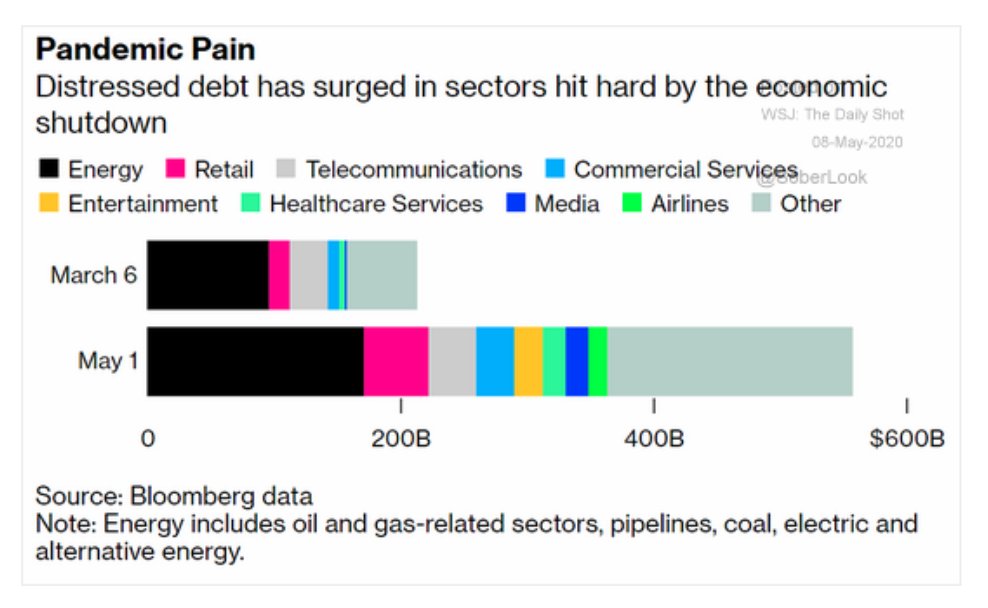
Bankruptcy, or Zombie Apocalypse?
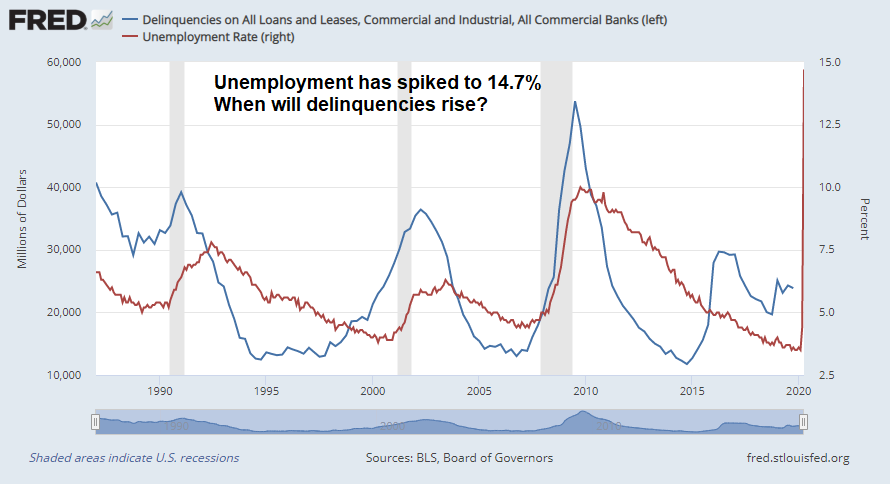
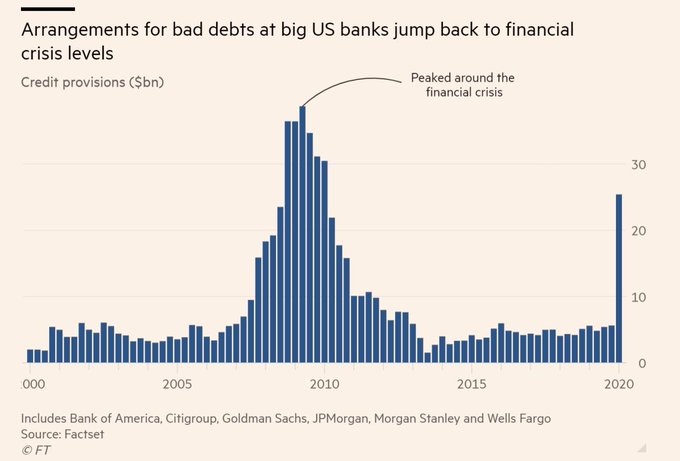
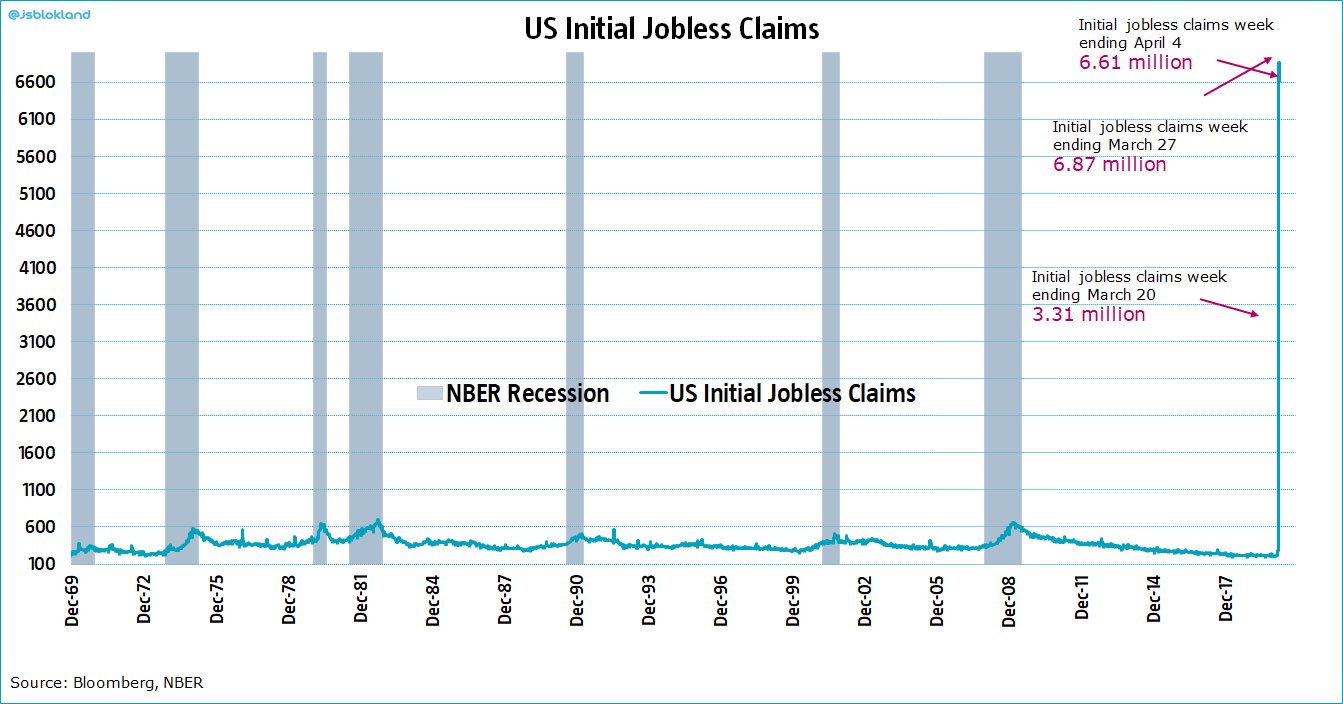
Another narrative the market may focus on in the near future is the prospect of a bankruptcy epidemic. In the past, loan delinquency rates have been highly correlated with the unemployment rate, with delinquency either leading or coincident with unemployment. As the economy hit a sudden stop in the latest crisis, this time really is different. Unemployment has spiked, but the delinquency rate has not.
What about the Fed? Hasn’t central bank action put a floor on markets, and reduced the risk of bankruptcies?
To answer that question, think of the process when a company files for bankruptcy protection under a provision like Chapter 11. The first question that creditors need to decide upon is whether the company has too much debt, or a bad business model. If the business is viable without debt, the solution is some combination of restructuring of the capital structure, composed of debt write-downs and debt-for-equity swaps, and probable layoffs to right size the company. If, on the other hand, the company is not viable because its business has been permanently impaired, no amount of debt restructuring can save it.
Central bank support of such firms will only create a class of walking zombie companies that are so burdened with debt they will collapse the minute policy support is withdrawn. Even if the economy were to recover, don’t count on the zombies to be a source of growth. They are unlikely to expand, hire new employees, or invest in new equipment.
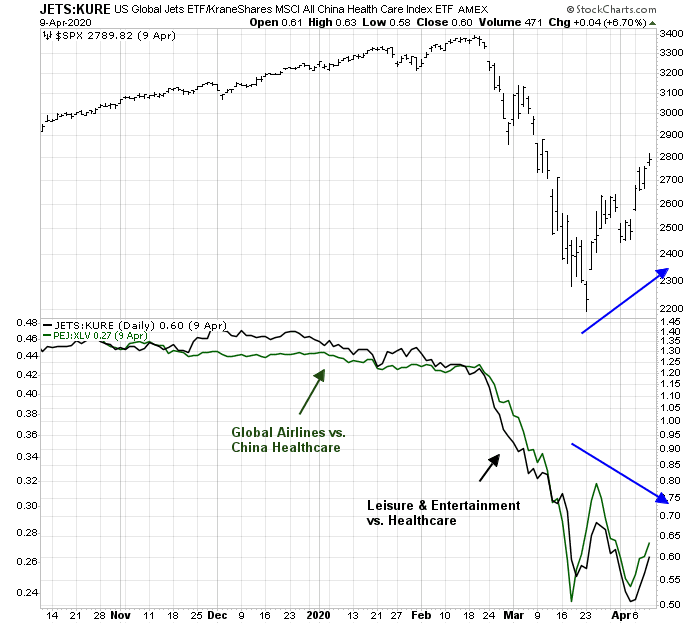
The recent Berkshire Hathaway shareholder meeting was enlightening for investors in many respects. Warren Buffett reported on what Berkshire’s companies are seeing in their businesses. He revealed that some of the sales losses are permanent; some weak businesses are not coming back; some are hurt by customer behavior changes that will stick, e.g. airlines; and not all of the job losses will be recouped. Here is the key point. Buffett is known to invest in companies with a strong moat, or competitive position, at attractive prices. If the business outlook for Berkshire’s portfolio of wide moat companies is so weak, what about all the companies with little or no moats?
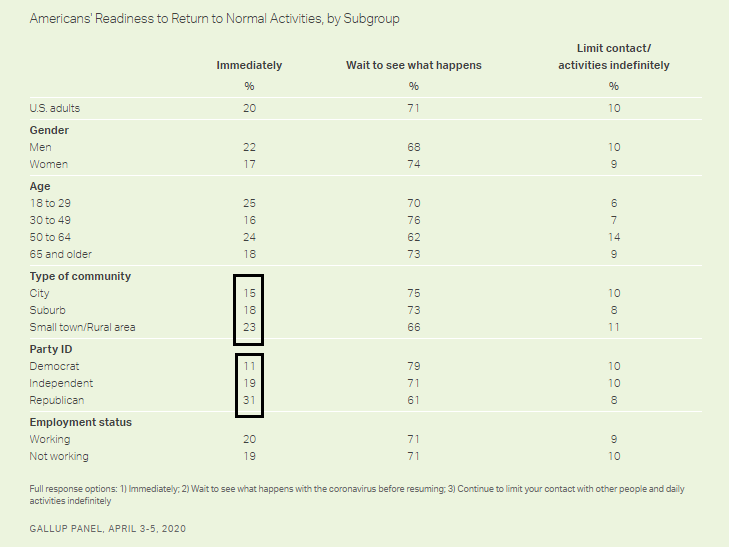
One group of especially vulnerable companies without moats are small businesses, which tend to be low-margin and high volume enterprises. Most are not well capitalized. While there is an array of government support to help keep them alive, these programs are only band-aids. Even if the reopening efforts are successful and there is no second wave of infections, sales are not going to rebound strongly. We are likely to see either a wave of small business bankruptcies in the coming months, or a herd of small businesses operating as zombies that will not be a source of employment or business investment growth.
A recent working paper by some academics at the Becker Friedman Institute at the University of Chicago outlined the risks posed by small business failures to the economy. The team used ADP employment data to analyze employment changes during the initial phases of the pandemic and concluded that mass small business failures is likely to depress the speed of the subsequent recovery.
While the majority of the employment decline occurred among continuing businesses, measured business exit—or temporary suspension of operations—plays a substantial role in the overall collapse, particularly among smaller businesses. This is an alarming pattern which may have relevance for the pace of recovery. One would hope that many of the businesses we observe suspending activities will resume operations in the near future. If not, the jobs destroyed by exiting businesses are permanently gone, requiring extra growth among surviving businesses or extra business entry to replace them. Jobs and the associated personal toll of unemployment are not the only costs of business failure. From the perspective of business owners, the failure of a business means the loss of income and probably a large share of household assets. From the perspective of the macroeconomy, business failures mean the destruction of intangible capital and even the loss of some physical capital, particularly in light of costly capital allocation. From the perspective of communities and neighborhoods, business failure means dramatic, sometimes irreversible changes to the local physical economic landscape. While some recessions see elevated failure of low-productivity businesses (thereby enhancing aggregate productivity), we have no reason to expect exit selection to function constructively in the current environment, where business revenue losses are determined by the rapid onset of a health crisis.
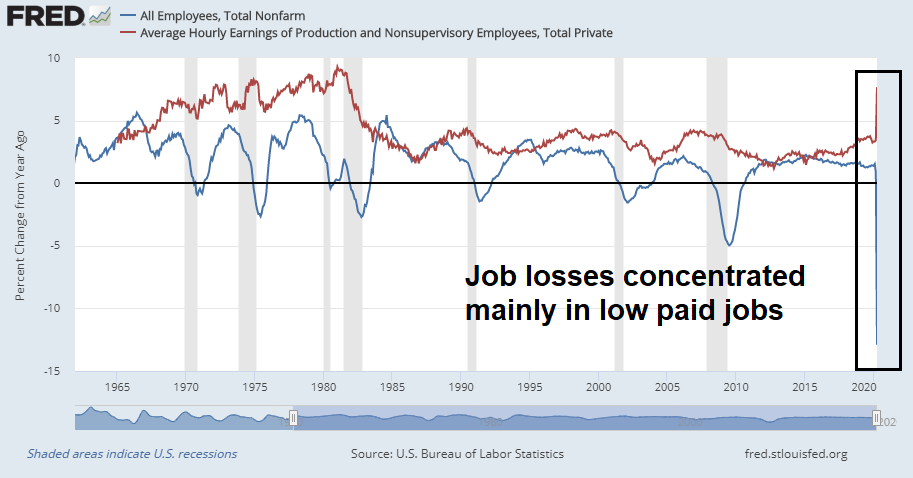
The study also found that job losses are affecting the lowly paid workers disproportionately:
These employment declines are not evenly spread throughout the wage distribution. The overwhelming brunt of the employment decline is concentrated among lower-wage workers. The bottom 20 percent of wage-earners account for nearly 36 percent of all job loss. These differences persist even after controlling for differential declines by industry, business size, worker age, and location. The large exit of low-wage workers from the labor market has resulted in average wage per worker rising by five percent in the weeks following the start of the recession. However, all of this is driven by selection effects. Following a given worker through the start of the recession, we find that the wages of continuing workers have been flat. At this point of the recession, essentially all of the adjustment has occurred on the quantity margin. Most of the quantity adjustment has been on the extensive margin of labor supply. However, the intensive margin of labor supply has also declined slightly.
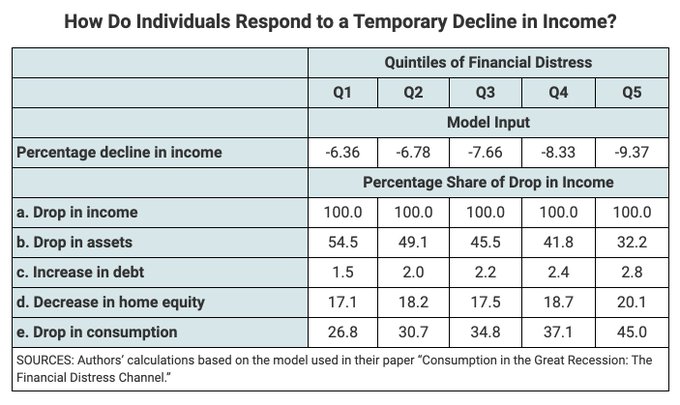
The uneven effects on employment will cascade through the economy. The St. Louis Fed modeled the effects of the loss of income on individual households. For every $100 of income loss, the drop in consumption varies from $26.80 for the richest households (Q1) to $45.00 for the poorest (Q5). Watch for a crash in consumption, and a wave of personal bankruptcies in the near future.
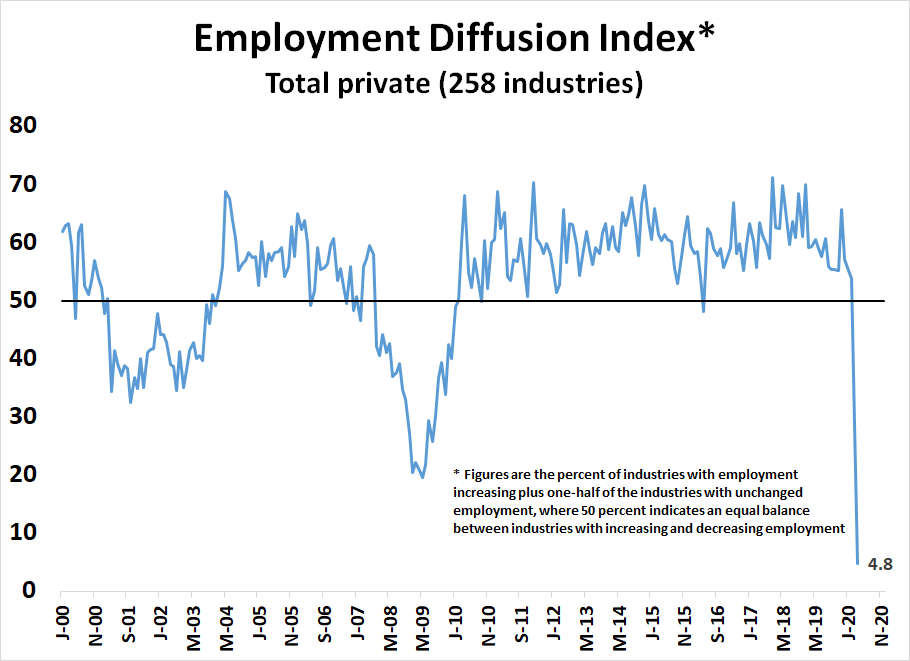
The April Employment Report shows a loss of -20.5 million jobs and the unemployment rate spike to 14.7%, both of which were better than expectations pf =22/0 million and 16% respectively. Before everyone gets overly excited about the NFP beats, the plunging Diffusion Index is far more worrisome, because it is an indication of the widespread nature of job losses that is far worse than past recessions.
In short, the Fed can’t solve all the problems. Greg Ip of the WSJ rhetorically asked recently, “Is This a Liquidity Crisis or a Solvency Crisis? It Matters to Fed”.
In a liquidity crisis, otherwise healthy firms collapse because they can’t access credit. The Fed can resolve such a crisis because it can print and lend unlimited amounts of money. In a solvency crisis, companies can’t survive no matter how much they can borrow: they need more revenue. The Fed can’t solve that.
Another threat to eurozone stability
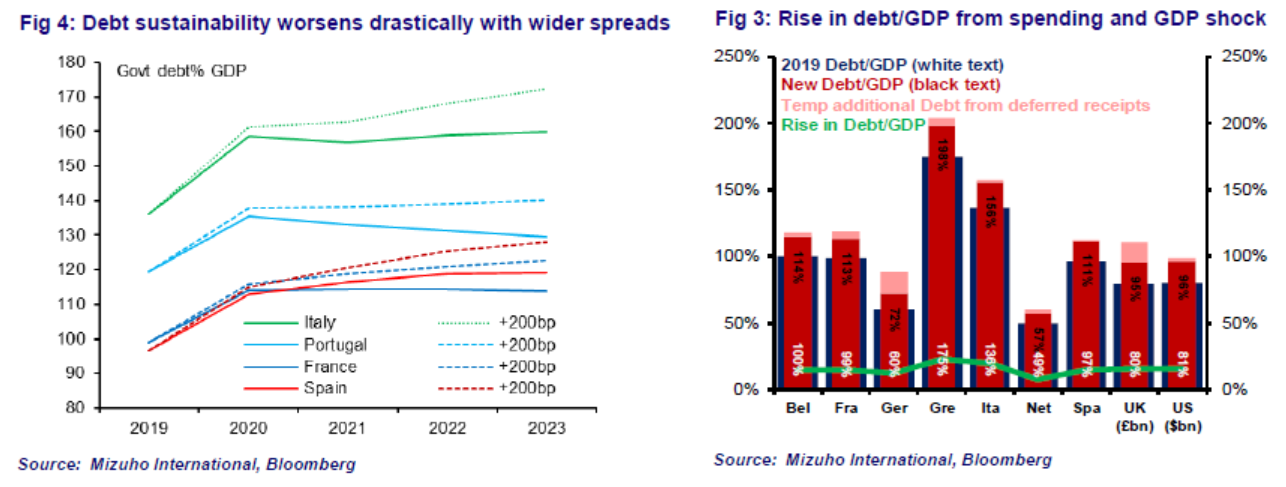
Another issue bubbling under the surface comes from across the Atlantic in the EU. Just when you thought the problem had been resolved, the COVID-19 pandemic is raising the threat of eurozone stability all over again.
The ruling of the German constitutional court that the ECB’s bond buying program is contrary to the German constitution, and the ECB must justify its actions was a shocker. The decision is a challenge to the supremacy of the European Court of Justice and creating a parallel legal order for the Bundesbank. It also puts Jens Weidmann, the head of the Bundesbank and a member of the ECB governing council, in a difficult position. Wiedmann has been a hawk and frequently opposed the ECB’s bond buying programs, but he now has to justify to the German court the programs that he opposed in the past.
Bloomberg reported that there is no shortage of ECB rebuttals to the German constitutional court.
The constitutional court’s demand on Tuesday that the ECB justify its multi-trillion-euro bond-buying plan within three months took investors and economists by surprise. They largely expected Germany to follow the assessment by the European Union’s highest tribunal that the program is legal.
Instead, the judges cited numerous arguments against ultra-loose monetary policy, including that it unduly benefits the banks, supports zombie firms, and penalizes savers.
Yet those charges have already been tested by researchers, and the ECB has published hundreds of pages on the impacts of its crisis-fighting measures.
ECB president Christine Lagarde short-circuited the response Thursday by stating the central bank was answerable to the European parliament and not to the German constitutional court. In the meantime, uncertainty has risen, and so have the peripheral bond spreads which threatens debt sustainability.
In another words, it’s another act in the usual European theatre. In the past, back room deals are made while the crisis plays out in the news. The participants are all very European in their outlook and no one wants the EU to fall apart.
Will that happen again this time, and what damage will that inflict on the markets and eurozone stability?
An increasingly hostile business environment
Finally, the most worrisome trend investors will have to look forward to is an increasing hostile environment for businesses, starting with rising labor costs. Scott Grannis at Calafia Beach Pundit complained that the minimum wage is now $25 an hour because of government support and subsidies:
Thanks to the generosity of Congress (it’s always easy to spend other people’s money, isn’t it?), the average weekly unemployment check now resides in the princely neighborhood of $1000 per week, or $25 per hour. Congress has effectively raised the minimum wage to $25/hr. by boosting weekly unemployment checks by $600/wk through the end of July.
What, you say?! Consider: for any business in trouble because of the shutdown, the very best solution is to fire or lay off employees, since most, if not all, of them will be able to collect unemployment benefits which are the equivalent of $25 per hour through the end of July. The 30-million-strong army of the recently unemployed now work for the government, you see. Their job? To stay at home and watch TV all day, or whatever else suits their fancy. Do nothing, and the government will pay you $25 per hour. Not a bad job, if you can just get fired or laid off! Think of it as a paid vacation with time-and-a-half! And it’s all for a good cause: to win the war against the coronavirus.
Here is Warren Buffett’s indirect counterpoint to Grannis’ complaint. CNBC reported that Buffett responded to a question from actor Bill Murray.
Murray asked via Quick: “This pandemic will graduate a new class of war veterans: Health care, food supply, deliveries, community services. So many owe so much to these few. How might this great country take our turn and care for all of them?”
Buffett: “We won’t be pay to pay, actually. It’s like people that landed at Normandy…The poor, the disadvantaged… They suffer, there’s an unimaginable suffering and at the same time they’re doing all these things. They’re working 24-hour days and we don’t even know their names…If we go overboard on something, we ought to do things that can help those people.”
While Grannis is correct that front-line workers will have a temporary minimum wage that is equivalent to $25 an hour. On the other hand, Buffett compared today’s front-line low-wage workers to soldiers who stormed the beach at Normandy. These are the delivery drivers who bring you the groceries while you work at home, the line cooks and restaurant servers who risk their lives by exposing themselves to infection, the meat cutters working at the shuttered and partially shuttered meat processing plants, and so on. Shouldn’t they be paid a risk premium for risking their lives to show up to work?
Regardless of your political opinion, the economic reality is labor’s bargaining power is rising, and employers will see upward wage pressures that compress operating margins. Already, Payday Report has identified 175 wildcat strikes since the beginning of March. This is the kind of labor action last seen that kind of labor action since the 1970’s and early 1980’s.
The terms of capitalism are changing. Bloomberg reported that Blackrock CEO Larry Fink expects a wave of bankruptcies and rising taxes.
Fink said on the call with clients of a wealth advisory firm that bankers have told him they expect a cascade of bankruptcies to hit the American economy…lifting the 21% corporate rate signed into law as part of 2017’s tax overhaul to about 28% or 29% next year…[and\ tax rates for individuals going up.
CNBC reported that Leon Cooperman also higher tax rates, as well as tax code changes like the elimination of carried interest and the ability to roll over real estate sales tax free, and rising capital gains rates.
Billionaire investor Leon Cooperman said Thursday on CNBC’s “Squawk Box” that the coronavirus crisis will “likely” change capitalism forever and that taxes will need to be raised soon.
“When the government is called upon to protect you on the downside, they have every right to regulate you on the upside,” Cooperman said. “So capitalism is changed.”
The pandemic has changed the Overton window of acceptable political discourse. The fault lines of economic inequality have been exposed by the pandemic, which evaporated over 20 million jobs almost overnight. If die-hard capitalists like Fink and Cooperman believe that capitalism is changing, who are mere mortals like us to disagree? More importantly, when will the market begin to focus on these changes?
Investment implications
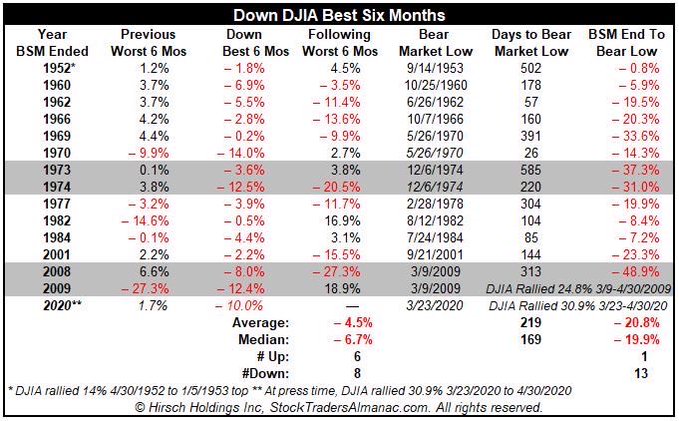
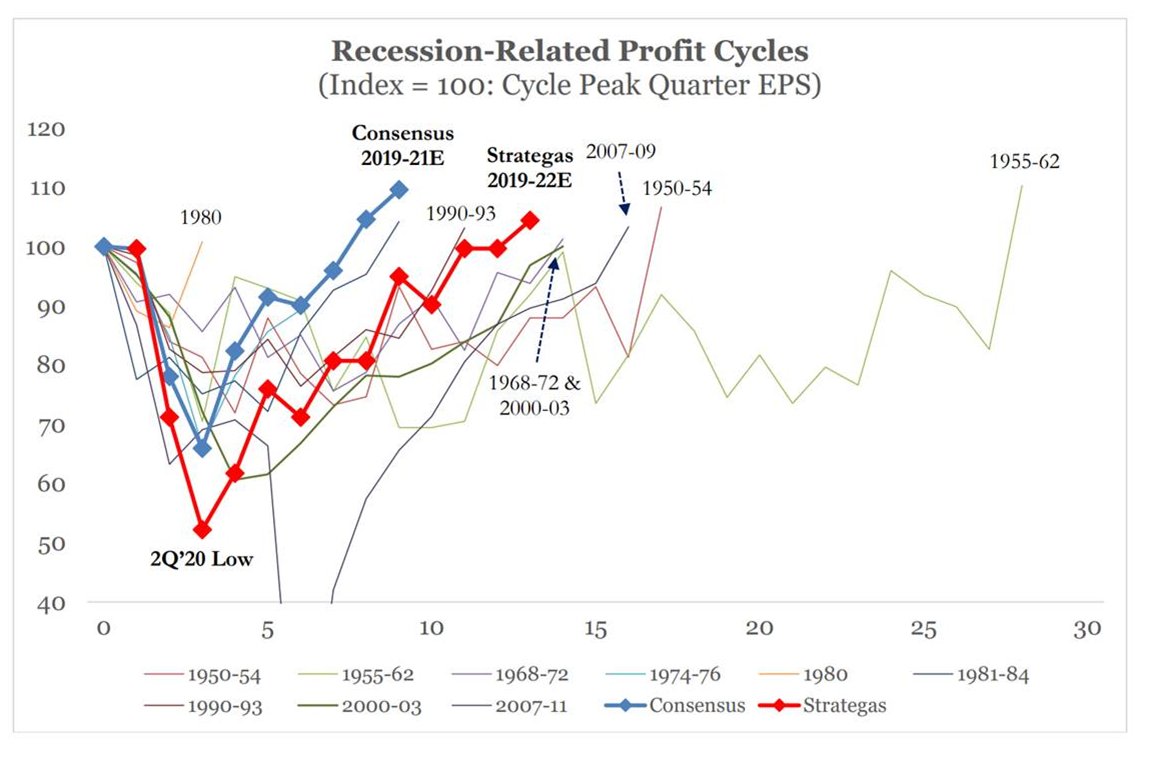
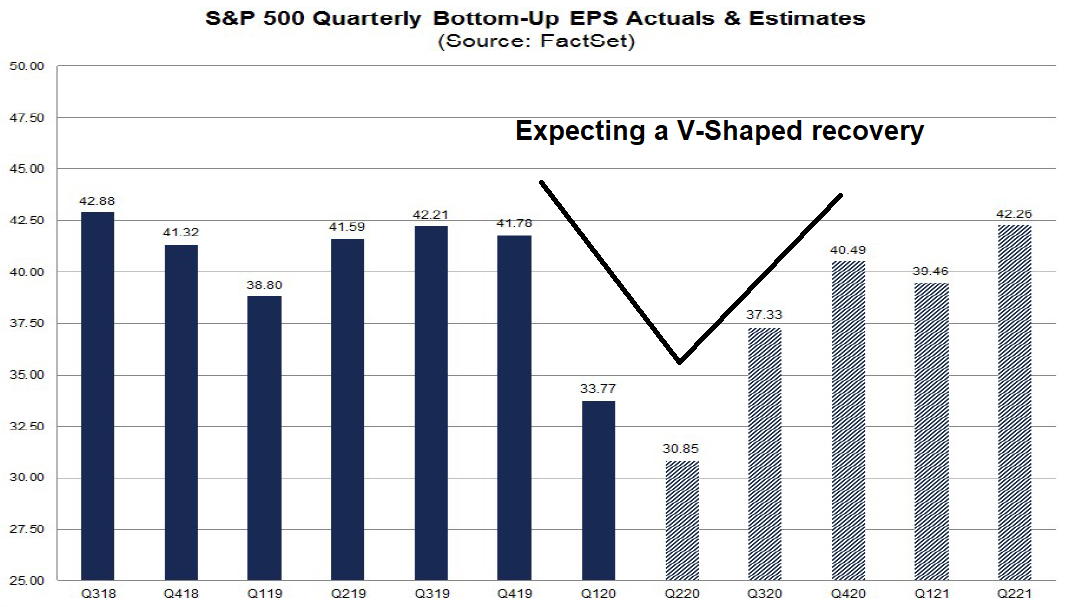
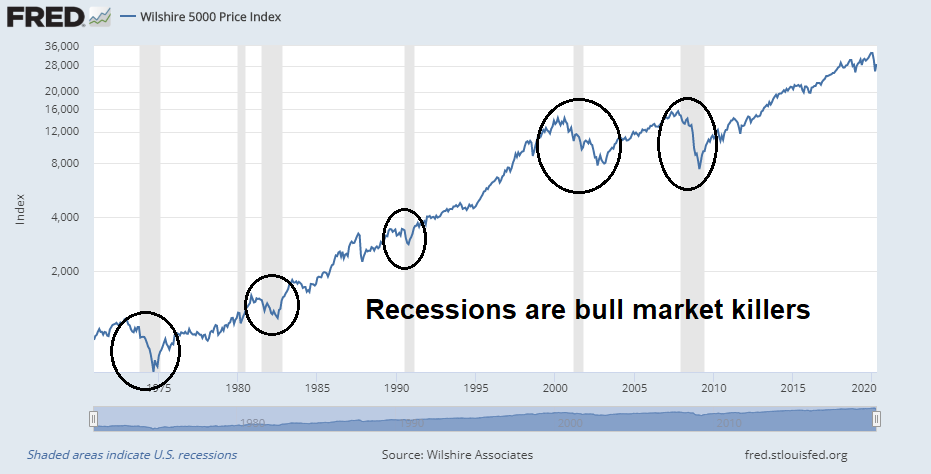
This is a recession, and recessionary bear markets take more than just a few weeks to resolve themselves, regardless of how much the Fed or Congress stimulates the economy. That said, this is not a long drawn-out economic depression. There are about 90 different initiatives to find a COVID-19 vaccine, and in all likelihood, at least one of them will be successful. The panic will pass, and economic growth will recover.
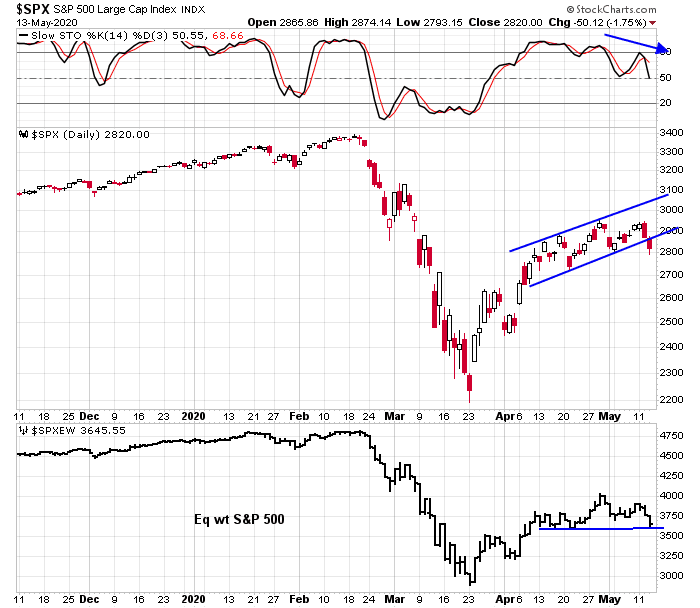
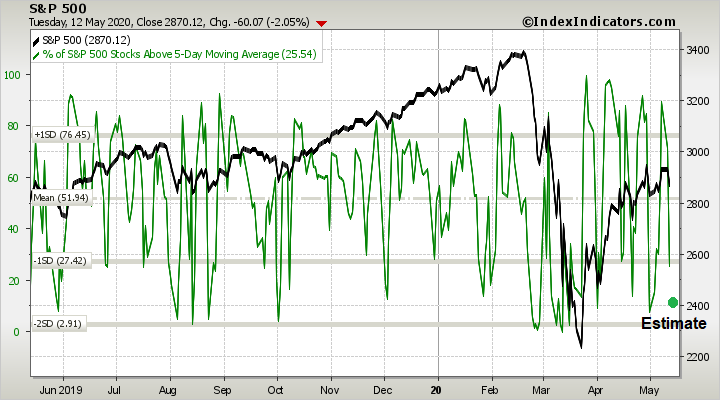
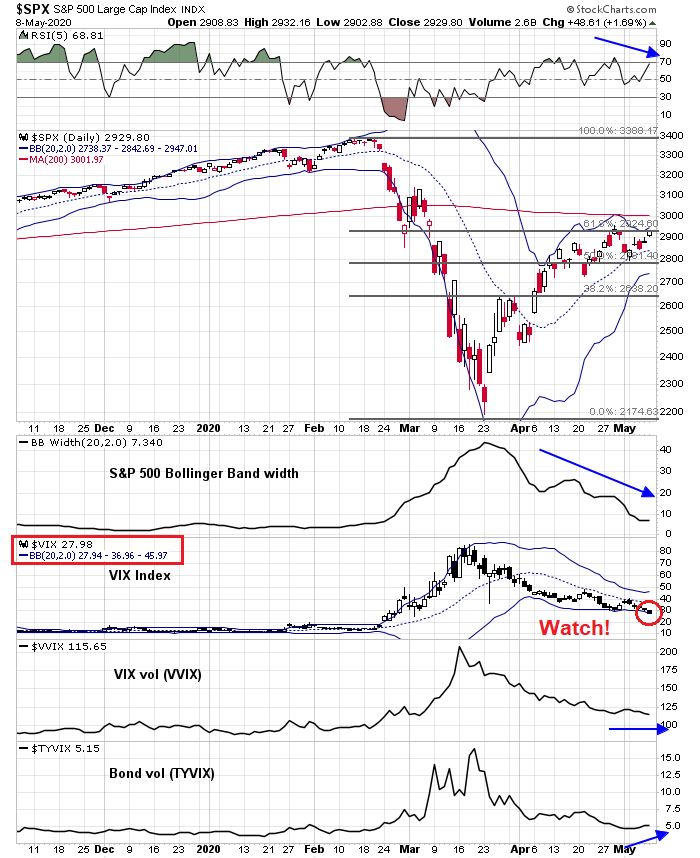
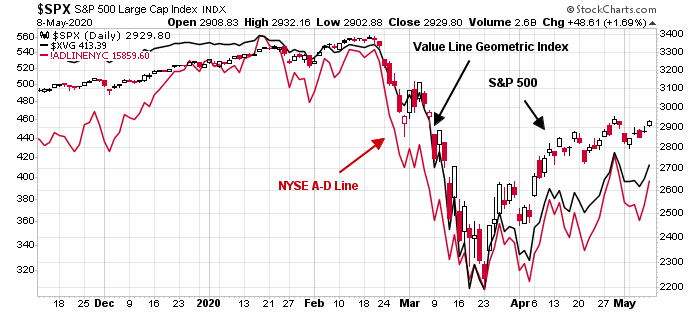
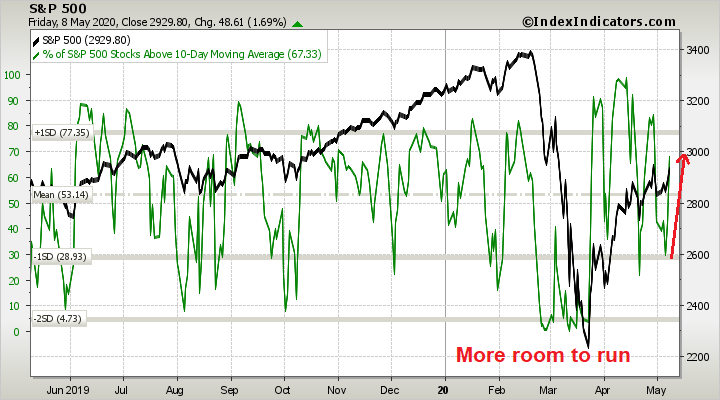
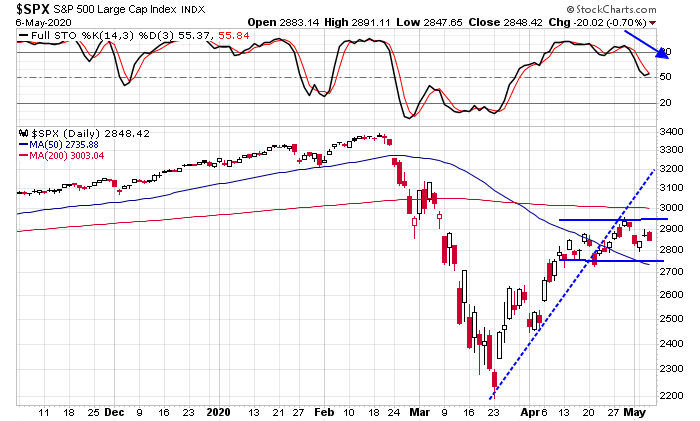
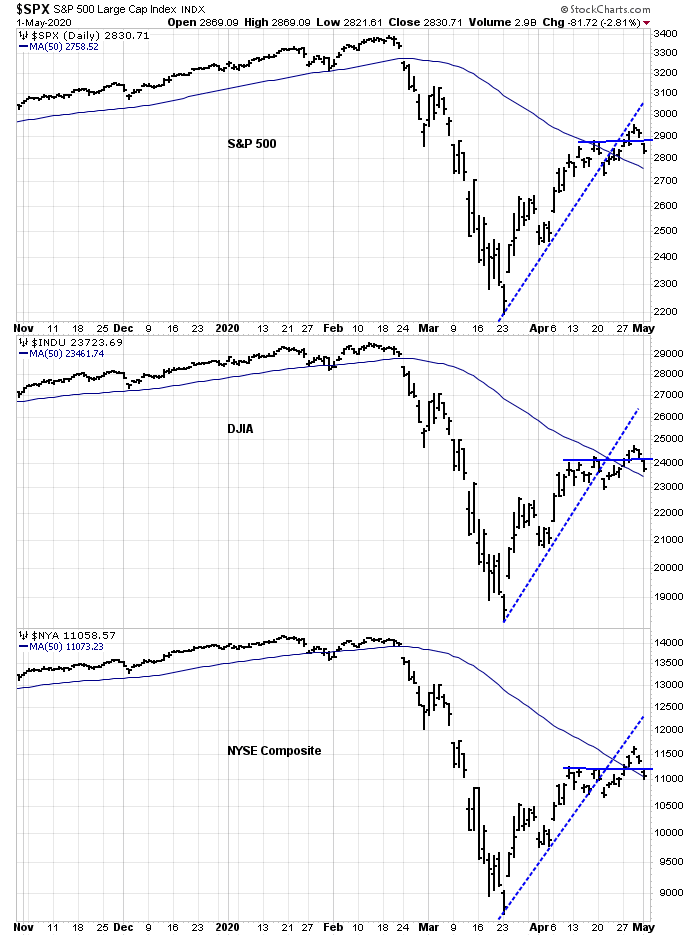
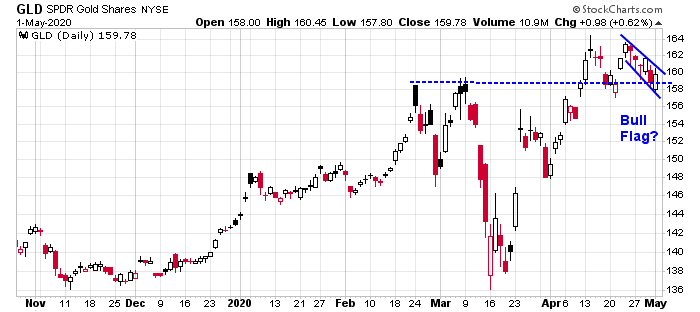
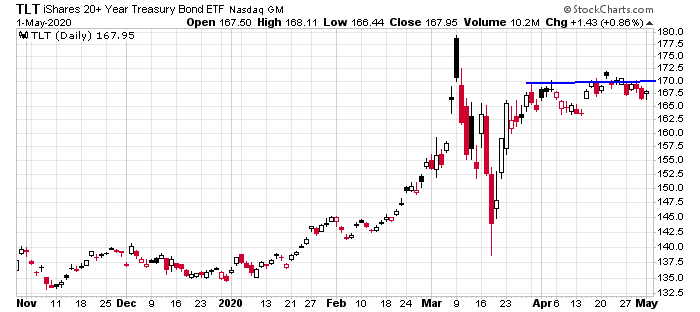
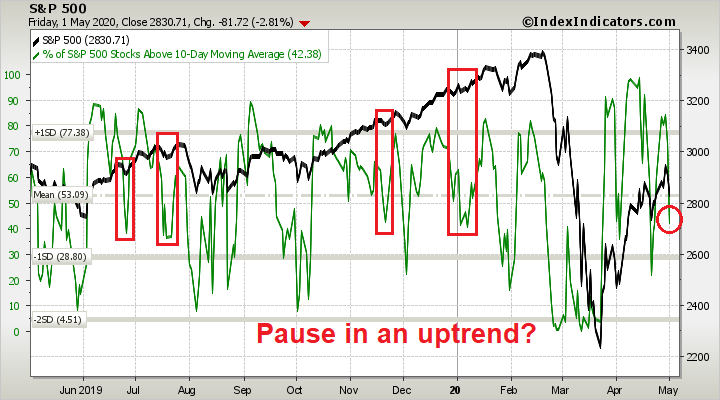
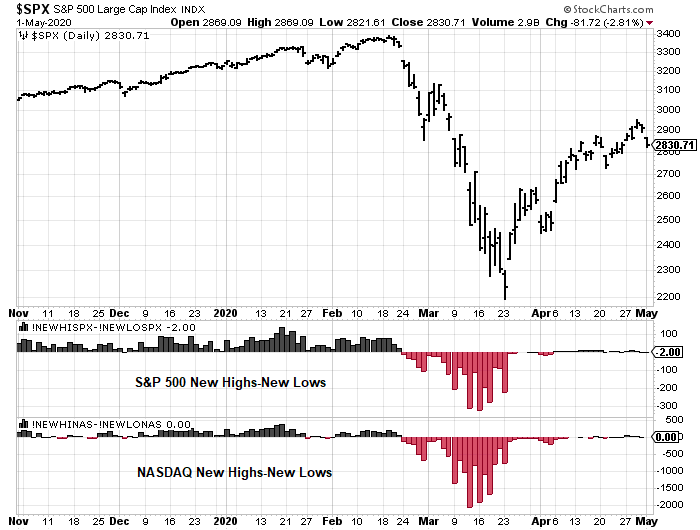
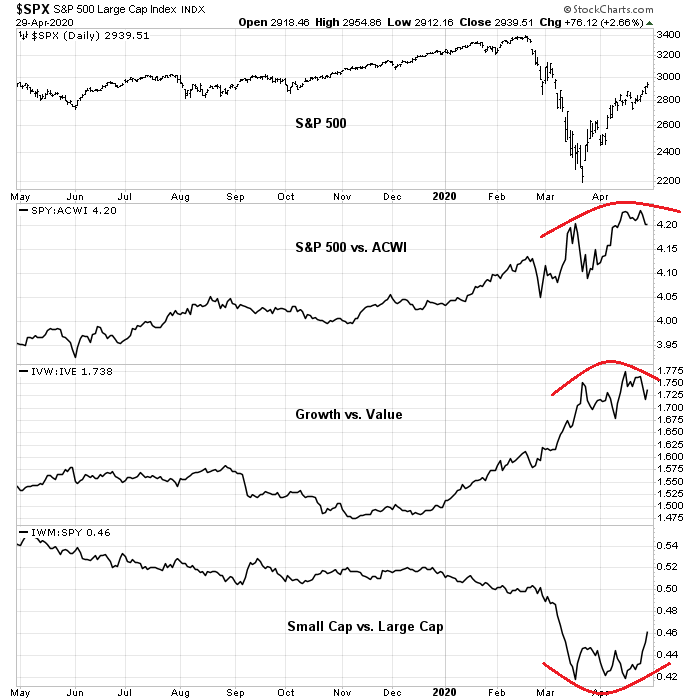
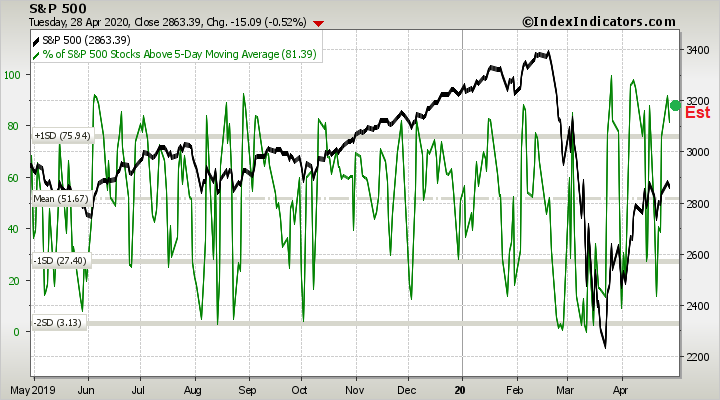
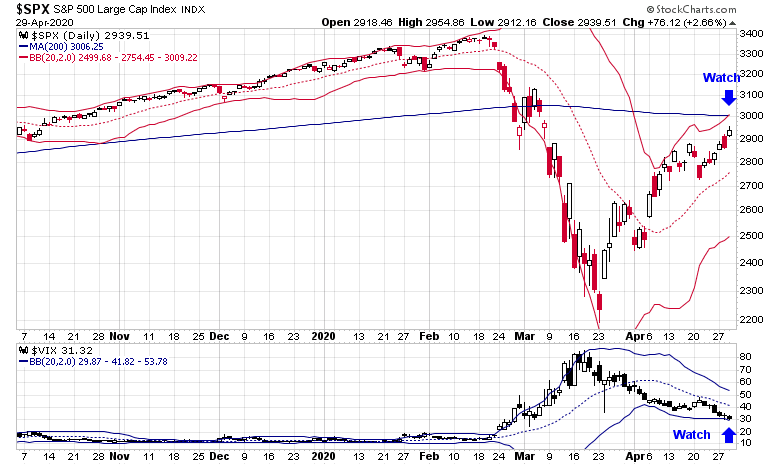
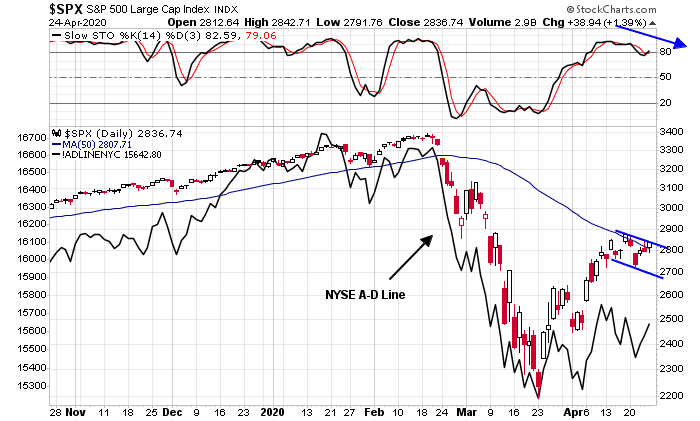
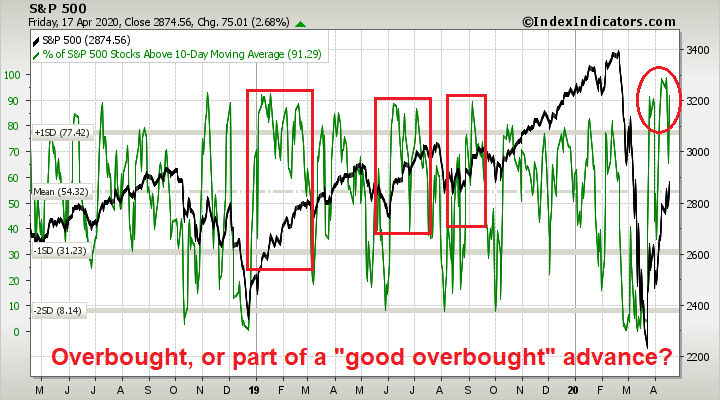
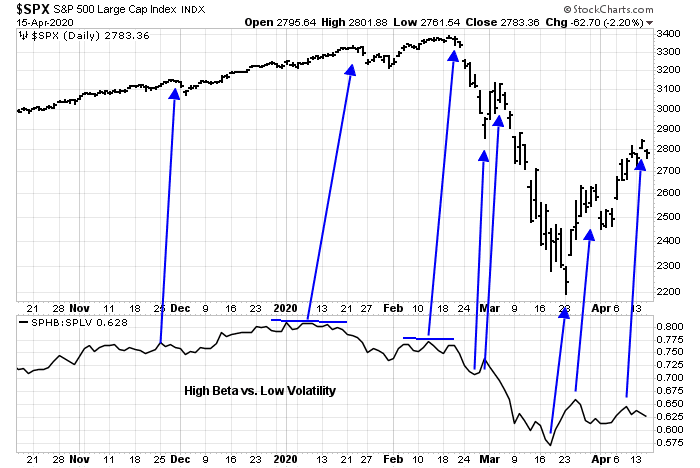
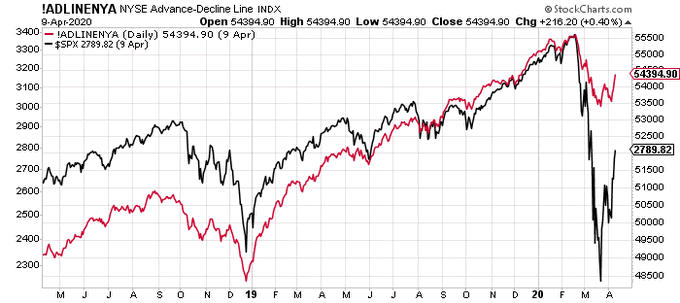
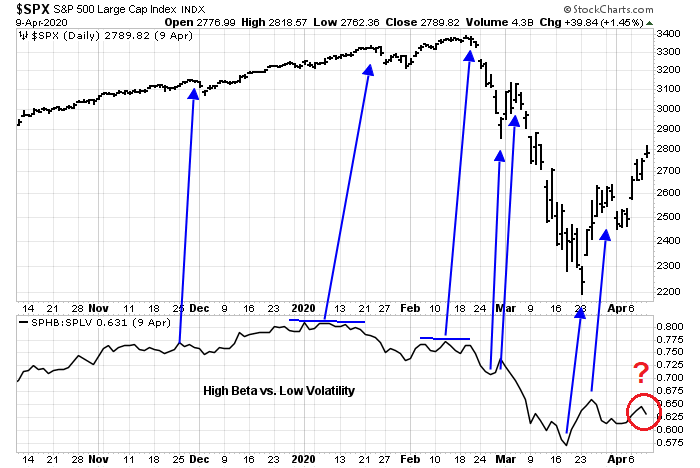
The stock market has recovered and it is stabilizing after its initial panic phase. It is now caught between a bullish perception of the Fed’s unlimited liquidity and the bearish perception of uncertainty over the economic economy and resolution of the pandemic. If the bulls were really in charge and Fed liquidity were dominant, the index would be in an uptrend, but it broke down from its uptrend line in April and it is now trading sideways. We are likely in for a period of consolidation until psychology starts to focus on the next narrative, after the hopes for reopening and recovery play out.
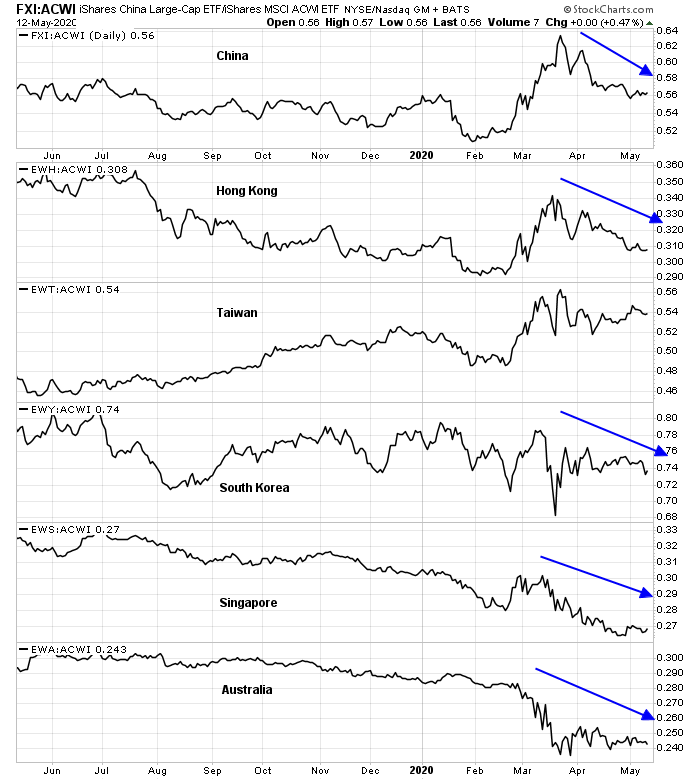
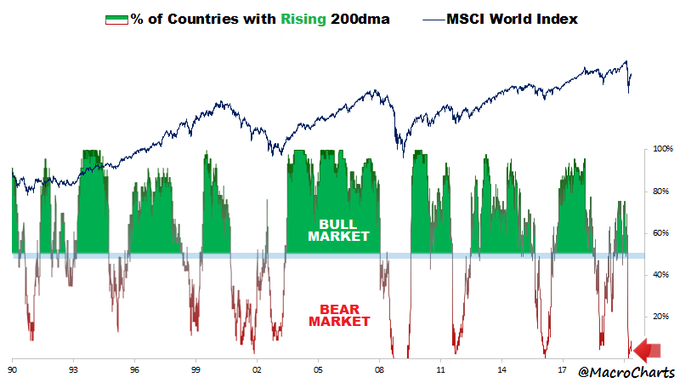
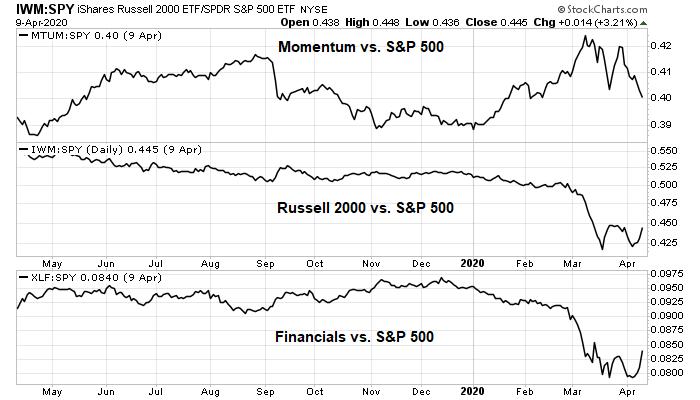
From an intermediate term perspective, global stock markets have much work to do before they can show that the bulls are in charge. Macro Charts pointed out that virtually all global markets are in downtrends, as defined by a falling 200 day moving average.
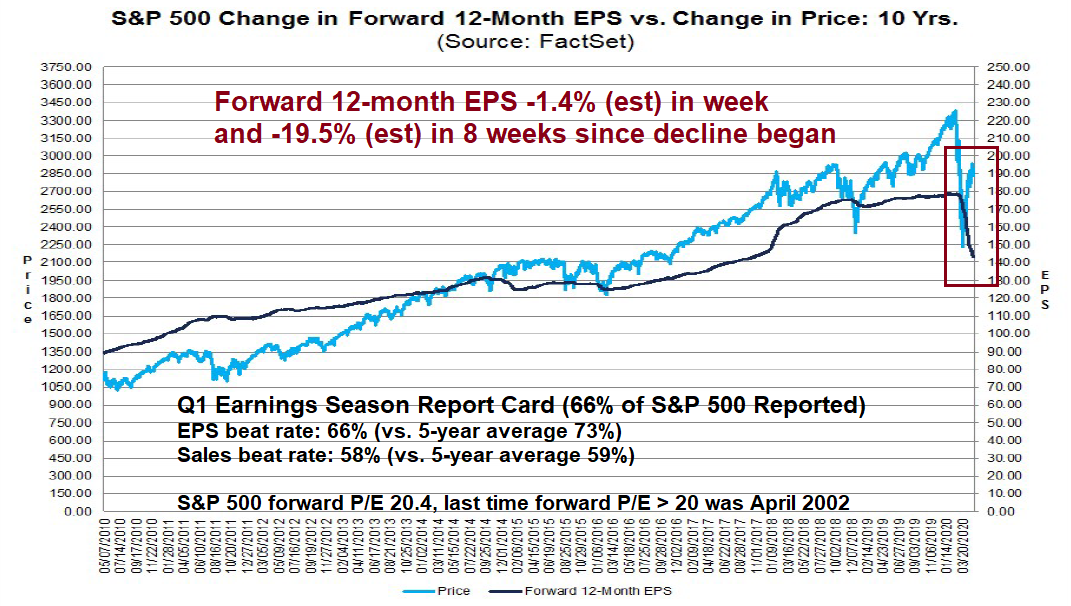
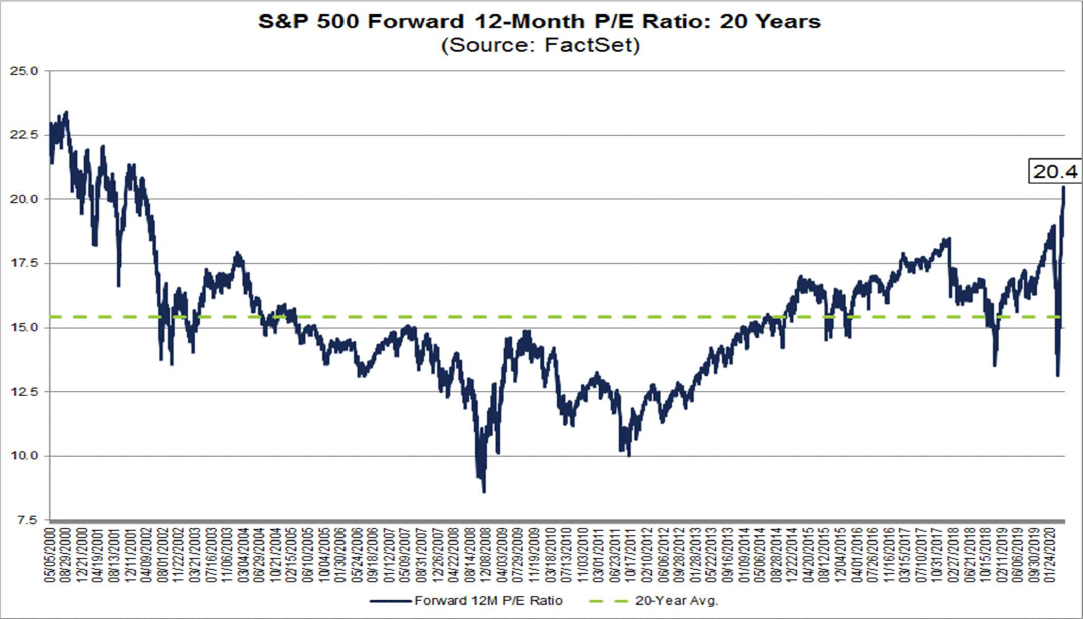
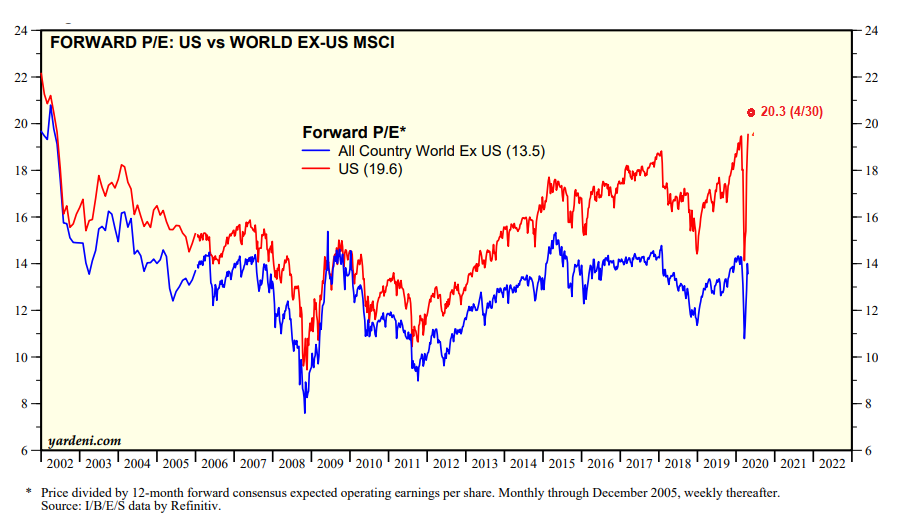
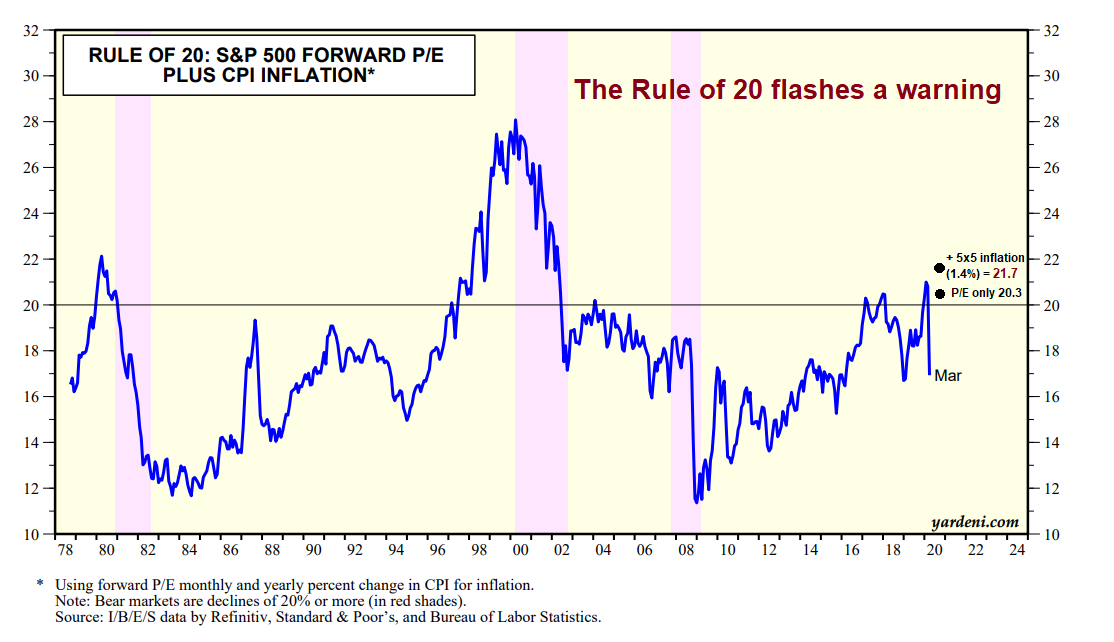
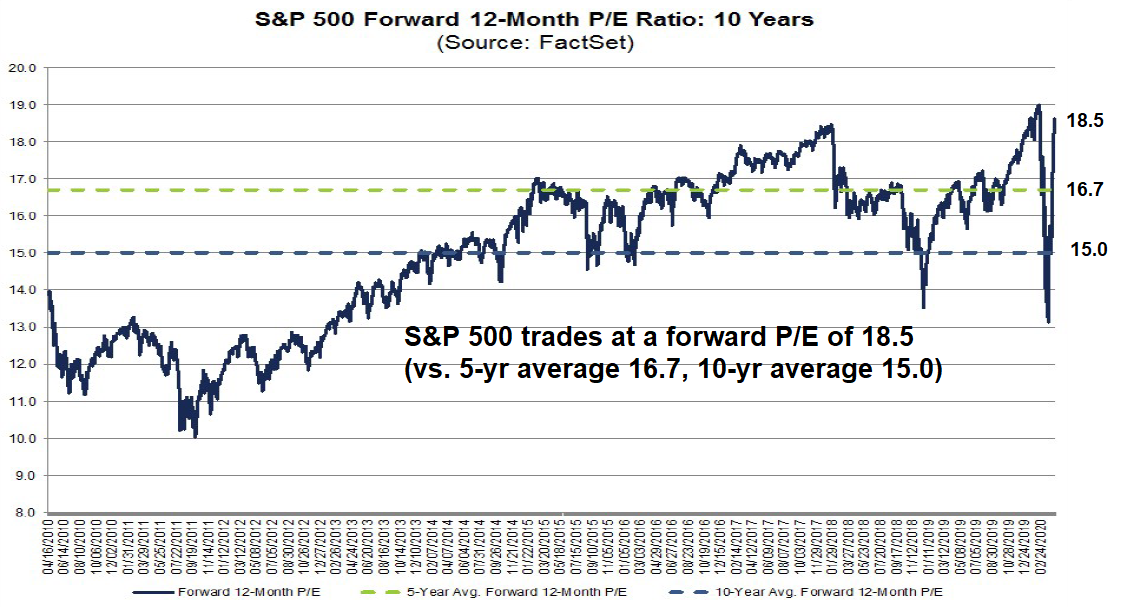
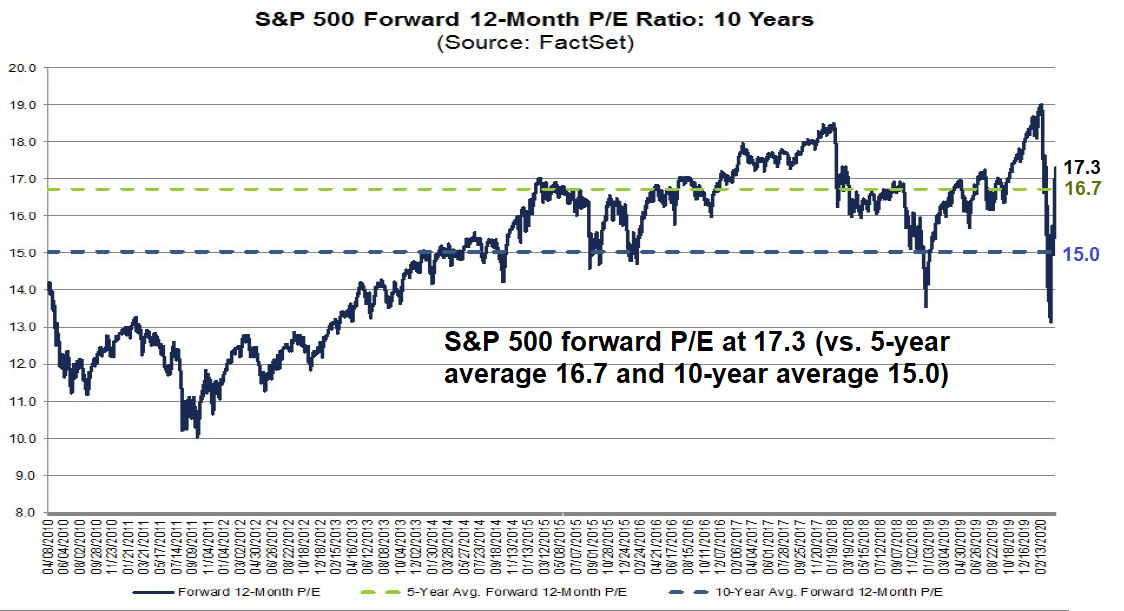
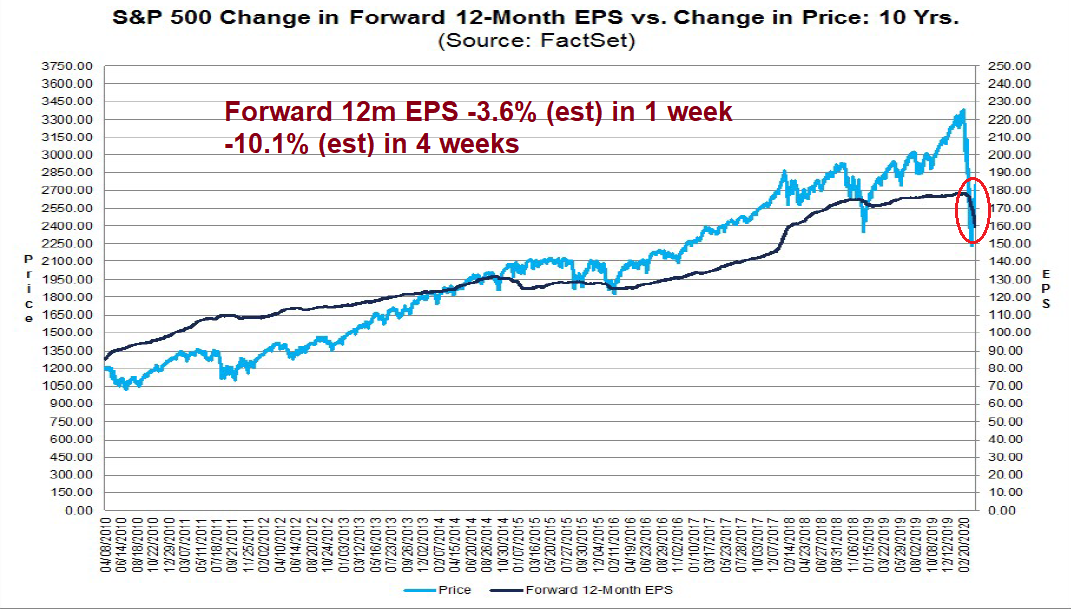
Barring the discovery of a miracle treatment or vaccine, the next likely market narrative will have a bearish tone. With the S&P 500 trading at a forward P/E of 20.4, which is a level last seen in 2002 when the market deflated from the Tech Bubble, investors are at risk of a disorderly adjustment in stock prices over the next few months.


