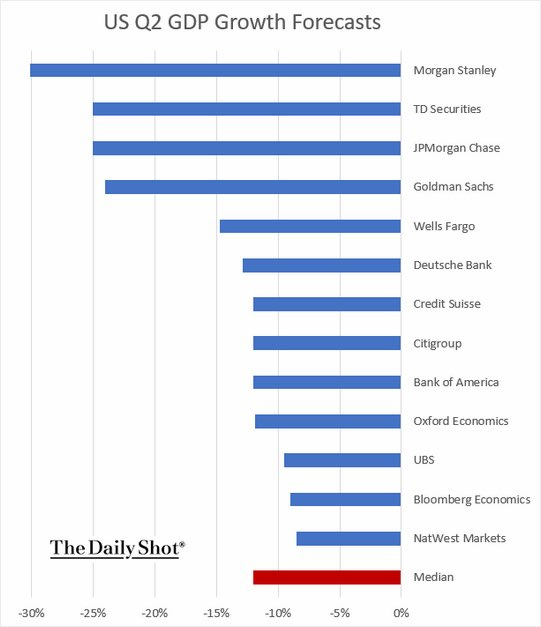
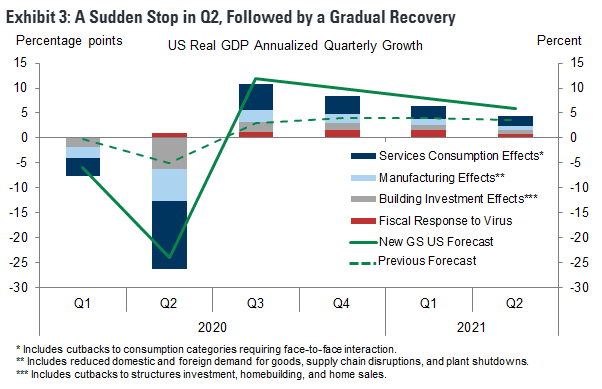
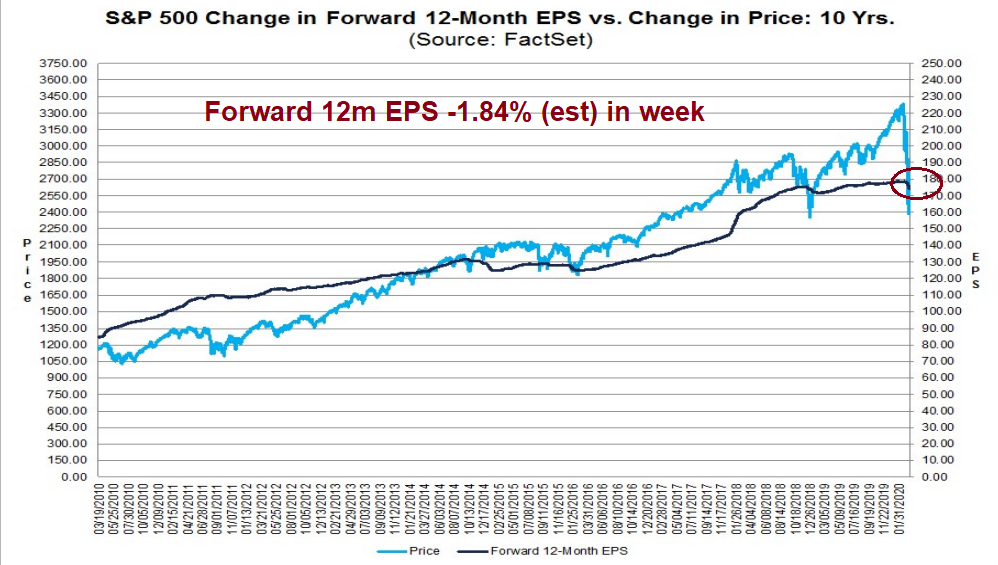
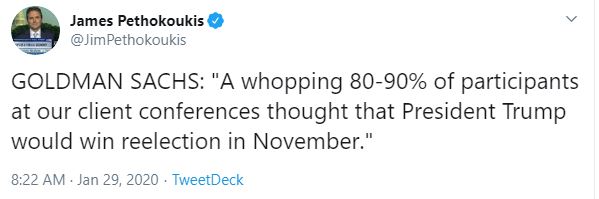
Last week’s stock market rally appears to be based on the hopes of a V-shaped economic recovery, powered by the combination of all-in monetary stimulus, and fiscal stimulus, as evidenced by a $2 trillion bill passed in Congress. Street consensus is now a V-shaped rebound, with a trough in Q2. This Goldman Sachs forecast is just one of many examples.
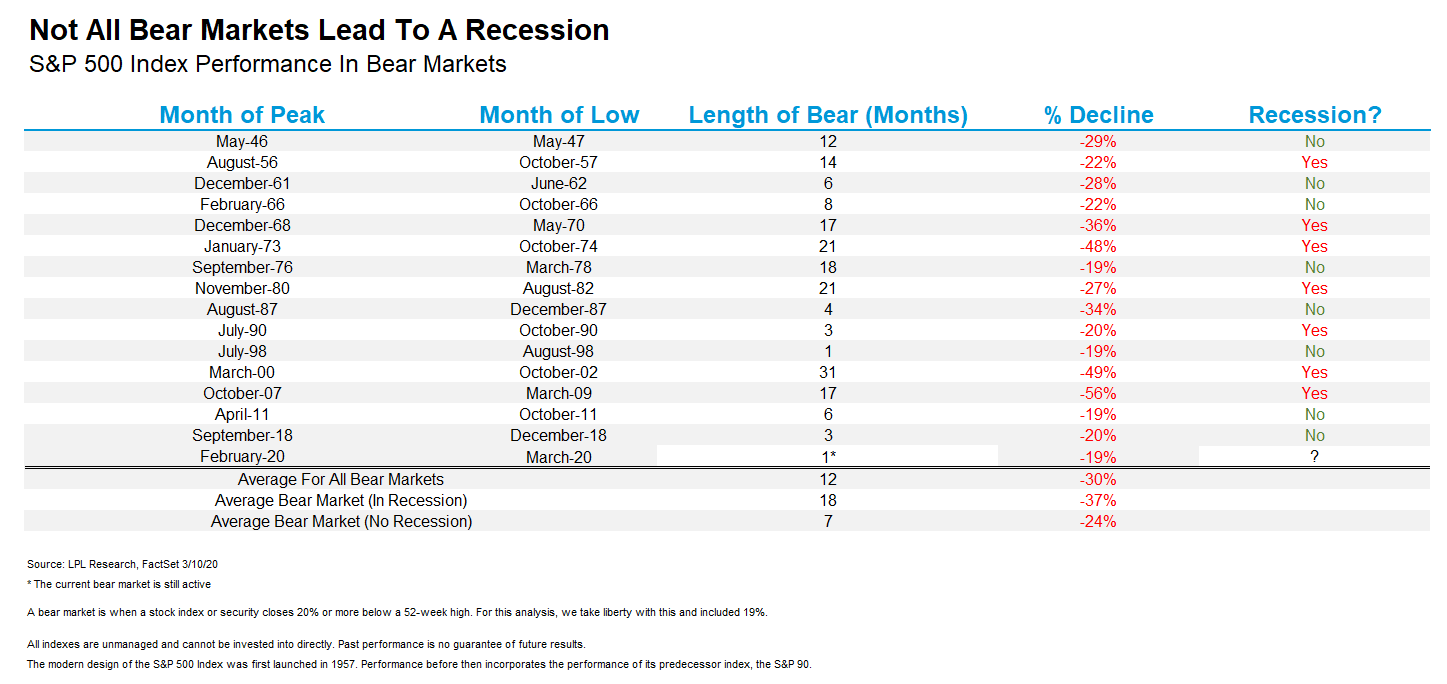
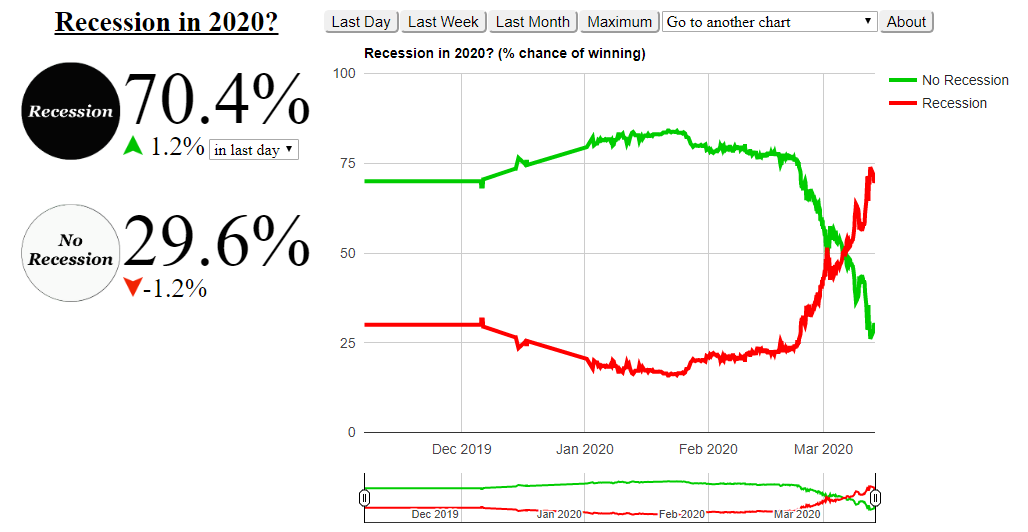
How realistic is the prospect of a V-shaped recovery? The economy is clearly either in a recession, or entering recession. LPL Financial found that recessionary bear markets last an average of 18 months compared to non-recessionary bears, which last only 7 months. That finding is inconsistent with the current Street expectation of a brief and sharp slowdown.
What are the odds of a V-shaped recovery?
The situation report
We begin by analyzing the current US situation, in the absence of official policy initiatives. We then consider the effects of announced and planned policy responses in the monetary, fiscal, and public health dimensions. This analysis will be conducted within the classic economic framework of the effects of policy on the three factors of economic production, namely capital, land (rents), and labor.
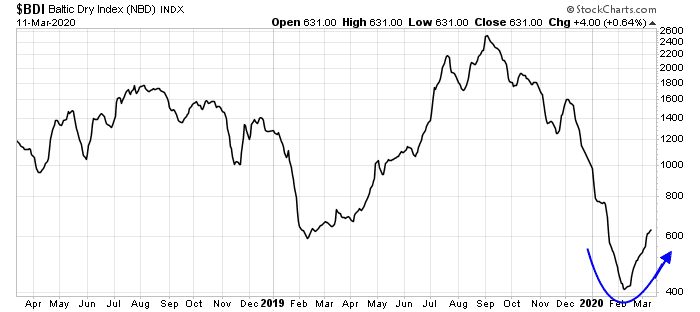
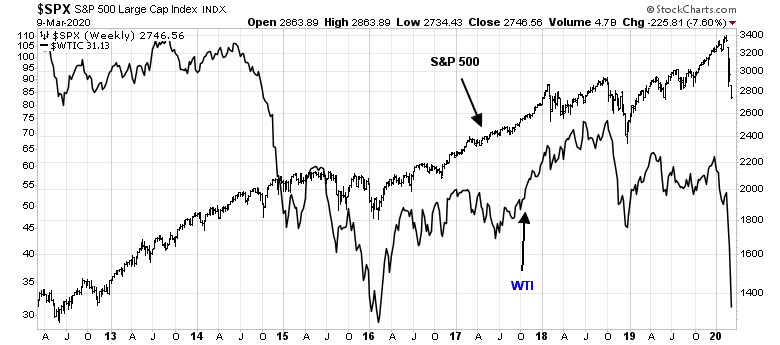
I made a recession call in early March (see OK, I’m calling it… and My recession call explained), which seems a lifetime ago. The global recession had its roots in a Chinese slowdown from the COVID-19 pandemic, which created supply chain disruptions. The global slowdown tanked the price of oil. When OPEC and Russia tried to set production cuts, discussions broke down and sparked a Saudi-Russian price war. The combination of the price war and pandemic induced demand slump has become so bad that Bloomberg reported a small Kansas plant was offering sweet Wyoming crude for $1.75 per barrel. As a reminder, the last time oil prices tanked in 2014, it sparked a mild industrial recession in 2015.
Finally, the COVID-19 pandemic landed on American shores, expanded its beachhead, and spread throughout the country. While the public health response was slow, officials eventually put social distancing edicts into place, which shut down the economy. That’s where we are today.
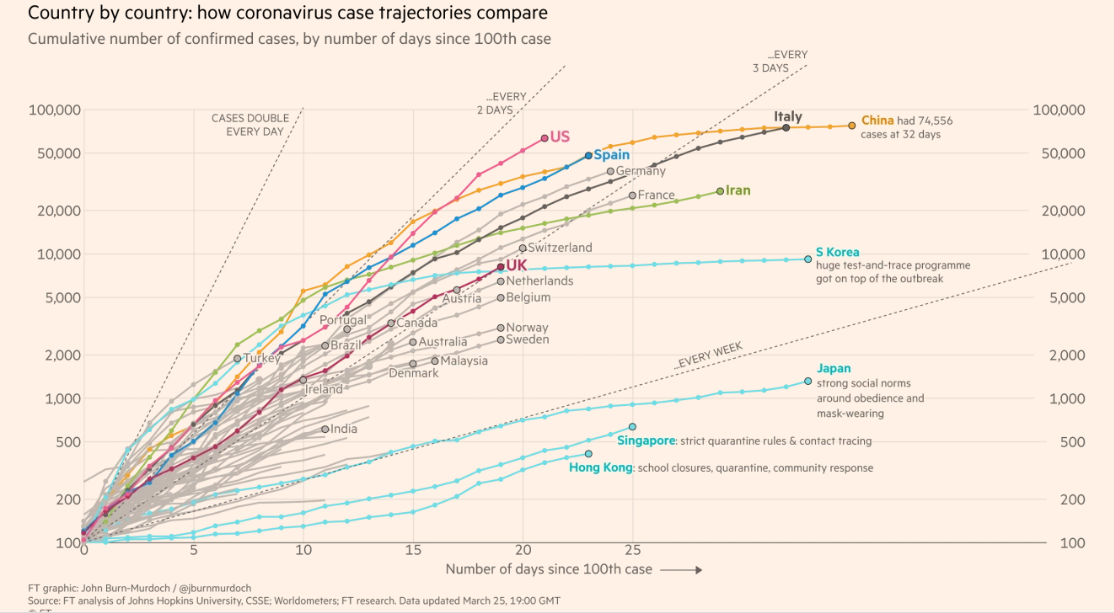
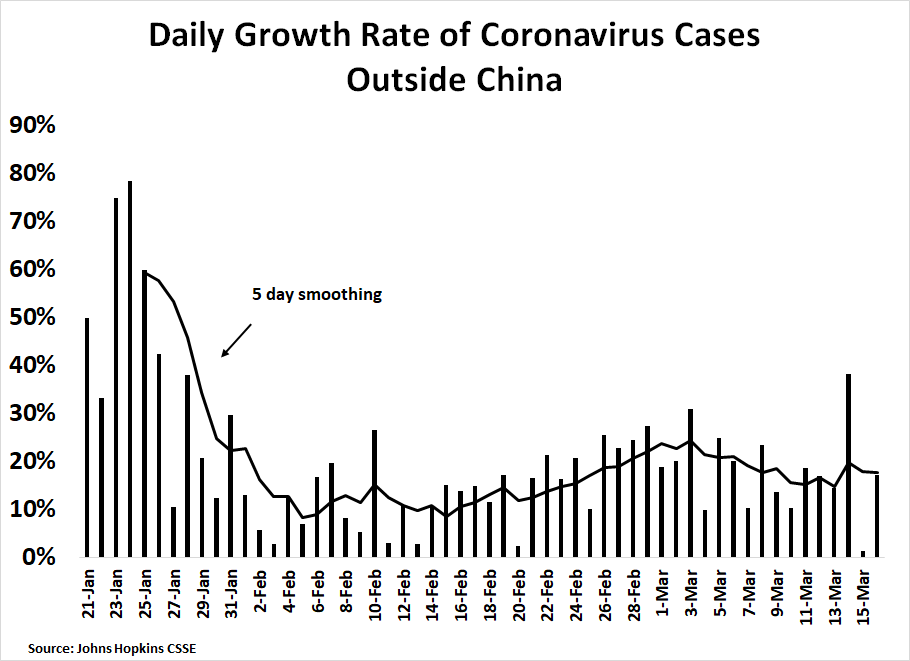
The FT’s analysis of the growth of confirmed COVID-19 cases in the US is rather alarming. While the first cases appeared in Washington State, the epicenter of the epidemic is now New York State, and the outbreak is spreading to other locations in the country.
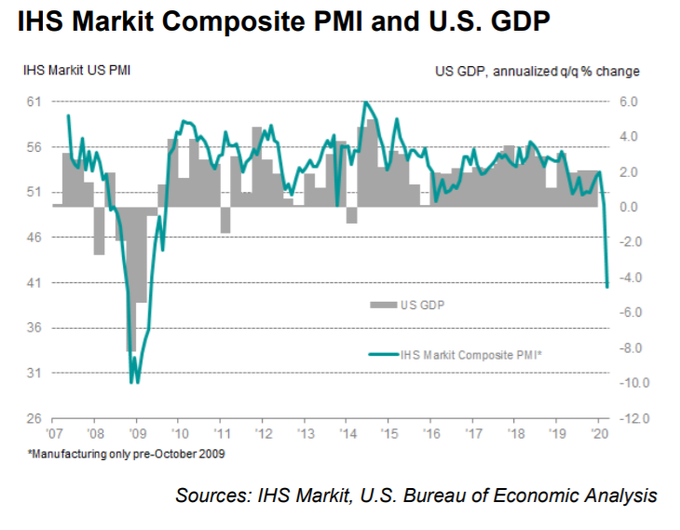
The IHS Markit Flash PMI tells the story of the damage to the US economy. Unlike 2008, this recession is about a complete collapse in services. The Composite PMI skidded to an all-time low of 40.5, and Services PMI also cratered to an all-time low of 39.1.
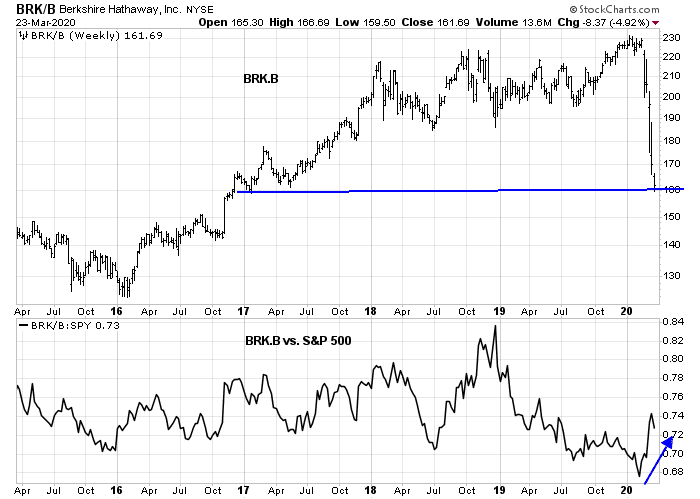
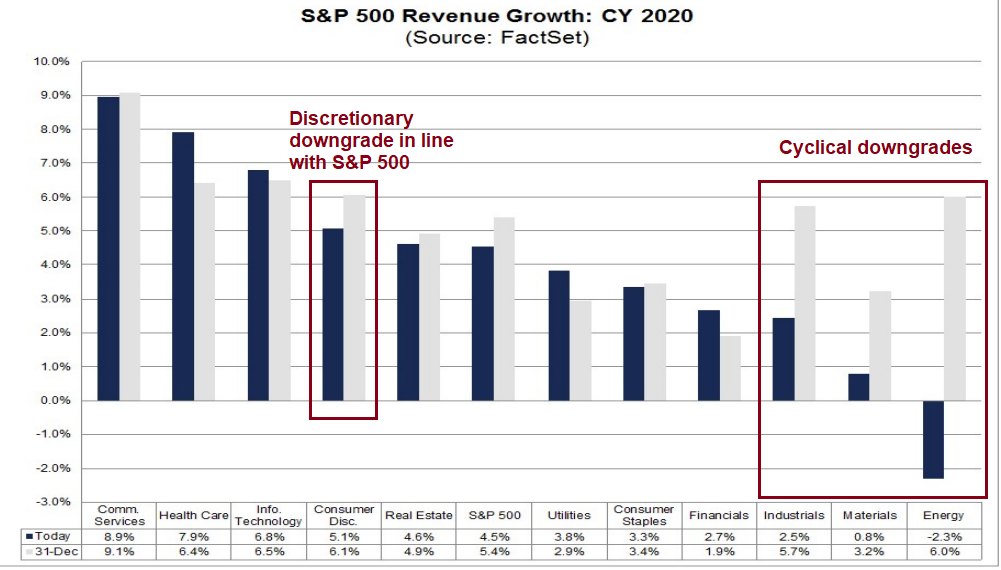
Let us now consider how the losses are distributed within the economy. Morningstar recently studied the effects of the sudden bear market on different kinds of companies. It found that companies with a strong competitive position, otherwise known as a wide moat, outperformed the companies with narrow and no moats.
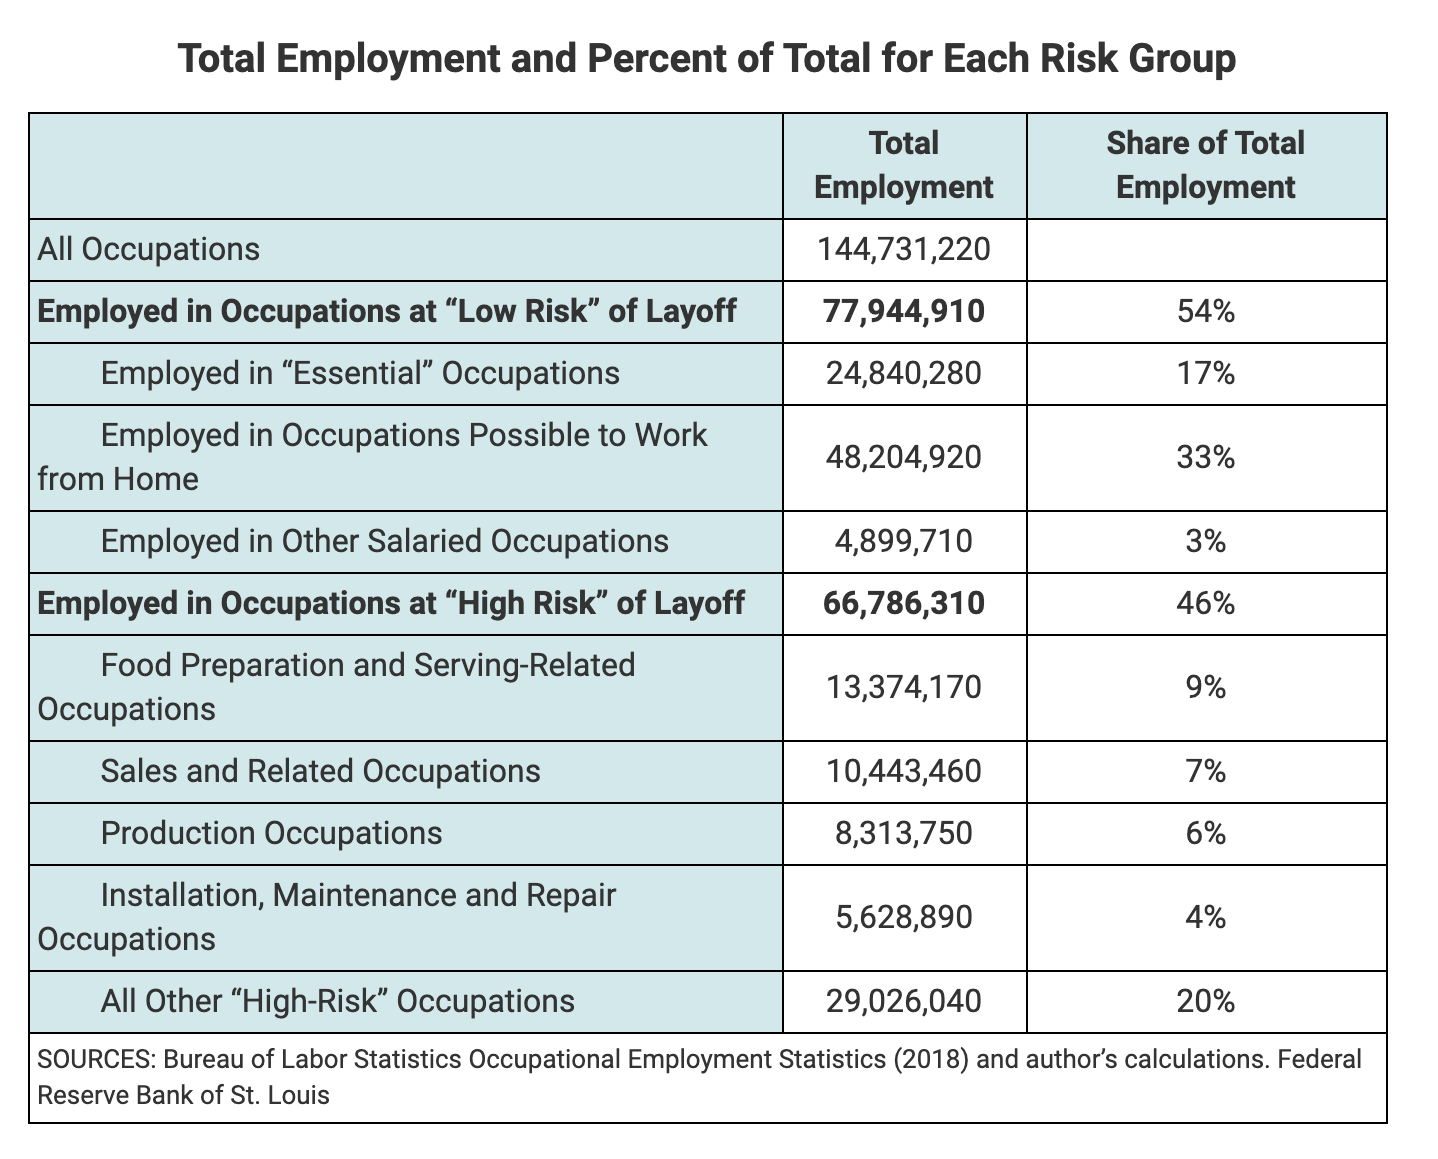
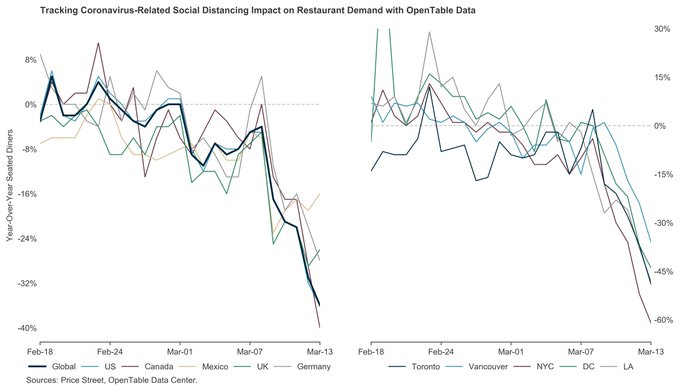
A Small Business Administration study in late 2018 found that small businesses comprise 44% of GDP. Small businesses tend to be have little or no competitive power. They are price takers, and have little or no bargaining power. Already, evidence from Open Table shows restaurant reservations have fall 100% (yes, that’s not a typo), and Cheesecake Factory has informed its landlords that it will not be paying the rent on April 1.
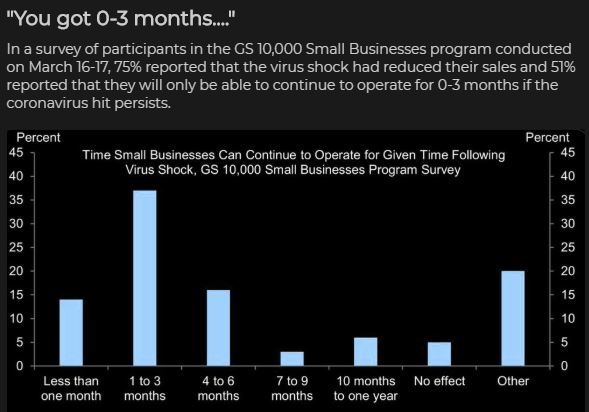
A recent Goldman Sachs survey shows that 51% of small business can survive for up to three months in the current operating environment. Since small business make up 44% of GDP. If they go under in the next three months, that would crater GDP growth by -22% in a very short period of time.
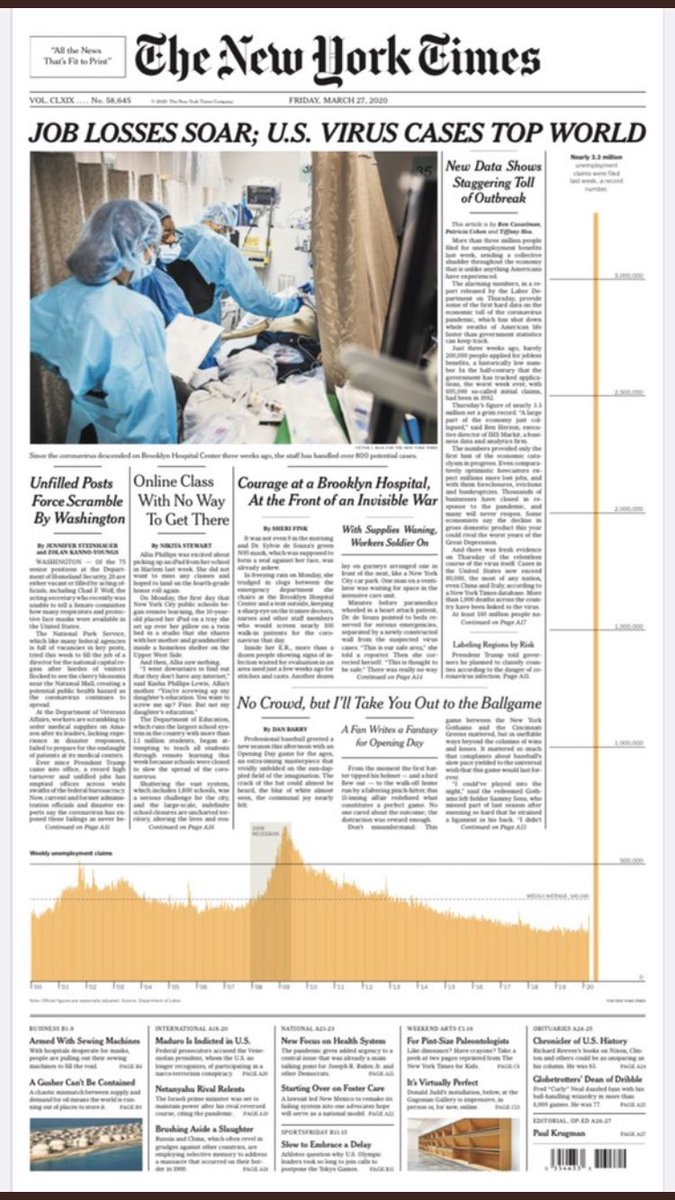
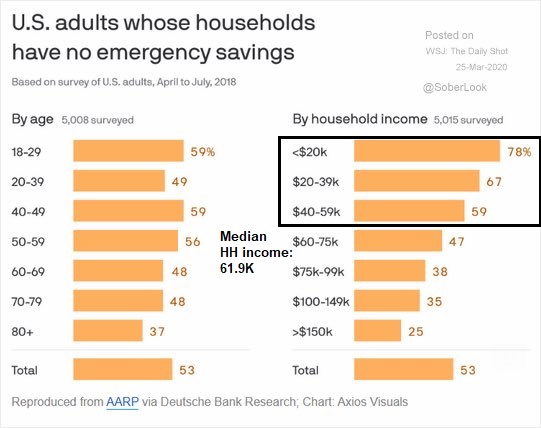
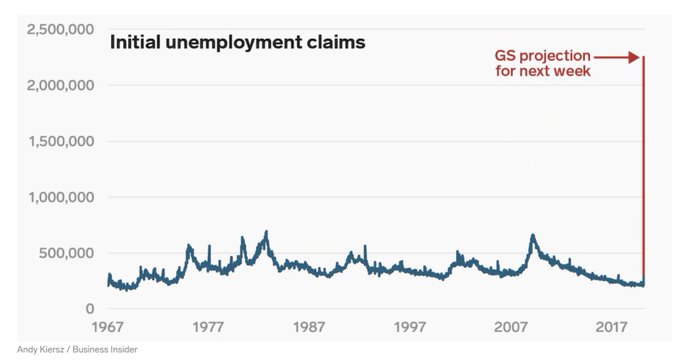
Last week’s unprecedented surge of initial jobless claims to 3.3 million tells the story of the damage to the household sector. A recent AARP survey of adults whose households with no emergency savings is revealing in highlighting the levels of vulnerability. While the proportion of vulnerable households are roughly the same by age group, 47% of households with incomes of 60-75K group, which is just above the median household income of $61,937, have no emergency funds. Moreover, roughly two-thirds of American households, or those below the median household income cutoff, have no emergency savings.
It is not my intention to sound political, but this survey underscores the highly uneven nature of the post-GFC recovery and subsequent widening level of inequality among Americans. It has left the houshold sector highly vulnerable to tail-risk shocks. This pandemic has the potential to sink the economy into the deepest downturn in the post-War, and possibly post-Depression period.
Another problematical issue is the strain of fighting the virus on state and local budgets. This Medium article outlines budget crunches in Arkansas, Georgia, Hawaii, Ohio, Pennsylvania, Virginia, Nevada, New York, and Texas, as well as numerous local authorities. Much of the funds went to fighting the pandemic, and federal aid to states was insufficient to balance the budget. Cuts have to be made. In the coming months, states and towns will unleash a wave of austerity that will be unhelpful for economic growth.
The policy response
That was the bad news. Here is the policy response. We have seen a combination of monetary, fiscal, and public health policy responses, all of which have to be effective for any economic recovery to be sustainable. As you will recall from Economics 101, the classic factors of production are capital, land (rents), and labor. Each policy has different effects on the factors.
Let’s start with monetary policy. The Fed has lowered interest rates, and announced open-ended quantitative easing to calm the markets. In addition, the FOMC begun to buy municipal paper, and mortgages. Moreover, it announced dollar swap lines with other central banks in order to alleviate the offshore dollar shortage, which was creating instability in emerging market economies that financed in USD debt. All of these actions were designed to compress credit spreads, which had blown out. The principal effect of the Fed’s actions is on the cost of capital, and to a lessor extent, the real estate market as the mortgage market was imploding.
What about the fiscal response? Congress passed the $2 trillion Coronavirus Aid, Relief, and Economic Security (CARES) Act last week, with $377 billion support to small businesses in the form of loan guarantees and grants, $550 billion support for individuals in the form of direct payments and enhanced unemployment insurance, and roughly $500 billion support for the corporate bond market.
Make no mistake about it, this is not a stimulus bill, but a bailout plan, designed to partially alleviate the pain suffered by capital and labor providers by sprinkling money in different parts of the economy. Joe Wiesenthal at Bloomberg frame the issue by distinguishing money as a score keeping device, and as a relationship-preserving device, or glue, that holds society together. The CARE Act just provides some temporary glue.
But when you think about the purpose of money on a society-wide scale, it’s a lot more than a score-keeping device. What makes a nation wealthy? Is it the amount of cash it has? Of course not. (Again, Venezuela.) What makes a nation wealthy are things like natural resources, a robust and fair rule of law, the level of education of its people, and the robust functioning of a range of institutions, whether they be governmental, corporate, non-profit, or social. Some of these institutions don’t require money to operate, but for many institutions (particularly companies), money is their lifeblood. Money is what keeps people showing up and working together towards some productive enterprise. Without money the people will stop showing up, and they’ll never reassemble again.
And so we get to the crisis at hand… a crisis that requires us, for a period of time to not show up. If the crisis is left to rage, untold number of businesses will run out of money, lay everyone off, and it will be virtually impossible to put them back together. As such, money isn’t a scorekeeping device, but a relationship-preserving device or institution-preserving device. And, for at least a temporary period, simply creating money out of thin air can preserve socially productive relationships.
The new stimulus bill contains $350 billion for aid to small businesses which employ an overwhelming number of Americans. That sounds like a lot of money, but if it’s not enough to prevent relationships of people from disintegrating and never returning, we’ll all be left unimaginably poorer.
The public health policy response
While Wall Street analysts focus mainly on the monetary and fiscal response to the crisis, the public health response is equally important because it affects the quality and supply of labor. Without labor, the economy loses a key factor of production.
President Trump caused an uproar last week when he suggested that he wanted to dismantle the country-wide shutdown by Easter, or April 12. What was less well-known is a Fox Business report indicating that Trump walked back his desire to re-open the economy by Easter based on pressure from business executives. He has since replaced his Easter re-opening desire with an initiative to label different regions of the country high, medium, and low risk as part of new federal guidelines for states to decide on how to manage their social distancing policies.
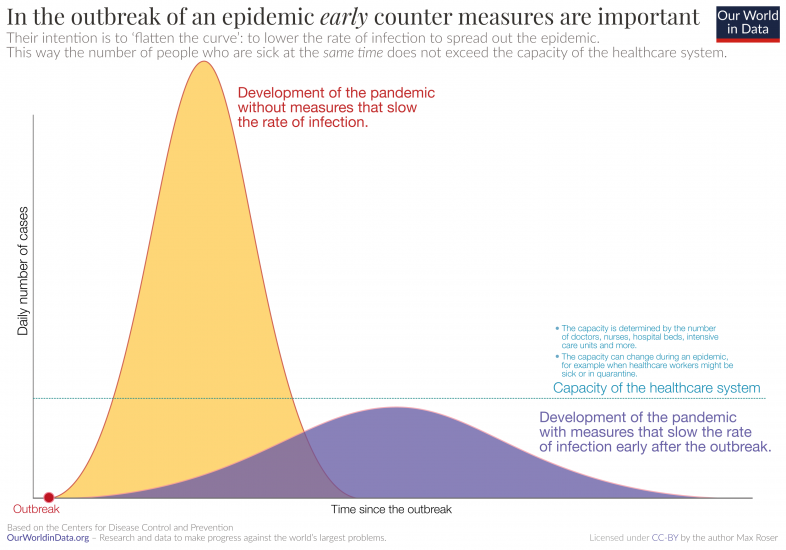
Much depends on the trajectory of public health policy, and the evolution of the pandemic within US borders. The prognosis is not good. The US case growth rate is well ahead of other countries in a similar stage of infection. As the count is based on confirmed cases, there is undercounting because of a shortage of testing facilities. Any initiative to reduce the length of the shutdown risks a sudden acceleration of case growth that overwhelms hospital bed capacity and recreate the scenes in Northern Italy throughout the US.
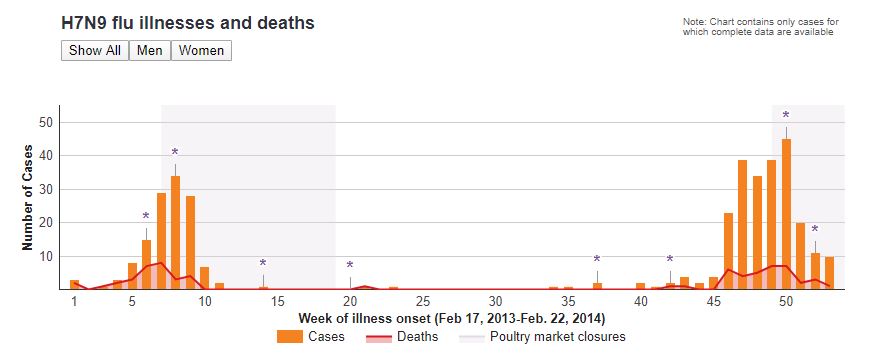
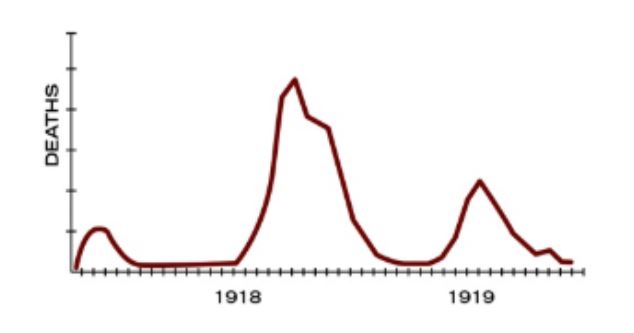
Any effort to shorten the lockdown period risks a second wave of infections. There have been numerous instances of a second outbreak wave as people let down their guards. Science News documented a double peak in the bird flu.
There was a similar incidence of a second wave of H1N1 infections (via PLOS).
The CDC also reported three waves of Spanish Flu infections in the US.
China and Hong Kong are already reporting new incidences of COVID-19 cases from travelers. One interesting parallel for the US might be Iran, both of whose reactions to COVID-19 were late. The Economist described the regimes’s fumbled response to the pandemic. It first ignored the problem, then tried to ignore it by hushing up the death toll, and even rejected aid from Médecins Sans Frontières. The current response can best described as uneven:
The clerics claim they are doing a fine job. Iran has produced more face masks than Italy and tested more people than Britain. Military factories are now making personal protective equipment, oxygen canisters and hospital beds. The government has turned stadiums into isolation centres and increased the number of laboratories testing for the virus from two to almost 60. It has referred 62,000 people to health facilities. Volunteers are distributing hundreds of thousands of food parcels to those who cannot leave their homes. The effort is “unparalleled” in the Middle East—and even much of Europe—says an official at the who.
However, the government is doing little to stop the spread of the virus. Malls are still open. Parks are packed. Popular shrines have at last been closed. Nevertheless, many converged on the holy city of Mashhad for Nowruz, the Persian new-year festival, on March 20th. Hundreds jammed the streets of Tehran three days later to touch the coffin of a prominent soldier. On March 25th President Hassan Rouhani at last promised travel bans between cities, but he has dismissed calls to lock down the country. Other officials deflect blame. “A huge part of the danger Iranians face is due to the United States,” says Muhammad Javad Zarif, the foreign minister.
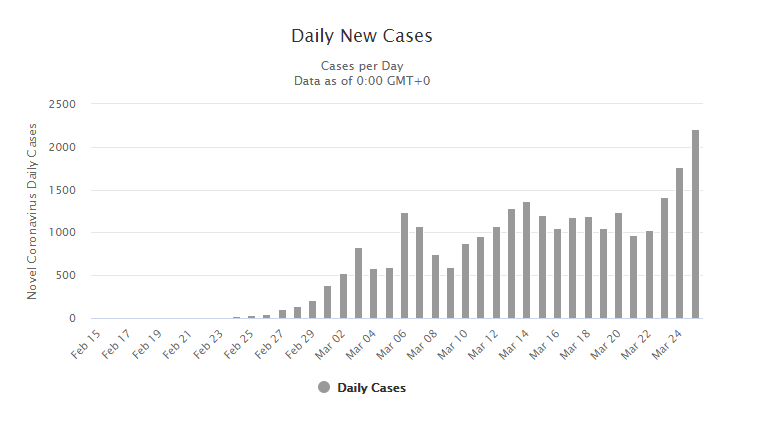
The rate of new cases seemed to plateau, but it recently accelerated again.
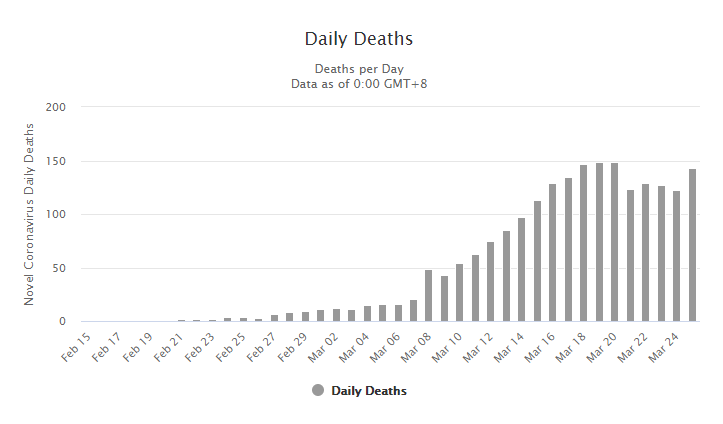
The number of deaths have also followed a similar pattern, which should rise in the near future as it follows the number of cases.
Another risk is the policy response from other countries. What if major trading partners decided that US public health policy poses too great a risk, and closed their borders to Americans, and US trade? A 2009 paper which modeled US border closure in response to a security threat answers that question. It’s not a pretty picture.
- Cutting all imports by 95% with sticky real wages reduces GDP by 48%.
- If critical energy imports exempted and real wage are flexible, GDP falls 11%.
A WSJ article provides a similar perspective from China, which had largely returned to work, but the economies of its key trading partners have slowed, which is creating a demand shock.
More than two months after imposing quarantines to counter the coronavirus, China is getting back to work. It is a slow and rocky process, one that rests on the world battling back successfully against the pandemic.
With new infections dwindling, factories are restarting, stores are reopening, and people are venturing outdoors. In some ways, China is where the U.S. and Europe hope to be within weeks or months.
Yet many Chinese factories find demand for their products has evaporated. Consumers in China and elsewhere are reluctant to spend over worries about what they have lost and what lies ahead.
For U.S. businesses tied to global trade, exporters and multinational companies, China’s limited return to normal foreshadows the potential for a sluggish U.S. recovery. Consumption, which makes up more than two-thirds of the American economy, looks to be hobbled by lost jobs, fallen income and diminished confidence for an unknown period. Even countries emerging from national lockdowns later than others will likely see weaker demand among trading partners also hurt.
I don’t mean to be all negative, all the time. Here are some mitigating factors that could improve the public health policy outlook, and improve the quality and availability of labor as a factor of production.
Some re-purposed drugs, such as anti-malaria medications hydroxychloroquine and chloroquine, or the anti-HIV medications Kaletra and Remdesivir, as well as the plasma of recovered patients, may be useful in treating COVID-19 victims. In addition, the Washington Post reported that the onset of warm and humid weather may slow the progress of the virus:
Multiple early studies provide evidence of statistical ties between temperature and humidity ranges and the geographic regions where this virus has thrived. While none of these studies has been peer-reviewed, they all point to the same general possibility: The pandemic could ease in parts of North America and Europe during the summer months, although it could then come roaring back in the fall.
Anthony S. Fauci, the director of the National Institute of Allergy and Infectious Diseases (NIAID) and a visible figure on the White House coronavirus task force, said at a Wednesday press briefing that a seasonal cycle to the pandemic is possible, perhaps even likely.
“… I think it very well might. And the reason I say that is that what we’re starting to see now in the Southern Hemisphere, in southern Africa and in the southern hemisphere countries, is that we’re having cases that are appearing as they go into their winter season. And if, in fact, they have a substantial outbreak, it will be inevitable that we need to be prepared, that we’ll get a cycle around the second time.”
These factors are all causes for cautious optimism. While neither the weather nor the re-purposed drugs represent any panaceas, they can buy some time for medical staff for a vaccine to be found and put into production, which is not likely to happen for another year, at the earliest.
Investment conclusions
I began this report to handicap the odds of a V-shaped recovery. As good students of of Economics 101 recall, the three factors of production are capital, land (rents), and labor. The current crisis has affected each of those factors in different ways, and the combination of monetary, fiscal, and public health policies also have different effects on each of the three factors.
So far, monetary and fiscal policy have bought time so that the economy can stabilize. However, the economy cannot fully recover without a healthy and productive labor force, which mainly depends on public health policy, and possibly a little luck from the weather and medical research. Just as Cheesecake Factory David Overton told landlords when the company would not pay its rent on April 1, “We simply cannot predict the extent or the duration of the current crisis”, there is too much uncertainty, and the jury is still out on the trajectory of the recovery.
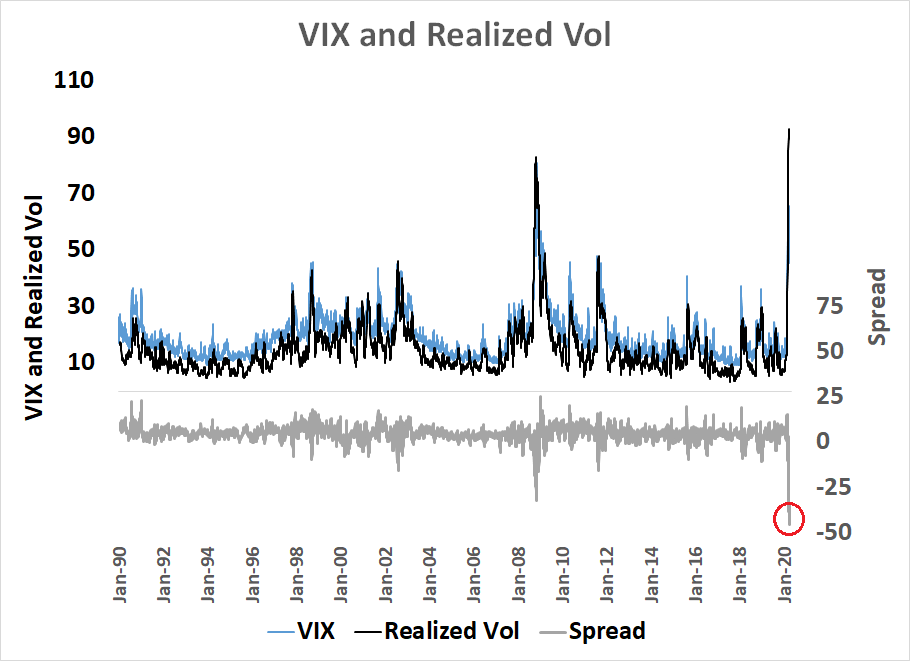
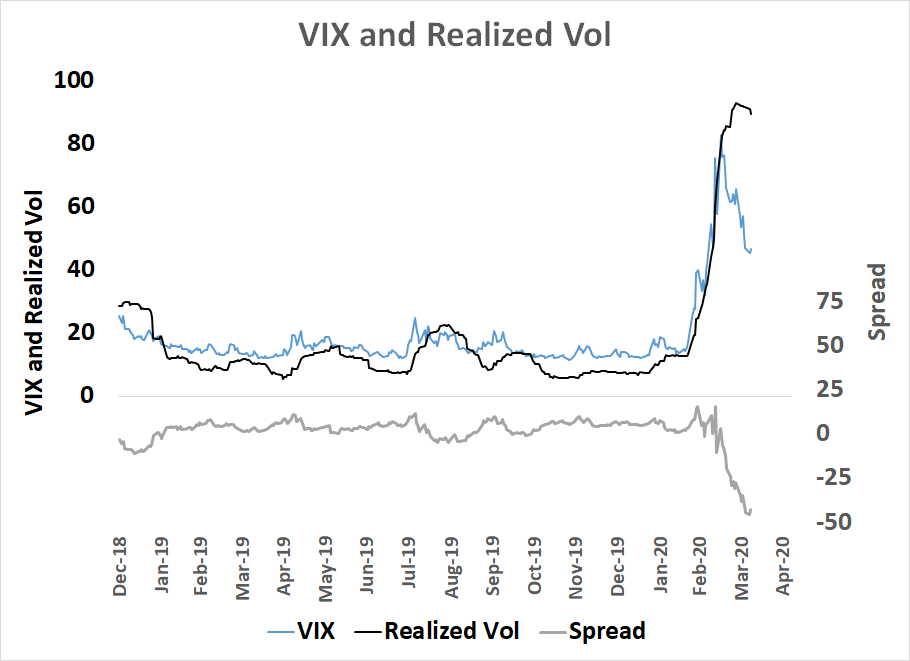
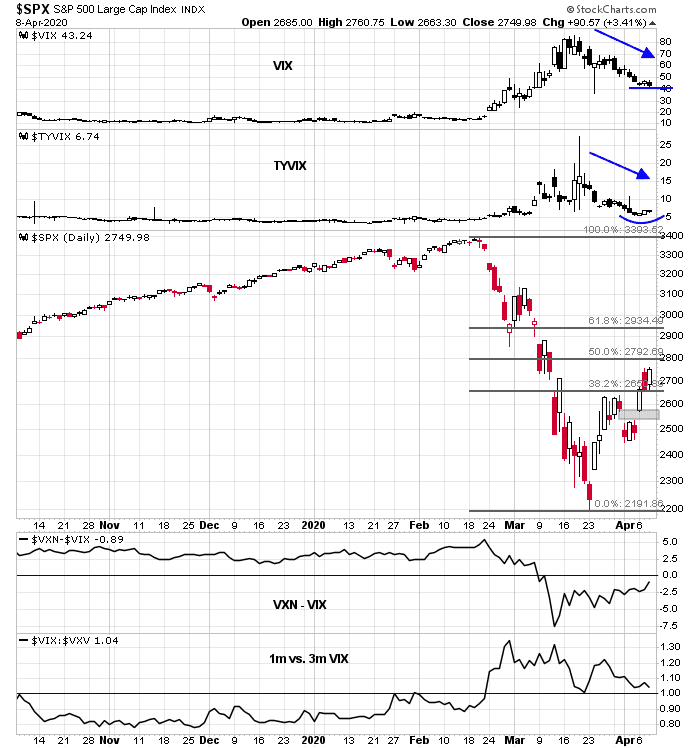
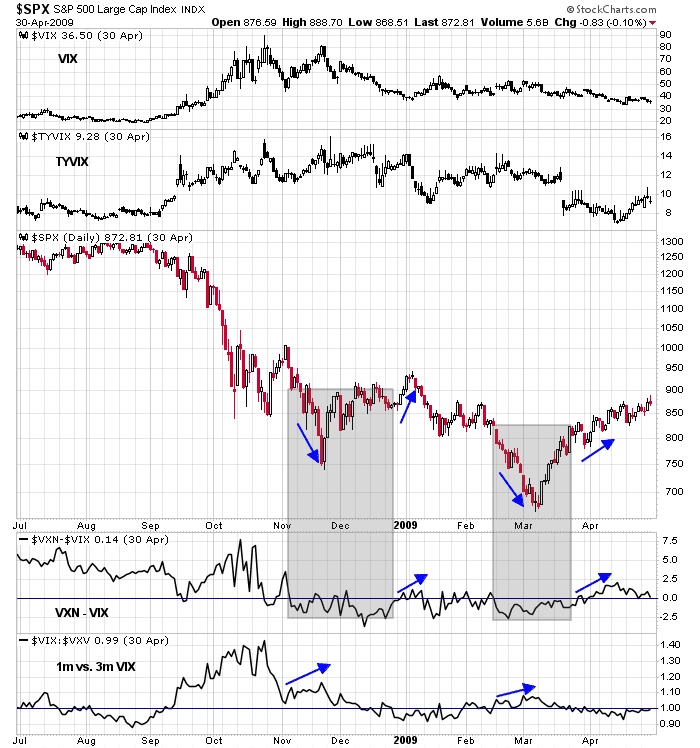
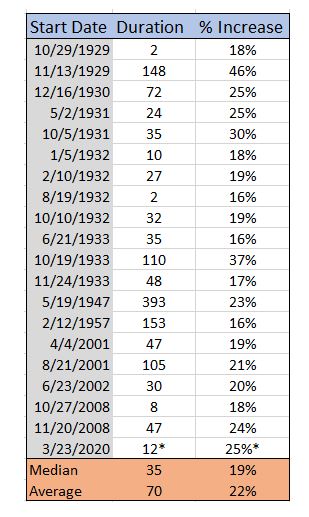
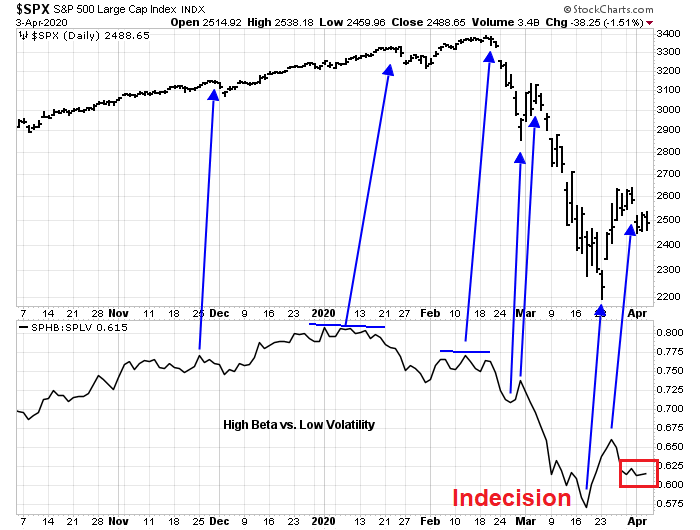
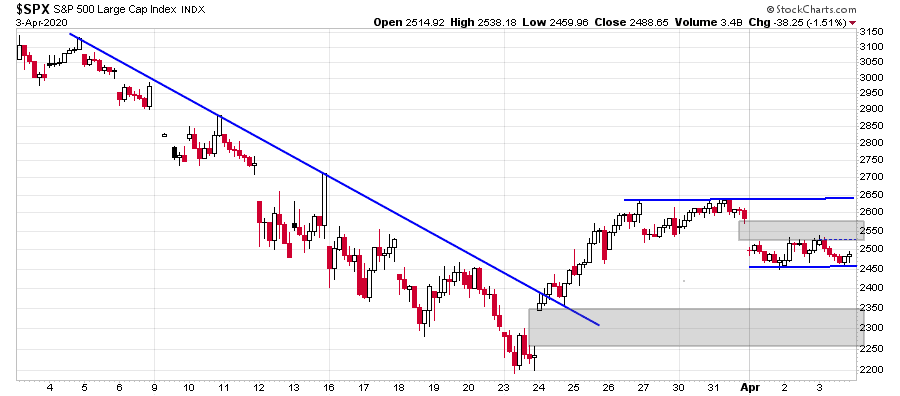
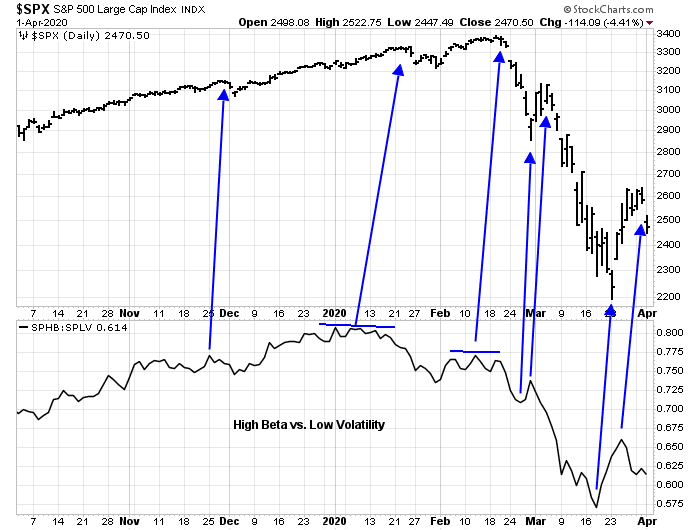
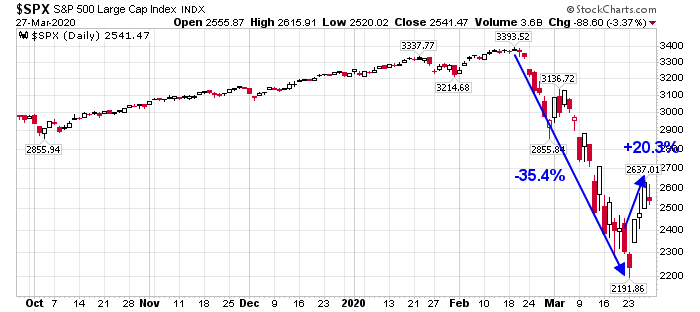
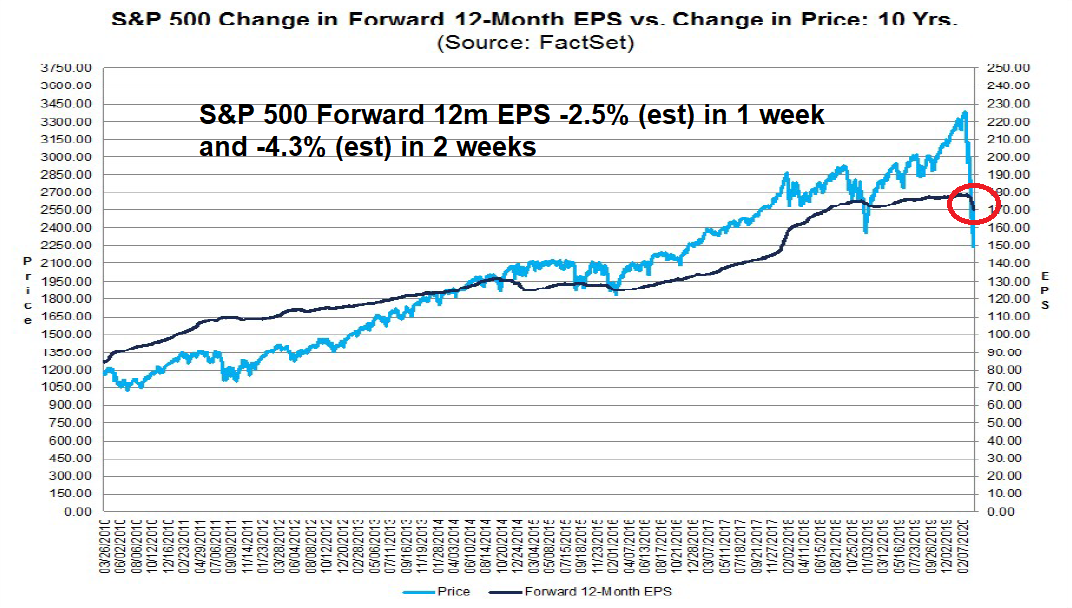
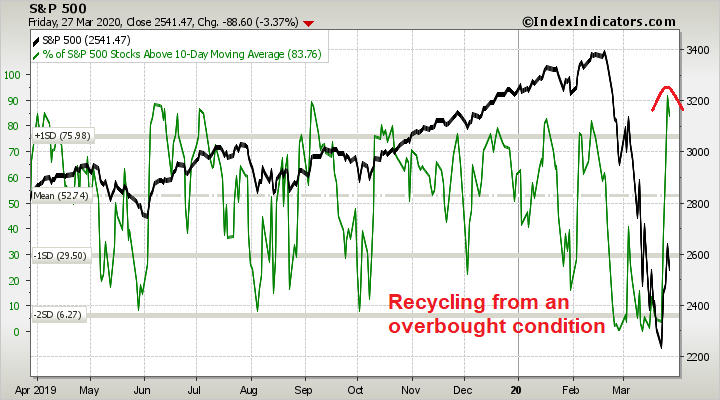
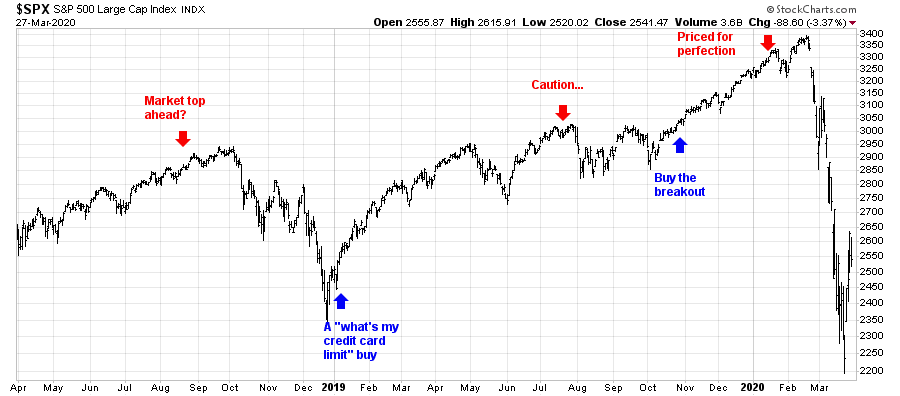
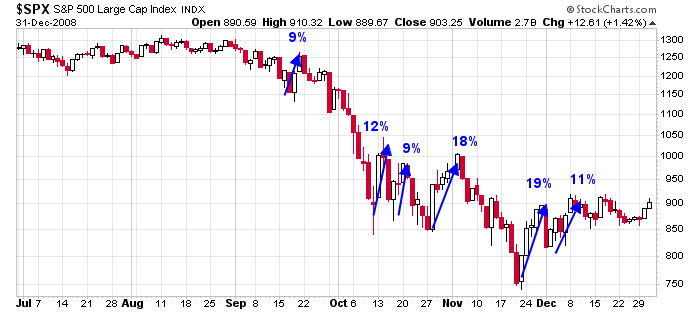
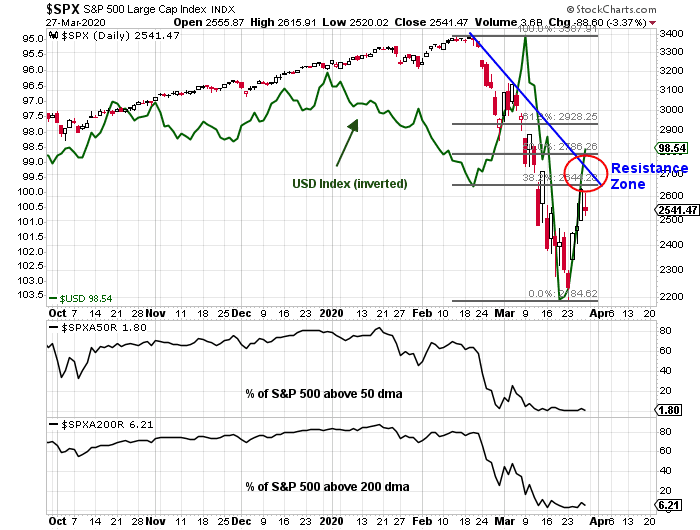
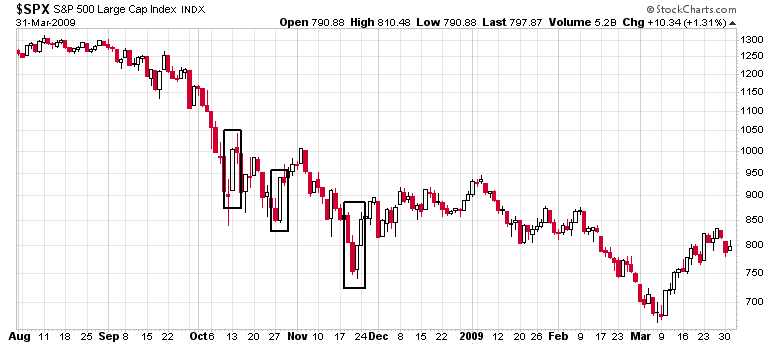
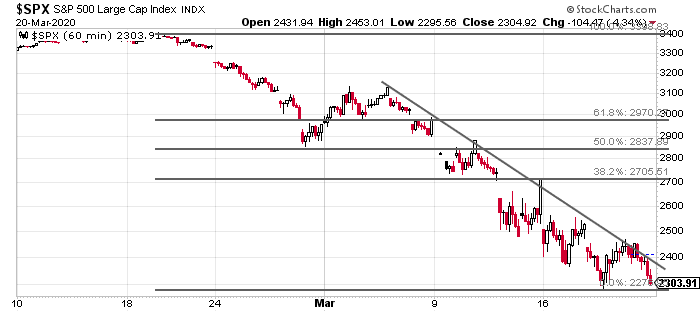
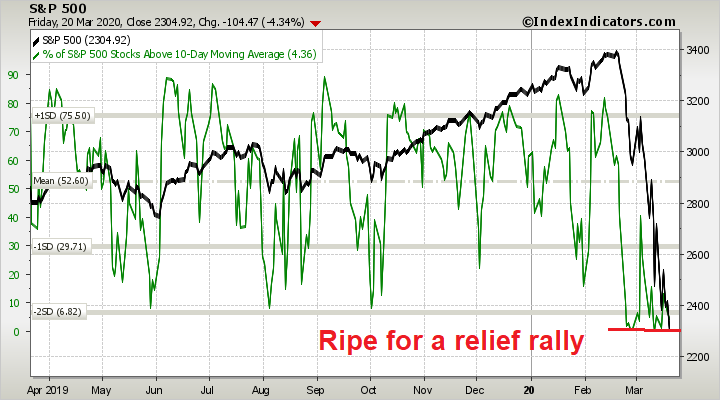
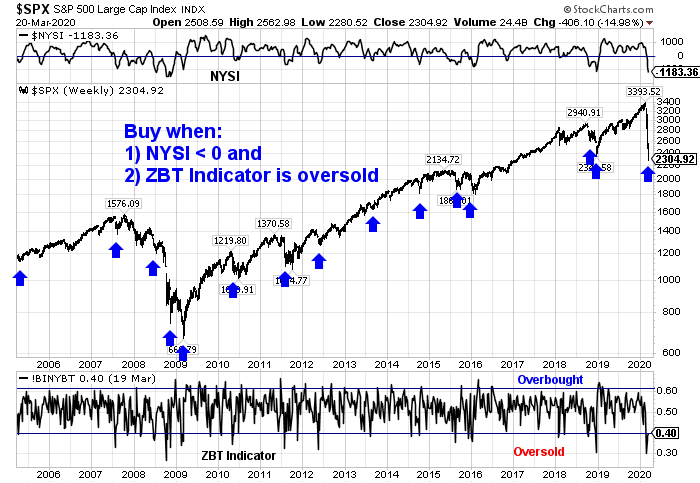
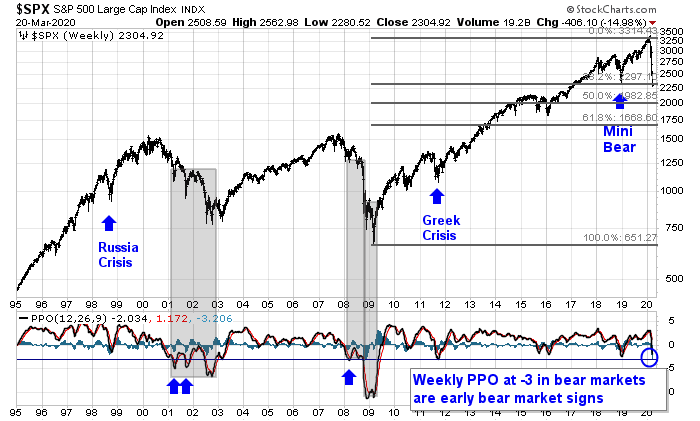
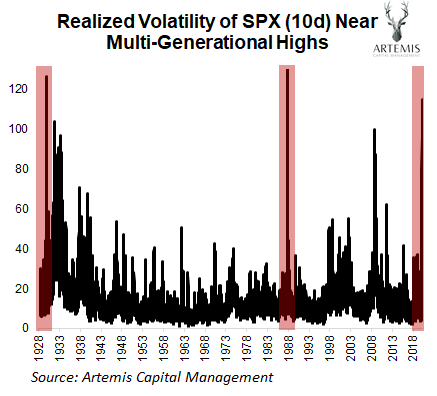
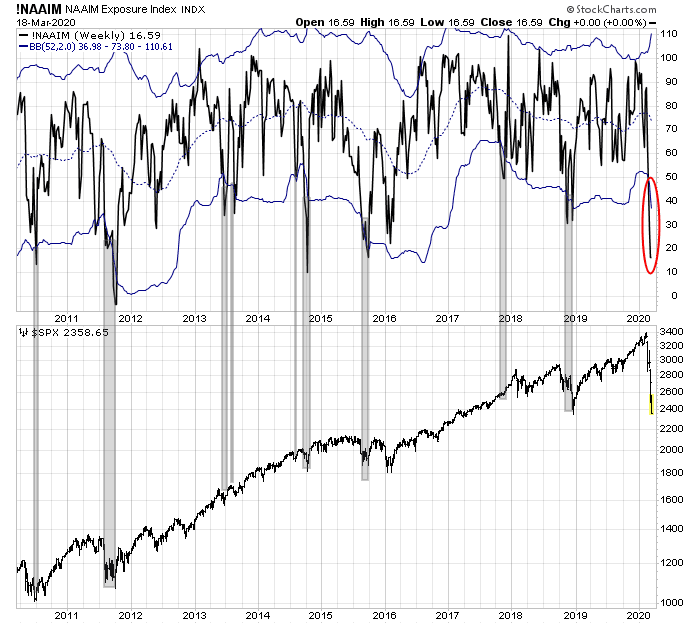
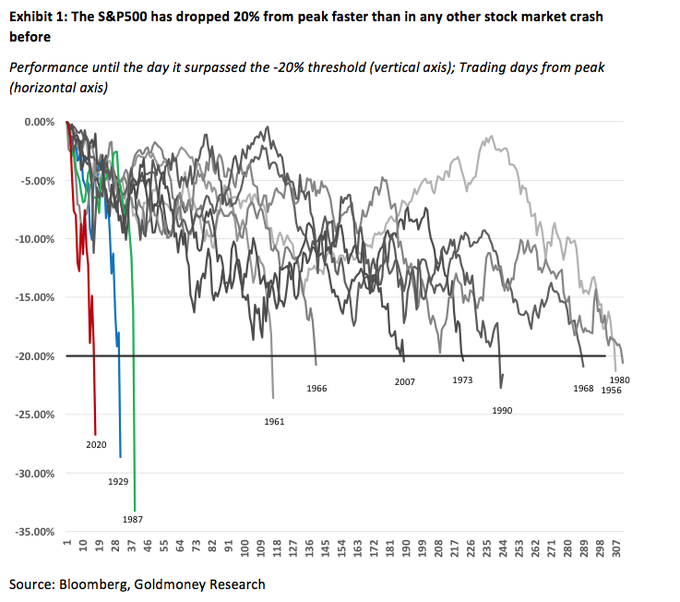
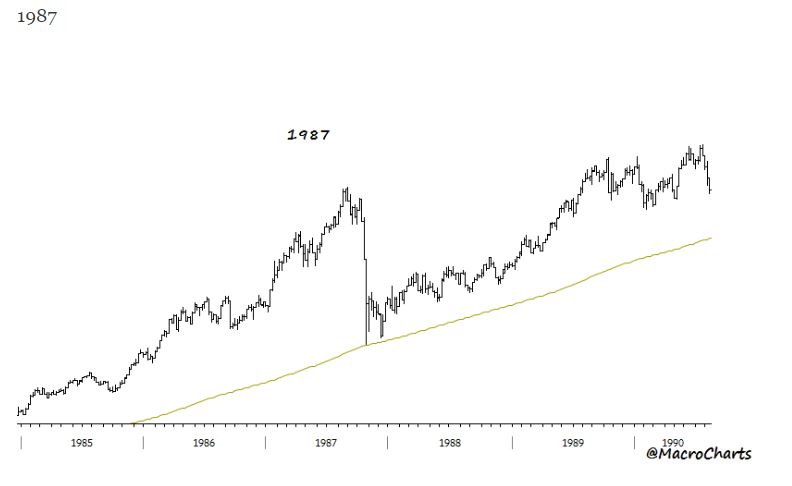
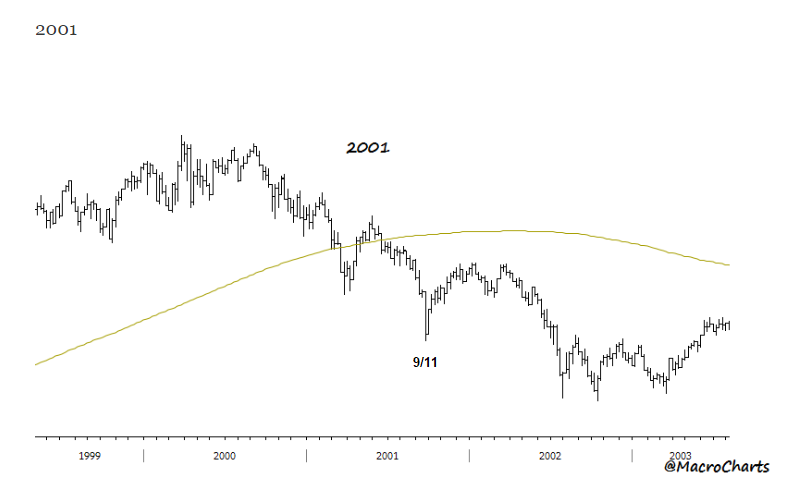
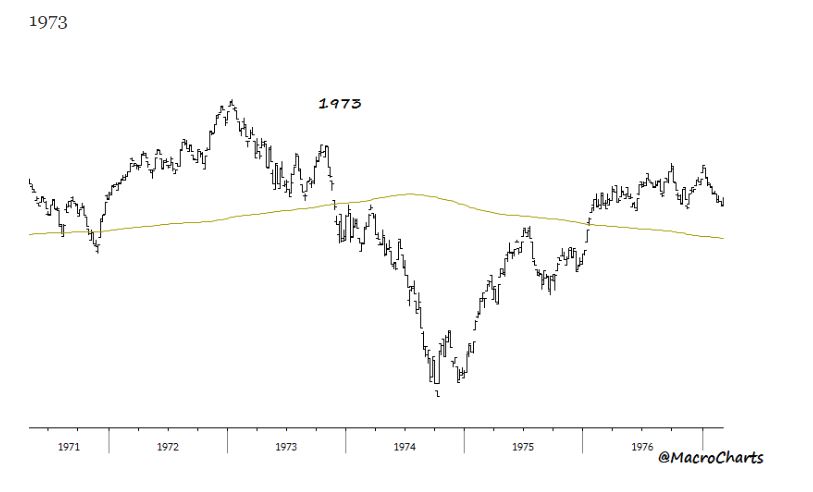
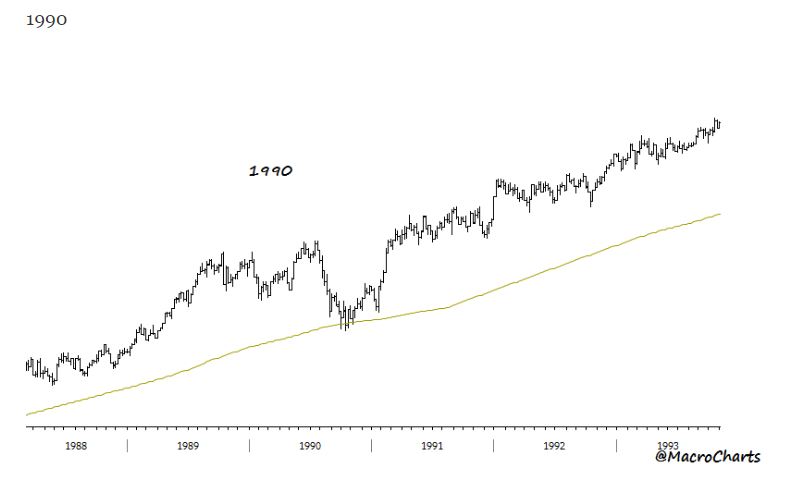
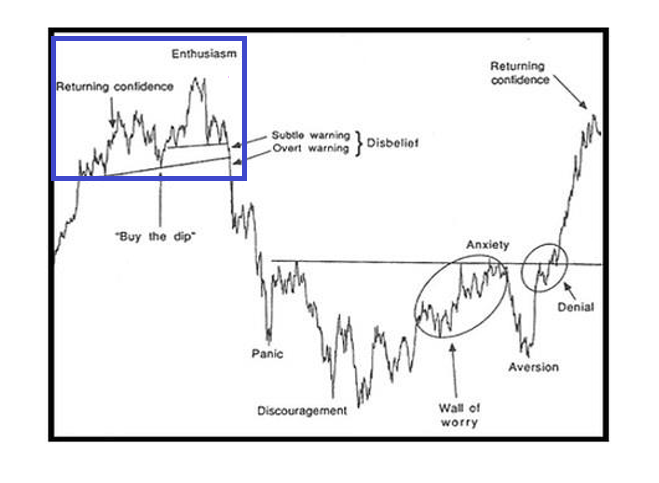
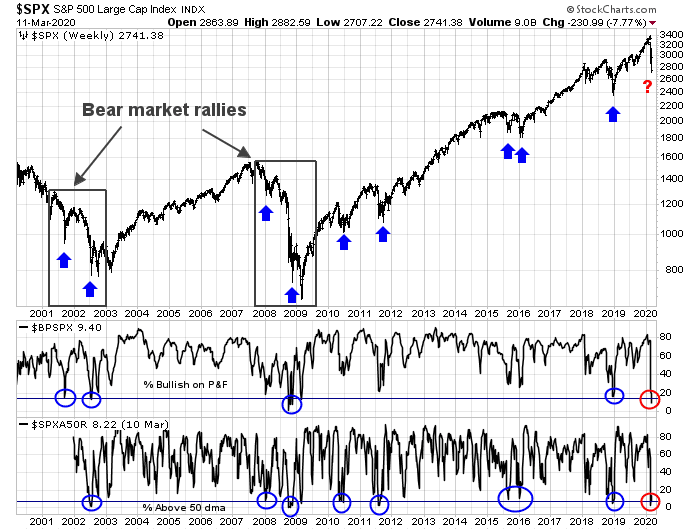
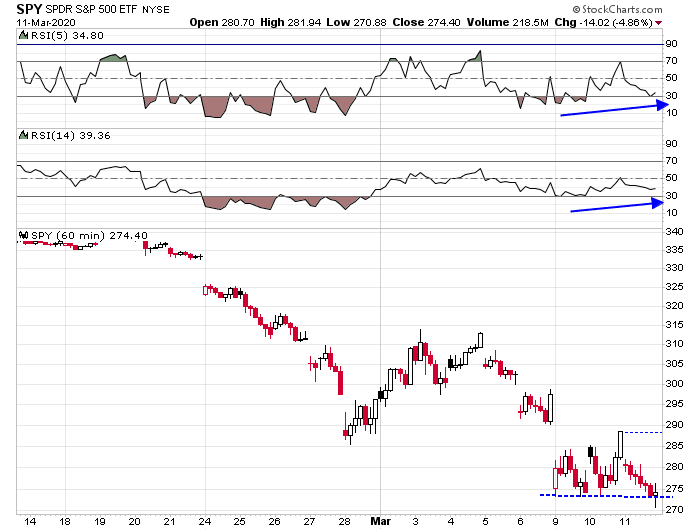
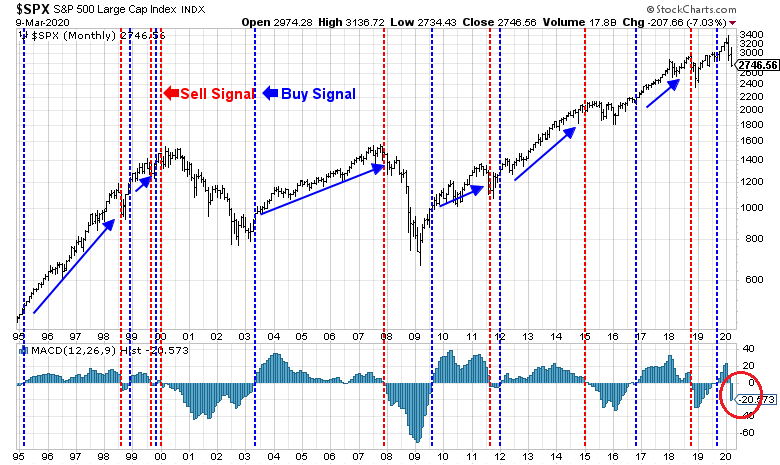
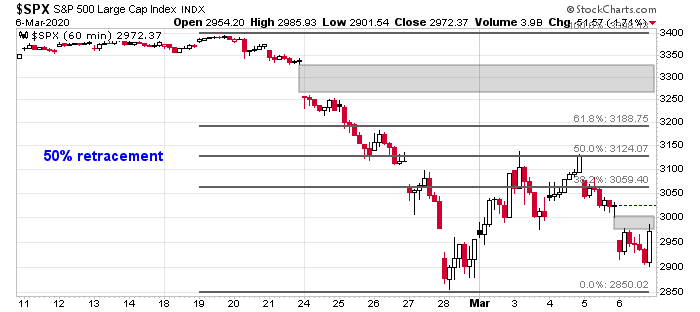
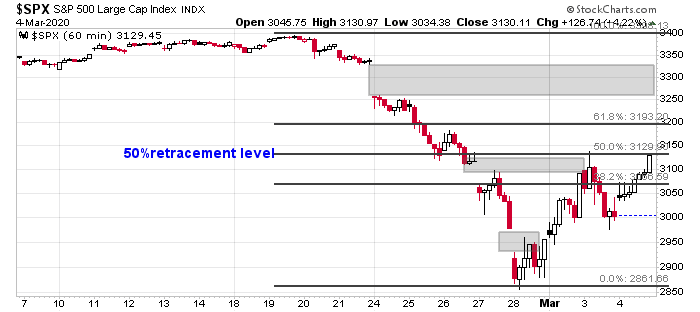
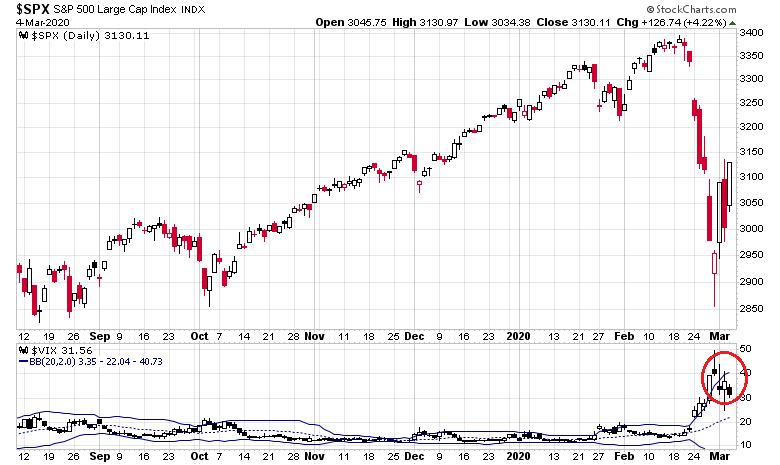
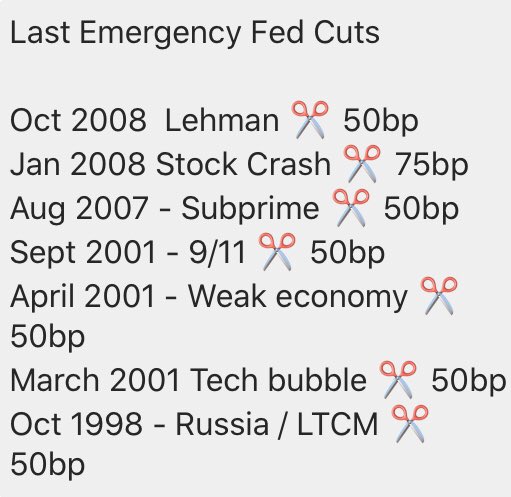
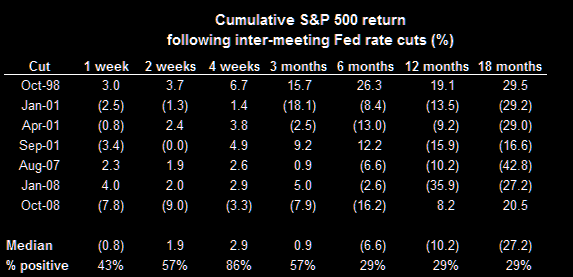
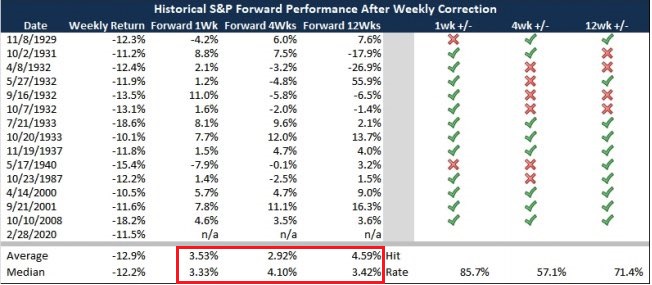
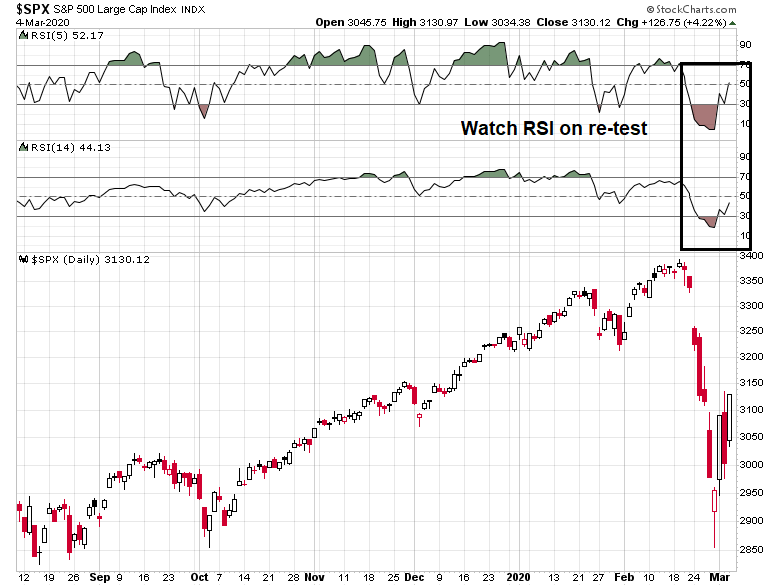
That said, the stock market is forward-looking, and historical studies indicate that recessionary bear markets, which this is, tend to last much longer than non-recessionary bears. By implication, the recession is likely to last longer than the current consensus of a V-shaped rebound. As well, my own historical reviews of bear market bottoms since 1929 (see 2020 bounce = 1987, or 1929?) suggests that the current rally is a bear market rally. If history is any guide, the market will retrace the advance and return to retest the lows at some point in the future. There is no guarantee that the retest will be successful.
My base case scenario, based on an assessment of the fundamental risks and market history, calls for a long drawn out bottoming process of some unknown nature.
Please stay tuned tomorrow for our tactical trading analysis.