Preface: Explaining our market timing models
We maintain several market timing models, each with differing time horizons. The “Ultimate Market Timing Model” is a long-term market timing model based on the research outlined in our post, Building the ultimate market timing model. This model tends to generate only a handful of signals each decade.
The Trend Model is an asset allocation model which applies trend following principles based on the inputs of global stock and commodity price. This model has a shorter time horizon and tends to turn over about 4-6 times a year. In essence, it seeks to answer the question, “Is the trend in the global economy expansion (bullish) or contraction (bearish)?”
My inner trader uses a trading model, which is a blend of price momentum (is the Trend Model becoming more bullish, or bearish?) and overbought/oversold extremes (don’t buy if the trend is overbought, and vice versa). Subscribers receive real-time alerts of model changes, and a hypothetical trading record of the those email alerts are updated weekly here. The hypothetical trading record of the trading model of the real-time alerts that began in March 2016 is shown below.

The latest signals of each model are as follows:
- Ultimate market timing model: Buy equities
- Trend Model signal: Bearish
- Trading model: Neutral
Update schedule: I generally update model readings on my site on weekends and tweet mid-week observations at @humblestudent. Subscribers receive real-time alerts of trading model changes, and a hypothetical trading record of the those email alerts is shown here.
An upside breakout
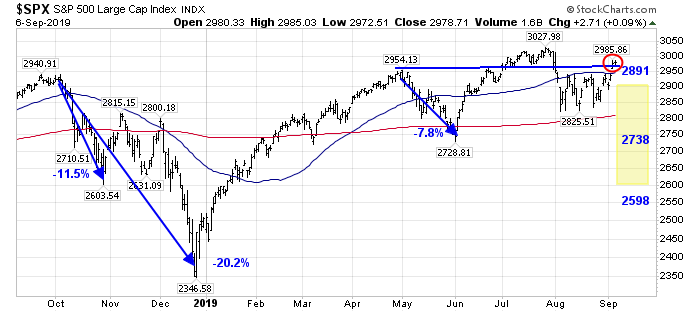
About a month ago, I suggested that the market was in need of a valuation reset, and outlined a price and forward P/E range for the market (see Powell’s dilemma (and why it matters)). Since then, the index weakened into the top of my projected range, followed by an upside breakout from a month-long trading range.
Is it time to buy the breakout?
I believe that the decision on whether to chase the S&P 500 upside breakout is dependent on investor time horizon. The combination of a crowded short sentiment levels and positive price momentum can lead to powerful price surges. Traders can therefore take advantage of these conditions to ride the rally. In all likelihood, the S&P 500 will rise to test and possibly exceed the previous all-time highs in the coming weeks.
However, the longer term viewpoint is less bullish. Investment oriented accounts should take advantage of the market strength to fade the rally if they are overweight equities and rebalance to either a neutral or an underweight position. Valuations are stretched, the earnings outlook is mixed, and macro tail-risks remain unresolved.
A sentiment driven rally
The underpinnings of the market rally can be attributable to excessively bearish sentiment. The advance began last Wednesday on the news that Hong Kong chief Carrie Lam had withdrawn the controversial extradition bill, and the British parliament had passed measures that made a no-deal Brexit more unlikely. Stock prices gained further the next day on the news that US and Chinese trade negotiators would be meeting in early October.
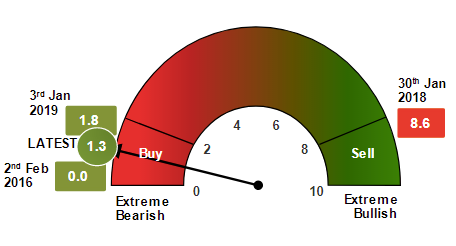
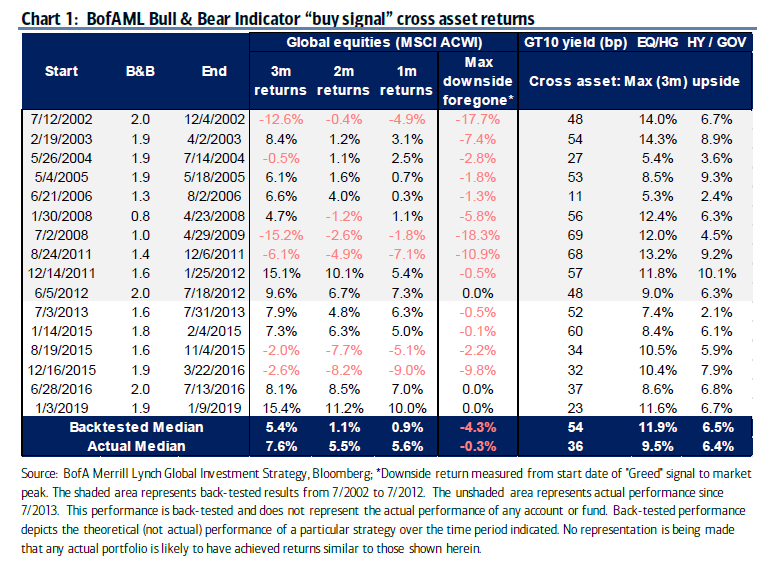
Marketwatch reported that BAML strategist Michael Harnett`s Bull and Bear Indicator had flashed a contrarian buy signal, and the signal was based mainly on excessively bearish sentiment:
B. of A.’s Bull and Bear Indicator, which tracks 18 measurements on asset flow, sentiment, and price, is flashing a contrarian buy signal that hasn’t been seen since way back in January. The drop in the reading was driven in large part by asset flows out of equity and emerging market debt, Harnett said.
The indicator has a solid track record of predicting what’s next. Since 2000, global stocks rose a median 6.3% in the three months after such a buy signal was triggered, while 10-year Treasury yields increased 50 basis points.
Indeed, retail sentiment, as measured by the AAII bull-bear spread, had reached a crowded short reading in late July, and it had been recovering ever since.

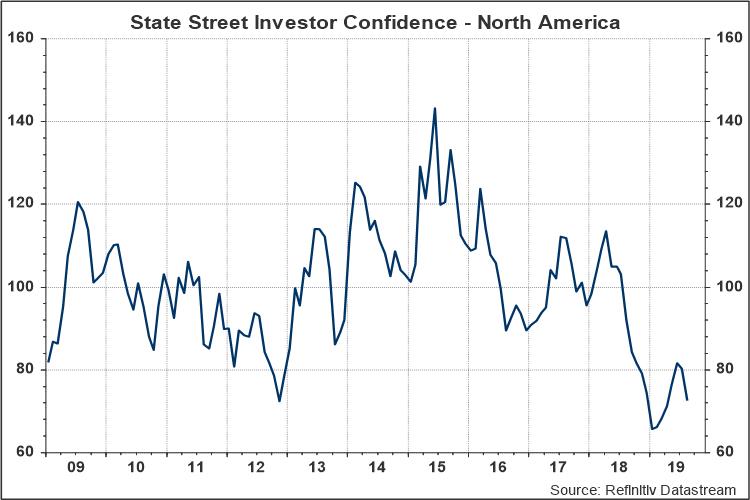
Institutional sentiment has also been excessively bearish. The State Street North American Investor Confidence Index, which measures the actual positioning of portfolio managers, have also reached levels consistent with contrarian buy signals.
Given the general tone of bearishness, it was therefore little surprise that good news on the geopolitical, political, and trade fronts sparked a risk-on stampede.
The 2011 market template
I have also suggested in these pages in the past that 2011 could serve as a useful template for today`s market. The summer of 2011 was marked by high anxiety and uncertainty over a budget impasse in Washington, and a eurozone Greek Crisis. That period was marked by endless European summits, and meetings to talk about meetings. The crisis was eventually resolved when the ECB stepped in with its LTRO program as a way of buying time for member states to enact structural reforms.
Fast forward to 2019, the market is marked by anxiety over a global economic slowdown and possible recession, a Sino-American trade war, Brexit fears, and rising political tension in Hong Kong.
From a technical perspective, the consolidation period in 2011 from August to mid-October was constructive. Bearish momentum was fading, as the 5-day RSI flashed a series of higher lows even as the index repeatedly tested support. Sentiment indicators were supportive of an eventual advance, as the put/call ratio, VIX term structure, and AAII sentiment all saw fear fading. In addition, breadth was improving, as measured by an uptrend in 52-week new highs.
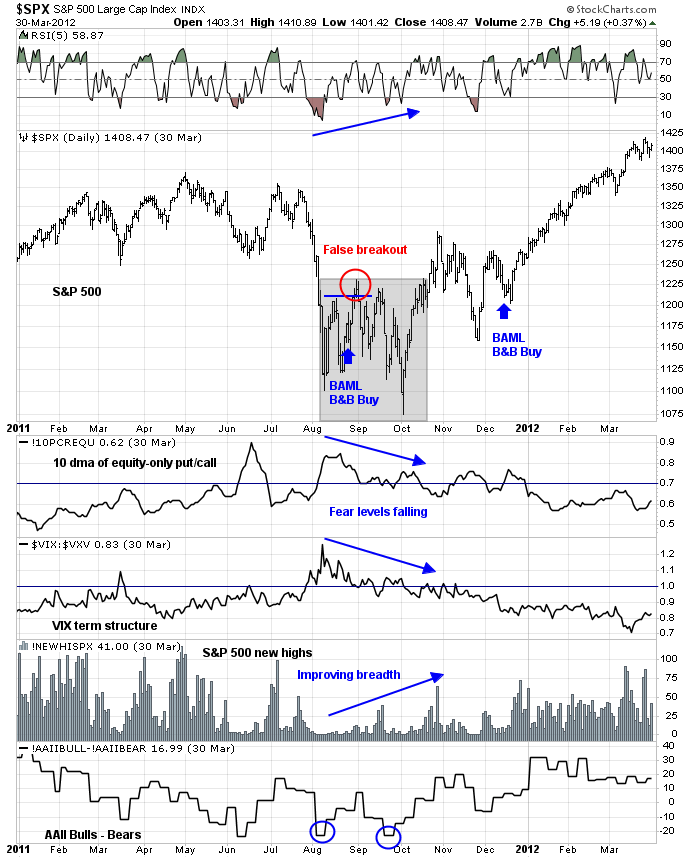
However, the market did stage a false breakout after a month of consolidation in early September. At that time, all of the momentum, sentiment, and breadth indicators were also helpfully bullish. Coincidentally, the BAML Bull and Bear Indicator also flashed a buy signal just before the false breakout. This false breakout was one of the few historical failures of the BAML Buy and Bear buy signal, though the indicator did later flash a useful buy signal in December 2011.
Is today`s market surge a real upside breakout, or just a fake-out?
A comparison of today’s market technical conditions with those from 2011 is not helpful in answering that question. Just like 2011, the momentum, sentiment, and breadth indicators are flashing bullish signals, and the BAML Bull and Bear Indicator also turned bullish.

2011, then and now
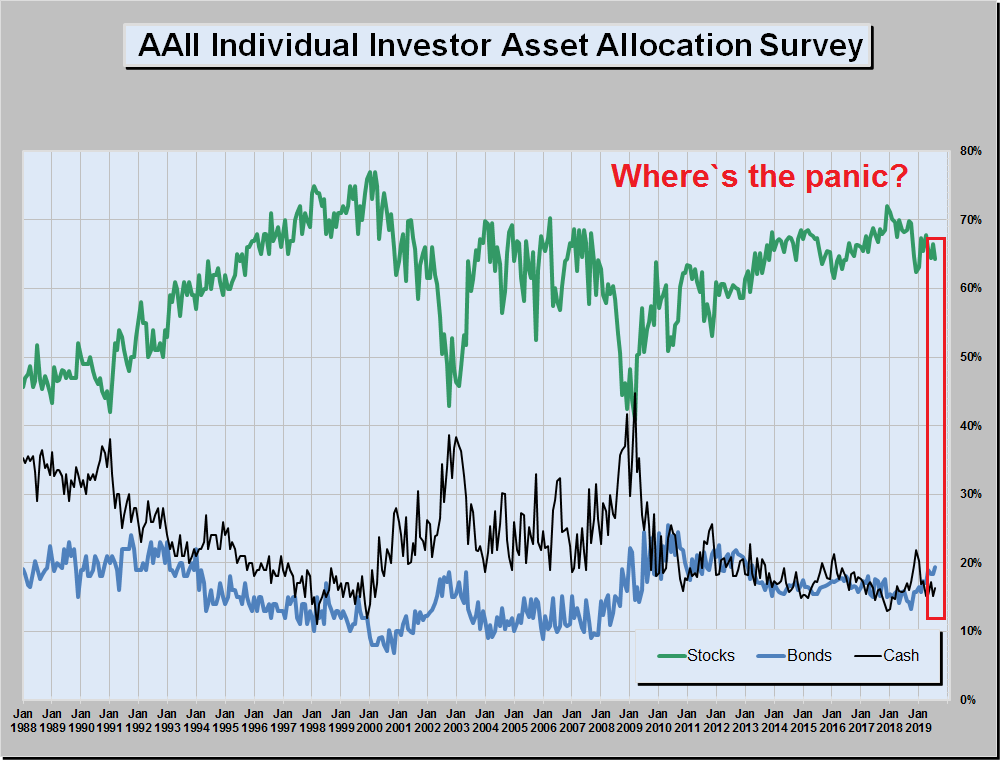
While the technical conditions are similar, there are a number of key differences. Let us start with sentiment, which was the principal basis for this rally. The weekly AAII survey asks what members think of the market, and since opinions can change quickly, survey readings can be volatile. By contrast, the more important monthly AAII asset allocation survey asks what members are actually doing with their money, and those readings tend to be more stable. The AAII asset allocation survey shows that while equity bullishness has retreated, overall readings are nowhere near the panic levels consistent with an intermediate term bottom.
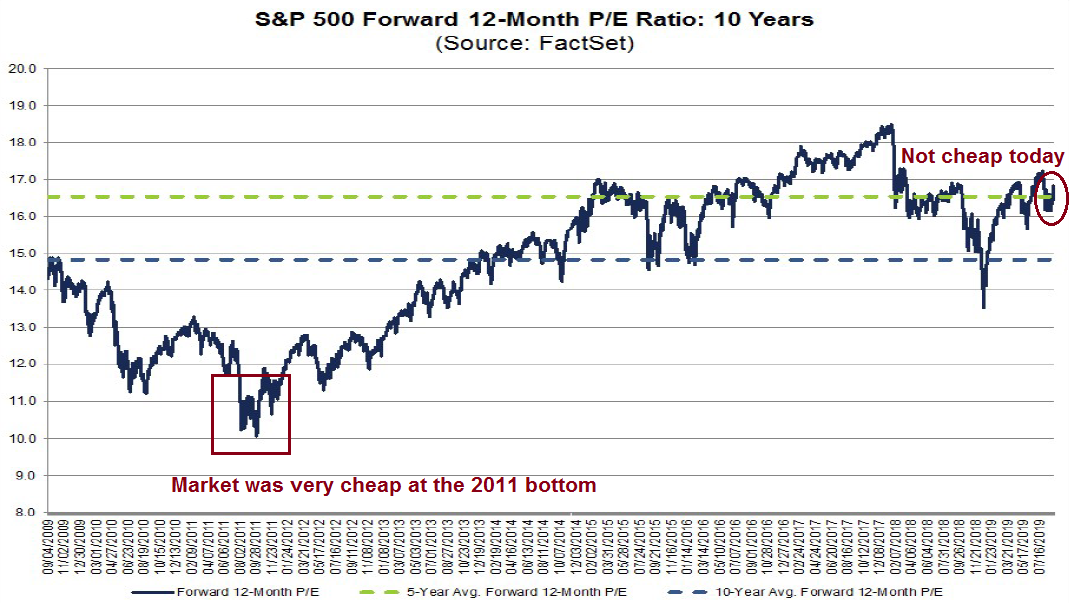
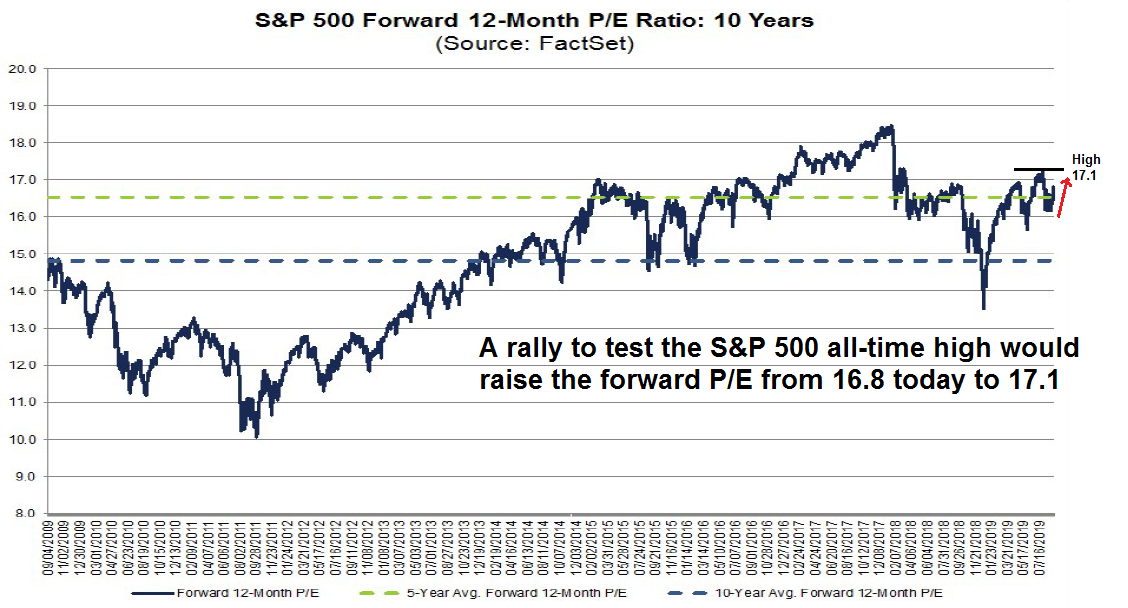
As well, valuations are far more demanding today compared to 2011. The forward P/E ratio during the 2011 range-bound period was extremely low by historical standards. By comparison, the market is trading at an elevated forward P/E of 16.8, which is above both its 5 and 10 year averages, and just below its peak of 17.1 achieved in late July.
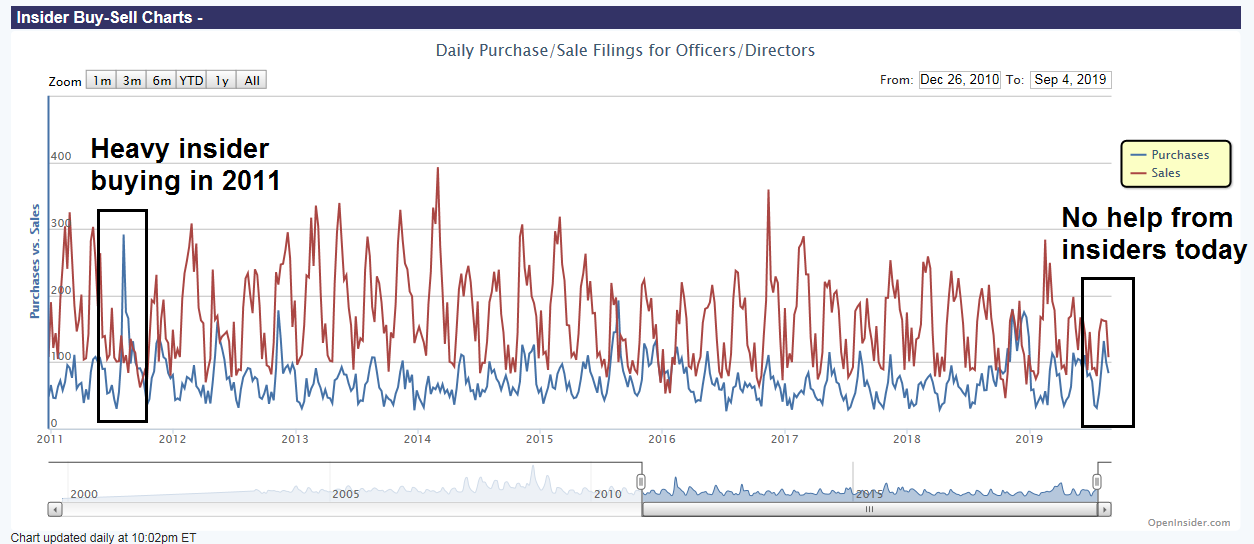
Perhaps as a result of the dirt cheap valuations, the 2011 bottom saw a cluster of heavy insider buying. On the other hand, there is no similar pattern of support from this group of “smart investors” today.
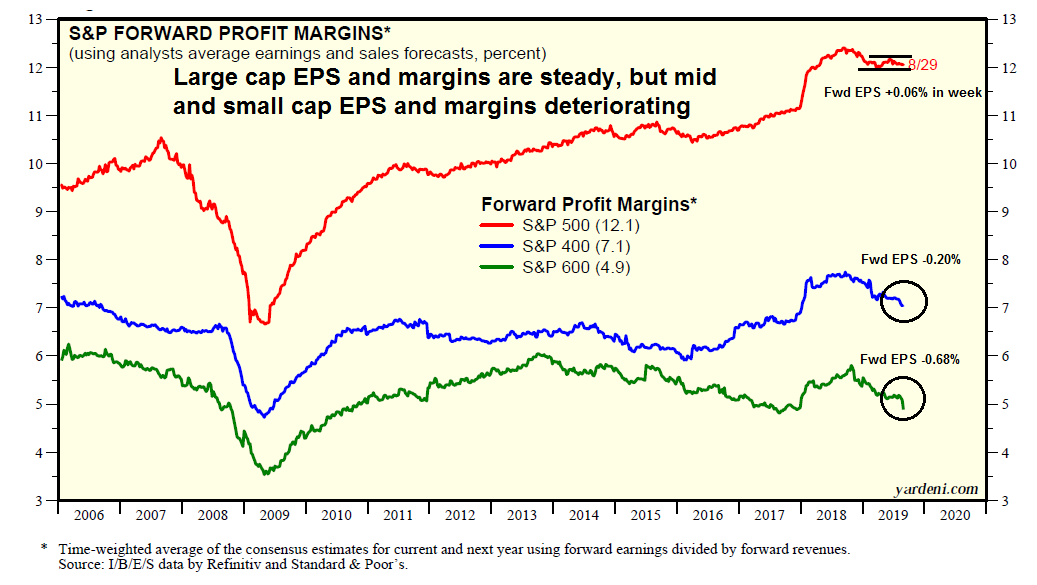
The earnings outlook presents a mixed picture today. Analysis from Yardeni Research, Inc. (YRI) shows that while forward 12-month margins and EPS revisions are flat to up for large cap stocks, they are deteriorating for mid and small caps (annotations are mine, while estimate revision calculations are based on YRI data).
From a top-down perspective, it is difficult to see much earnings growth visibility. The Atlanta Fed’s Q3 nowcast of GDP growth is 1.5%, and the New York Fed’s nowcast is 1.6%. In all likelihood, earnings growth is likely to decelerate as GDP growth slows from 3.1% in Q1, and 2.0% in Q2 to below 2% in Q3.
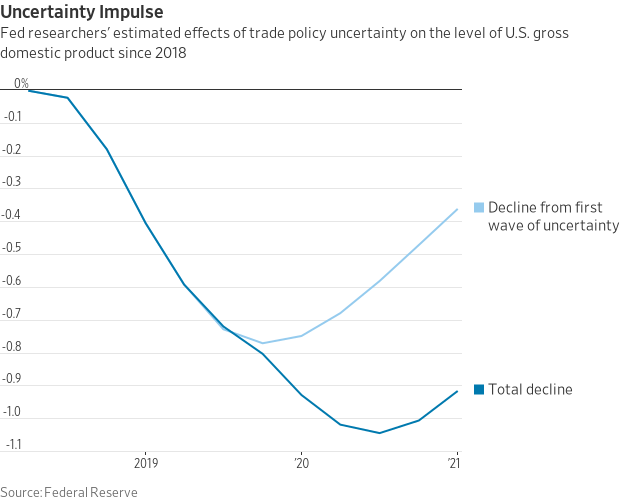
The trade war is indeed cutting GDP growth. A newly published Fed study tried to quantify these effects. The researchers did a textual analysis of major newspapers by “searching for terms related to uncertainty–such as risk, threat, uncertainty, and others–that appear in the same article as a term related to trade policy–such as tariff, import duty, import barrier, and anti-dumping”. They then correlated the frequency of these trade policy uncertainty (TPU) with variables of economic output. The Fed researchers concluded that uncertainty had knocked about 1.0% from GDP growth:
We find that the rise in TPU in the first half of 2018 accounts for a decline in the level of global GDP of about 0.8 percent by the first half of 2019. Had trade tensions not escalated again in May and June 2019, the drag on GDP would have subsequently started to ease. However, renewed uncertainty since May of 2019 points to additional knock-on effects that may push down GDP further in the second half of 2019 and in 2020.
Even though market risk appetite was buoyed by the news that American and Chinese negotiators are scheduled to meet again, the reality is there is enormous daylight between the positions of both sides. Xi Jinping mentioned the word “struggle” 60 times in a speech published last week in official media, which is a signal that China is digging for a protracted trade war. The US economy appears to be sidestepping a recession, and as long as the economic pain is manageable ahead of the 2020 election, Trump is unlikely to offer significant concessions.
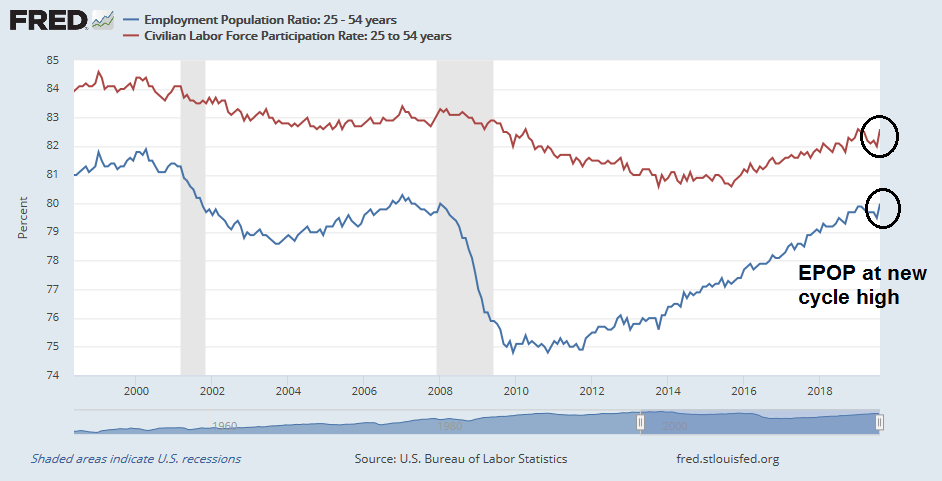
Last Friday’s Jobs Report offers an example of a slowing, but non-recessionary, economy. The headline Non-Farm Payroll growth missed expectations at 130K, compared to an expected 160K. But internals reveal a picture of still robust employment. Both the prime age participation rate (LFPR) and the employment-population rate spiked, and prime age EPOP reached a new cycle high. These are not recessionary conditions.
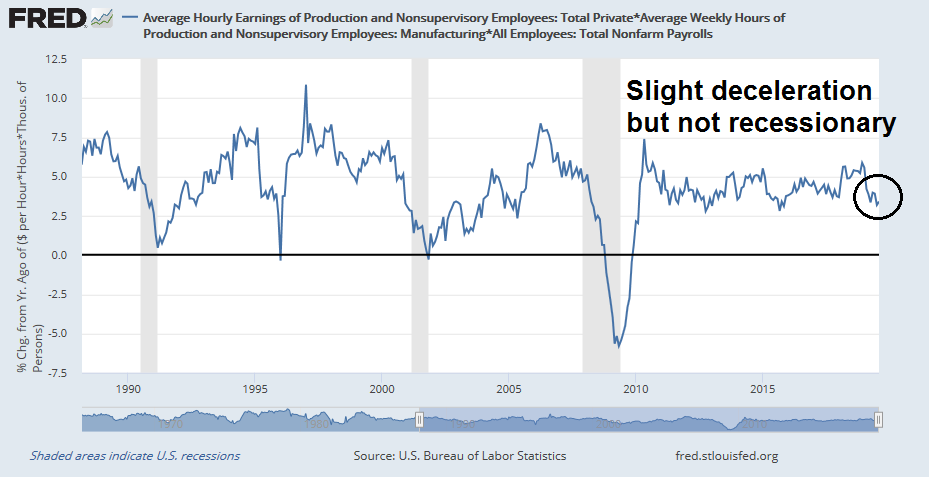
Average hourly earnings grew at an above expected rate of 3.2%, and average weekly hours edged up back to 34.4 from a weaker than expected 34.3 the previous month. Our income proxy, which is a multiple of average hourly earnings, hours worked, and people employed, shows no recessionary signs. In short, the economy is slowing, but the pain is tolerable, and it is difficult to see how Tariff Man will give much ground.
Ultimately, stock prices depend on earnings, and valuation. If earnings momentum is mixed, and valuations are demanding, where’s the upside? The final 2011 upside breakout was sparked by ECB action, which took tail-risk off the table. Today, considerable tail-risk remains. American and Chinese negotiation positions are miles apart, and the risk of a new European front in the trade war is very real; Hong Kong protesters do not appear to be backing down from their demands; and the Brexit drama has not been fully resolved.
In conclusion, the decision on whether to chase the S&P 500 upside breakout is dependent on investor time horizon. The combination of a crowded short sentiment levels and positive price momentum can lead to powerful price surges. Traders can therefore take advantage of these conditions to ride the rally. The S&P 500 could rise to test and possibly exceed the previous all-time highs in the near future.
However, the longer term viewpoint is less bullish. Investment oriented accounts should take advantage of the market strength to fade the rally if they are overweight equities and rebalance to either a neutral or an underweight position. Valuations are stretched, the earnings outlook is mixed, and macro tail-risks remain unresolved.
The week ahead
Marketwatch reported that crowded short sentiment readings were the main reason which drove the BAML Bull and Bear Indicator into a buy signal. Returns after the signals are indeed impressive. Stock prices advanced roughly two-third of the time after the signal, and the median MSCI All-Country World Index (ACWI) 3-month return was 7.8%.
While short-term price momentum has been impressive during this latest price surge episode, and there is probably a bit more upside to prices, the odds are high that this buy signal belongs to the one-third group that failed. Let us consider the bull and bear cases.
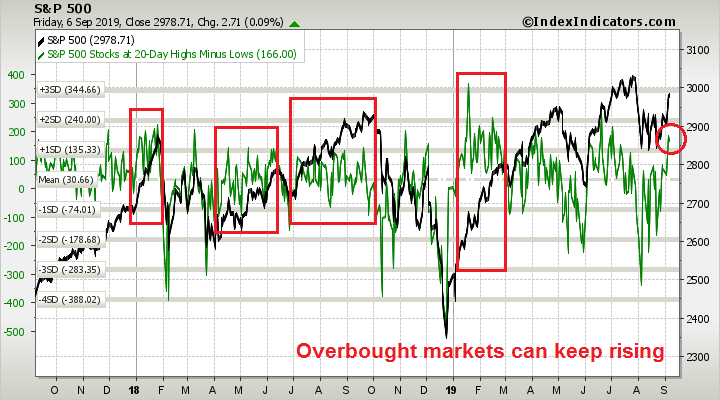
In the short run, the market is overbought and extended. However, history has shown that overbought markets can keep rising as it flashes a series of “good overbought” conditions. How can we distinguish between “good overbought” and “bad overbought”?
Technical analyst Walter Deemer pointed out that the market had experienced three 80% upside days in a five day period, which is a strong bullish signal. There were 38 such episodes since 1970, and forward returns have historically been bullish.

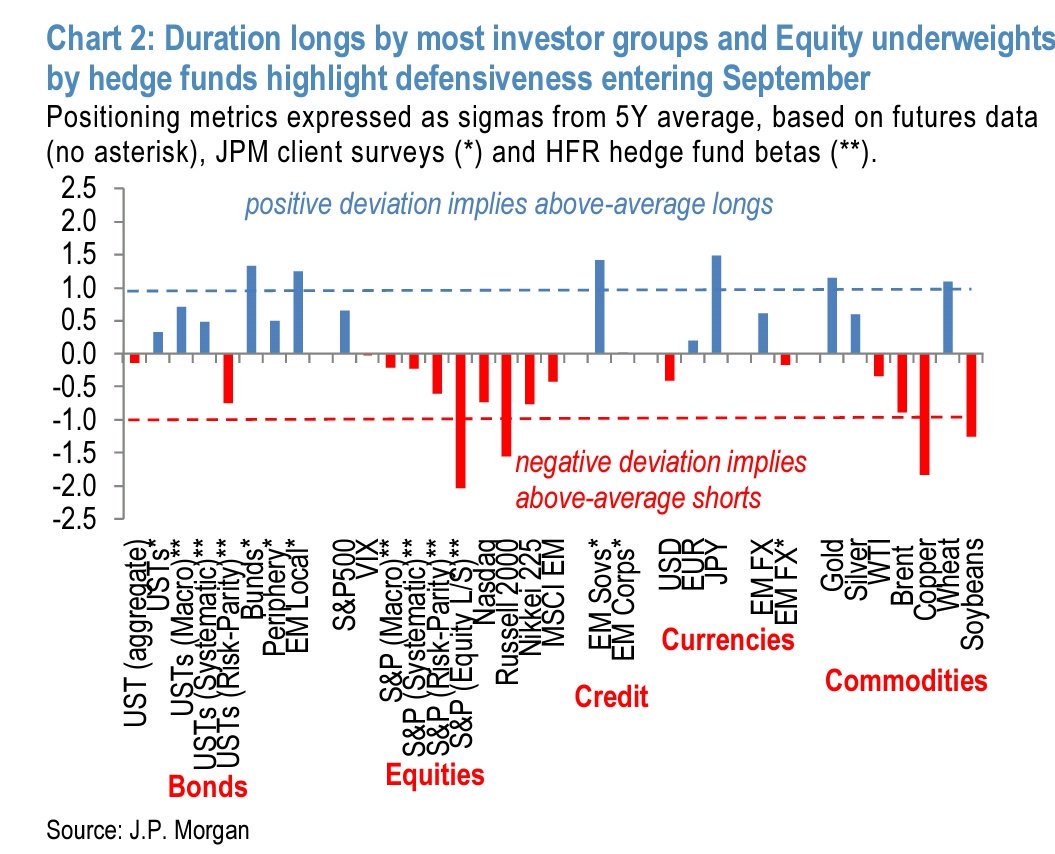
Make not mistake, last week`s risk-on price surge was a short covering rally that was news driven. Callum Thomas highlighted analysis from JPM which indicated hedge fund positioning was mainly long defensive plays, such as bonds, gold, and JPY, and short stocks.
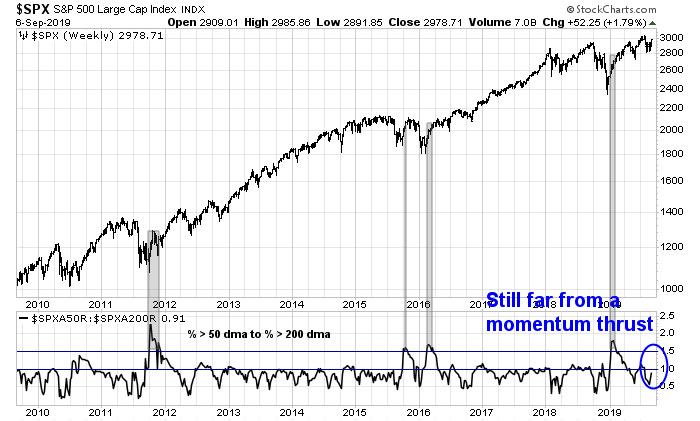
How far will the short covering rally run? Price momentum bulls should not put the cart before the horse. The chart below depicts the ratio of % above the 50 dma to % 200 dma as an indicator of price momentum. Past strong momentum thrusts that accompany market advances have seen the ratio spike above 1.5. Current conditions are far from a momentum thrust, and in fact, the ratio has not even exceeded 1.0 yet.
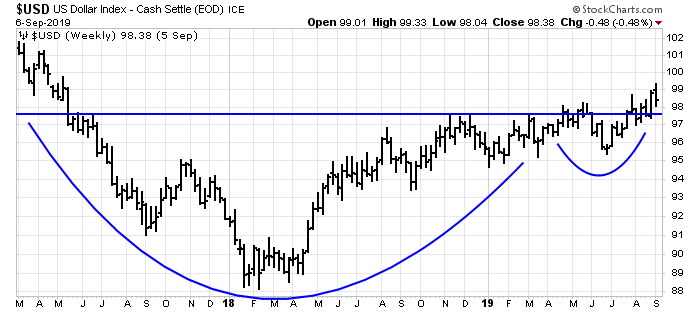
Another view of the market can be found from cross-asset, or inter-market, analysis. The recent strength of the USD has created headwinds for risky assets. As the chart below shows, the USD Index broke up from an inverse head and shoulders pattern and also reached its target. Conversely, the EURUSD exchange rate broke down through a head and shoulders pattern and also reached its target. It was time for a pause, and the pause coincided with the current risk-on episode. The pause may not last very long. Both the USD Index and EURUSD are also tracing out symmetrical bull and bear flags, which are continuation patterns. The trigger may be the September 12 ECB meeting when it may ease further. Such an event would put downward pressure on the euro and upward pressure on the dollar.

Should the USD Index resume its rise, the rally has the potential to shift risk appetite from bullish to bearish. The longer term weekly chart of the USD Index remains bullish, as it has staged an upside breakout from a cup and handle formation. As I have pointed out before, the anticipated Treasury financing as a result of the budget ceiling deal will draw liquidity from the banking system and create a dollar shortage. This is a bullish environment for the greenback.
To be sure, bullish price momentum could continue, and there is a reasonable chance the market will test its all-time highs. A test of the old highs will have to overcome valuation hurdles, however. The market is currently trading at a forward P/E of 16.8, and a rapid test of the old highs will raise the forward P/E to 17.1, which equals the recent valuation high achieved in late July. In short, a breakout to fresh highs is likely to lack valuation support. Buying here is a pure bet on the market’s animal spirits and the Greater Fool theory of selling an over-valued asset to the next fool.
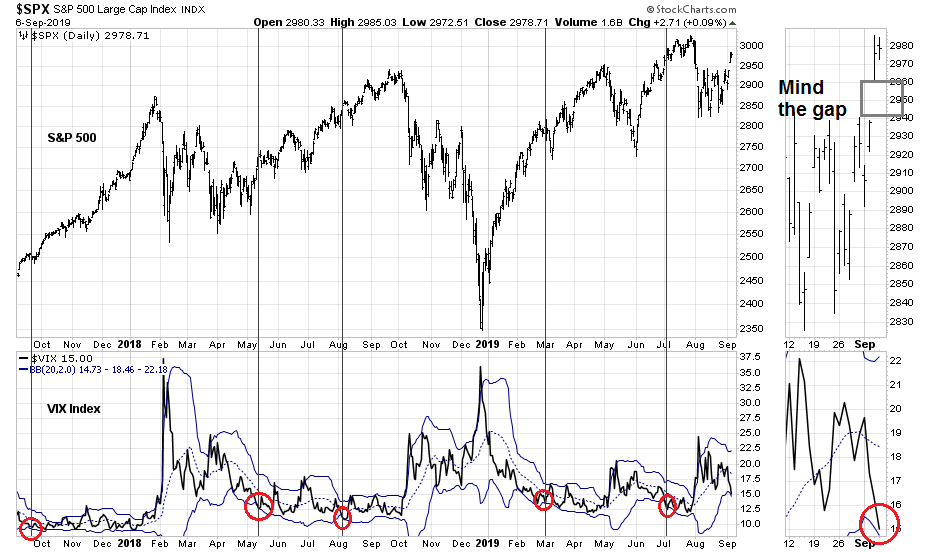
Should the bulls push the market higher early next week, I am tactically watching the behavior of the VIX Index. The VIX almost fell below its lower Bollinger Band on Friday. In the past, such episodes have seen market advances stall, which would represent an opportunity to enter a tactical short position. Another possibility is the index retreats and fills the gap at 2940-2960, which would be a good level to buy if you are bullish.
My inner investor remains cautiously positioned, and he is targeting an equity weight that is slightly below his investment policy equity target. My inner trader was stopped out of his short position, and he is in cash. He believes that the risk/reward is unfavorable on the long side, and he is waiting for an opportune time to re-enter his short position, preferably at a higher level.
Beautiful analysis, Cam. No one does a better job of assimilating/deconstructing all the ‘stuff’ out there and then reassembling the pieces into a coherent strategy.
I totally agree. Amazing work. Thanks.
Cam
Thanks for your as always very insightful analysis. I would appreciate if you would help me understand the message from BAML analyst Michael Harnett. He is calling for a rally in equities but seems quite bearish on growth and credit into the next decade. What does “credit” refer to, simply below investment grade corporate bonds?
He refers to “deflationary and inflationary assets”. What are these?
I suppose, “inflationary assets” would be real assets like farmland, gold, commodities (oil included?), fueled by what he suggests a (higher) tax and spend economy. He is suggesting value stocks as likely to outperform growth. You have also recently suggested considering Berkshire Hathaway, and others in the value segment (Europe, EMs), as buys, to balance out “growthy” portfolios (referencing your masterpiece of an article, peering into 2020, new decade, new Paradigm).
I find Michael Harnett’s comments cryptic. Do you agree, that it may be time to look at adding “inflation hedges” to long running portfolios? Last two decades have been deflationary, and I suppose, at some point, inflation must rear its ugly head (so far all quiet on the inflation front). Thanks in advance for your insights into the referenced article.
Inflation and inflationary assets are inflation hedges, such as gold, oil, natural resource producers, collectibles, etc. As well, companies with high leverage should benefit because they can outperform with low priced debt.
Credit markets = Bond market
I generally agree with Hartnett’s assessment, though timing the turn is never easy.
Companies with high leverage sounds like a basket of high growth names (Uber and Lyft may be poster childs in this group). With credit markets projected to turn down in the next decade, wouldn’t some of these names underperform the more mature names that are more creditworthy?
Sure, timing the ‘turn’ is always hard. That said, silver and gold may have made the ‘turn’ (for different reasons than inflation).
I think indeed precious metals have made the turn, but for other reasons than inflation. This article of Alhambra’s jeff snider puts things in perspective very well: https://www.alhambrapartners.com/2019/08/30/gold-big-difference-which-kind-of-hedge-it-truly-is/
Precious metals still make most sense to me as the real assets to own now plus they do provide an amazing hedge against the fiscal and MMT like policies we might encounter across the world in the future.
If no one has already mentioned it, I wanted to point out that one could have guessed back in August that SPX was about to break out to the upside, because the sequence of bottoms in August was moving higher, and following a fairly smooth curve that was curving upward. See this chart: 3 Months of SPX . But I myself didn’t notice this until after the breakout had occurred.
Amazing work, Cam. As usual. Must be said. Thanks.