Mid-week market update: Global markets have taken a decided risk-on tone today on the news that Hong Kong leader Carrie Lam has withdrawn the controversial extradition bill. As well, the revolt in the British parliament has lessened the chances of a chaotic no-deal Brexit on October 31. On the other hand, the market was hit by some somber news earlier in the week, when the PMI reports revealed a slowing global economy.
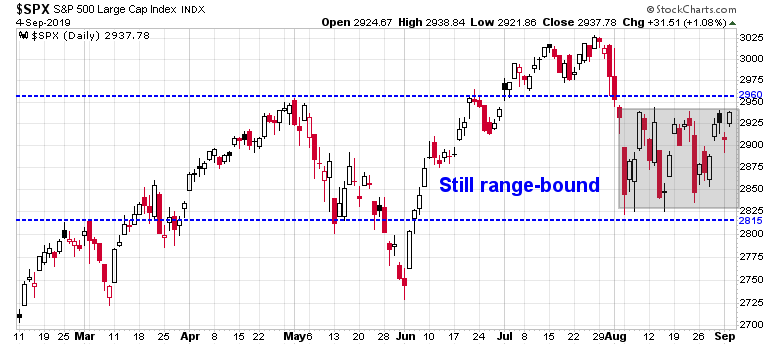
In the meantime, US equity prices remain range-bound.
Should we interpret these developments as net bullish or bearish? The answer is, “Yes”
The bear case
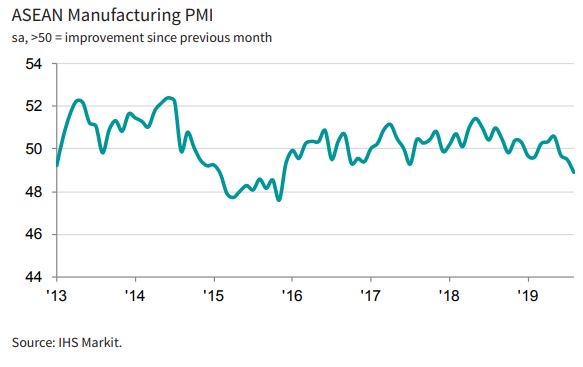
The bear case is easy to make. You would have to be from Mars to know that Chinese economic statistics are unreliable, but investors can glean some hints on China by observing the economies of her major Asian trading partners. ASEAN manufacturing PMI fell to 48.5 in August, which was the fastest deterioration since the mild producer recession in 2015.
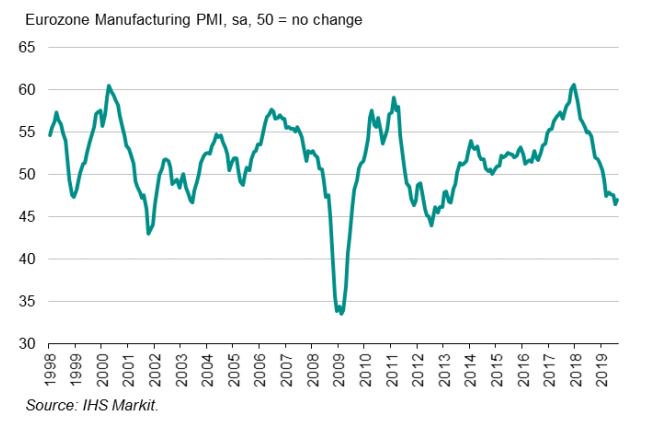
Eurozone manufacturing PMI remained in contraction territory in August, though conditions improved from July. Intermediate and investment goods sectors remained in a downturn, while consumer goods saw a solid upturn. Germany, which has been the growth locomotive of Europe, is either in or nearing recession.
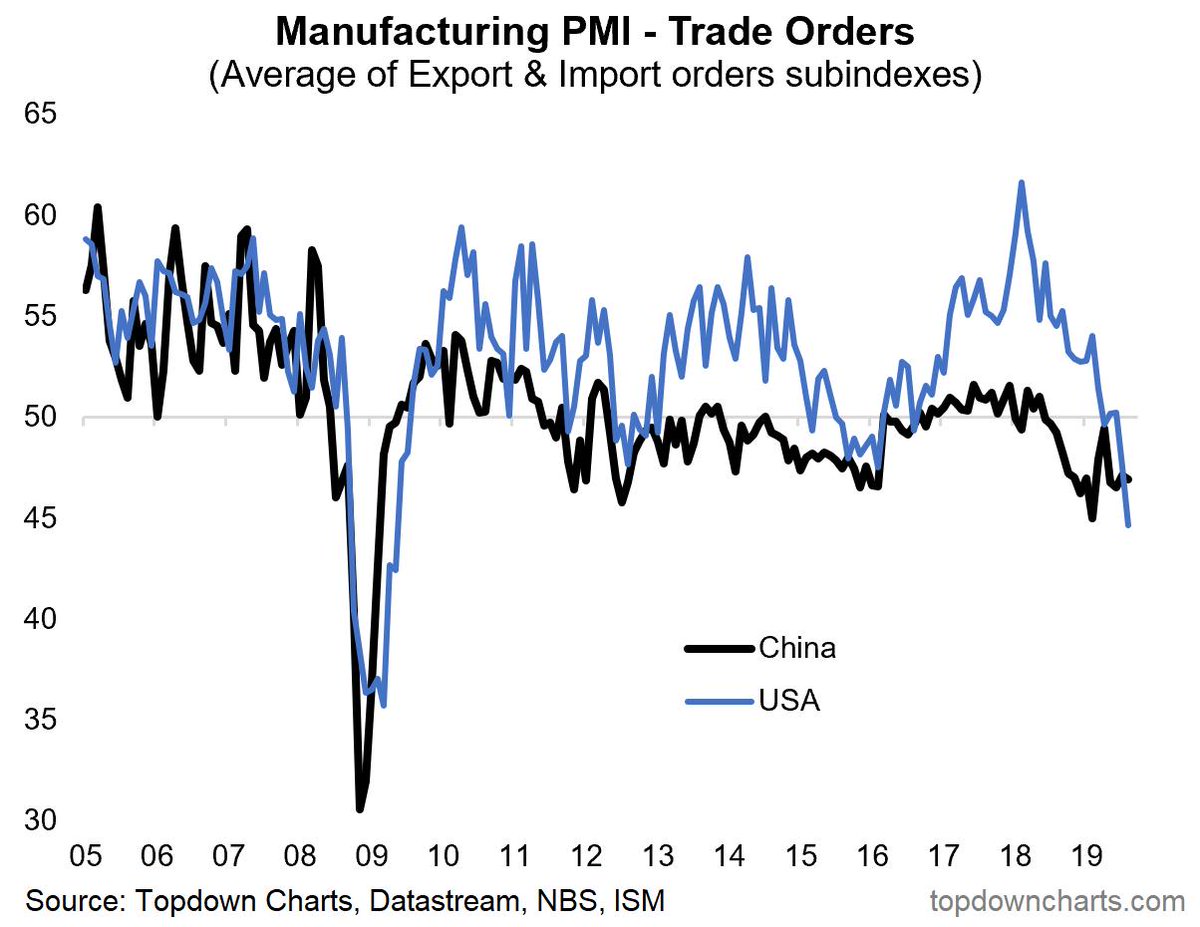
In the US, ISM manufacturing fell below 50, which is contraction territory and below market expectations. The trade war is starting to bite, as evidenced by the new export orders components of both US and China’s PMIs.
This is all rather alarming. John Authers pointed out that ISM tends to lead GDP growth by about six months, indicating soft growth ahead.
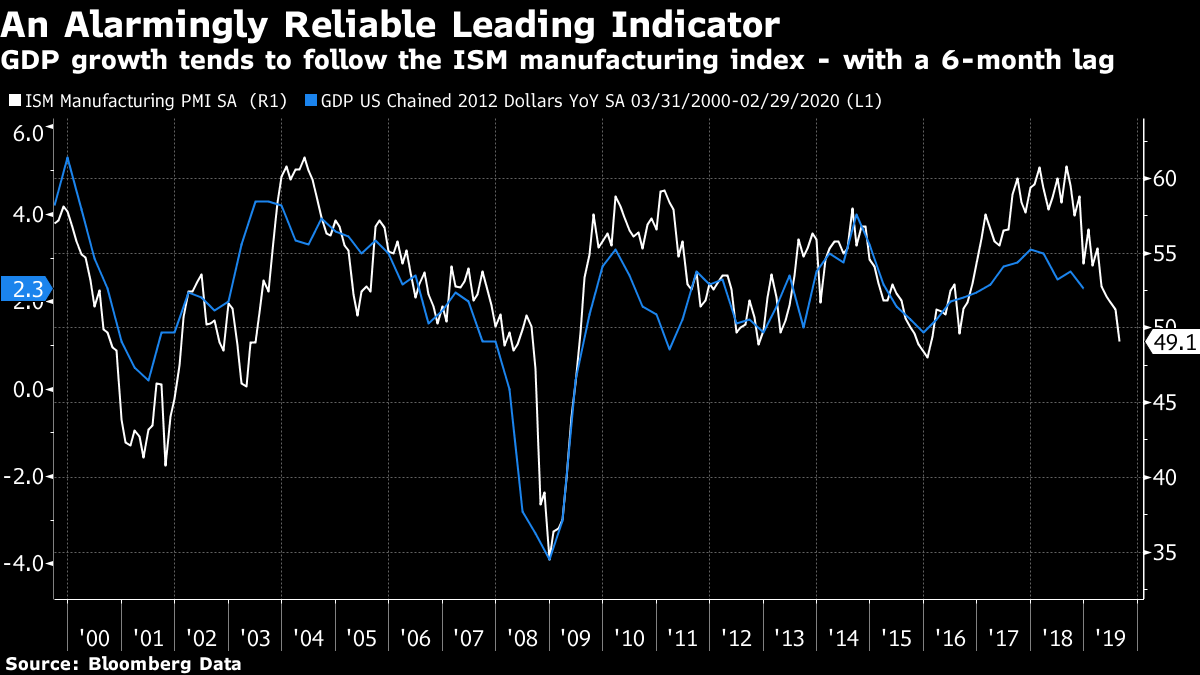
Authers further observed that inventories are piling up, which is another bad sign for the economy.
If the headline of the ISM report was bad, the details were worse. Much of the business cycle is driven by the interplay between inventories and new orders. When inventories are high and new orders dwindle, there is scarcely any need for new production and economic activity stalls. When inventories have been run down and new orders recover, however, the conditions are there for a restocking boom that ends a recession. Unfortunately inventories now exceed new orders for the first time in seven years.

The bull case
Here is the bull case. The markets look ahead, and the market’s recent action suggests that much of the bad news has already been discounted. Consider the stock markets of China and her major Asian partners. If the outlook is so dire, where are the new lows? To be sure, the Hong Kong market has been beset by political uncertainty, and the South Korean market is especially sensitive to the semiconductor cycle, and the trade spat with Japan. The charts of the other markets, including the Shanghai Composite, have not set 52-week lows.

Similarly, where are the new lows in the stock markets of the eurozone. The chart below shows the stock indices of the core and peripheral markets. None are anywhere near fresh lows.

In the US, ISM’s own analysis indicates that the current reading corresponds to a GDP growth of 1.8%:
The past relationship between the PMI® and the overall economy indicates that the PMI® for August (49.1 percent) corresponds to a 1.8-percent increase in real gross domestic product (GDP) on an annualized basis.
That figure is roughly in line with the Atlanta Fed’s Q3 GDPNow of 1.5%, and the New York Fed’s nowcast of 1.8%.
Recessions are bull market killers. The American economy may be slowing, but it is not showing any signs that it is about to enter into a recession. What are you so worried about?
Headline risk
There are two key risks that investors need to consider. The first is headline risk. The market reaction today to the Hong Kong and Brexit news illustrates the upside and downside potentials of headline risk.
The biggest downside headline risk is trade. The latest news shows that while US and Chinese representatives have agreed to meet, they can’t even agree on a meeting date, nor can they even agree on the agenda to be discussed.
Former New York Fed president Bill Dudley wrote another Bloomberg op-ed today, which clarified his much criticized position on “The Fed Shouldn’t Enable Donald Trump”. Here is his key point [emphasis added]:
In my judgment, there is a risk that the Fed, by easing, might encourage the president to take even more aggressive actions on trade and in raising tariffs. This might create even greater downside risks for the economy that monetary policy might prove ill-suited to address.
But the Fed’s problems might not end there. Not only might the Fed be unable to rescue the economy, but it also might be blamed for the economy’s poor performance. This risk is higher because of the president’s ongoing attacks on the Fed.
I wanted the Fed to be more explicit that the greatest risk to the economy was the uncertainty created by the U.S. trade war with China. By making this clear, the Fed would increase President Trump’s stake in that downside risk. As a result, with more at stake, the president might be more attentive to the risks the trade war posed to the U.S. economy.
In effect, Dudley outlined my Dow Man-Tariff Man characterization of Trump’s negotiating tactics. When the markets are weak, Dow Man will do whatever he can, such as pressuring the Fed or adopting a conciliatory negotiating stance, to boost the economy and stock prices. As the markets rise, Tariff Man feels that he has sufficient cushion to get tough with the Chinese. That’s why Bloomberg reported that the Chinese consider “Trump’s credibility has become a key obstacle for China to reach a lasting deal”; and the WSJ reported, “Through a series of vacillating threats and entreaties that often seem to be decided on a whim, he has shown President Xi Jinping that he is an unreliable negotiator”. If Dow Man makes a deal, can Beijing be assured that Tariff Man will follow through?
The risks to trade is not just isolated to just China. The US has a simmering trade dispute with the EU, and it is scheduled to make a decision on escalating tariffs on selected items like European cars and French wines in November.
The rising USD
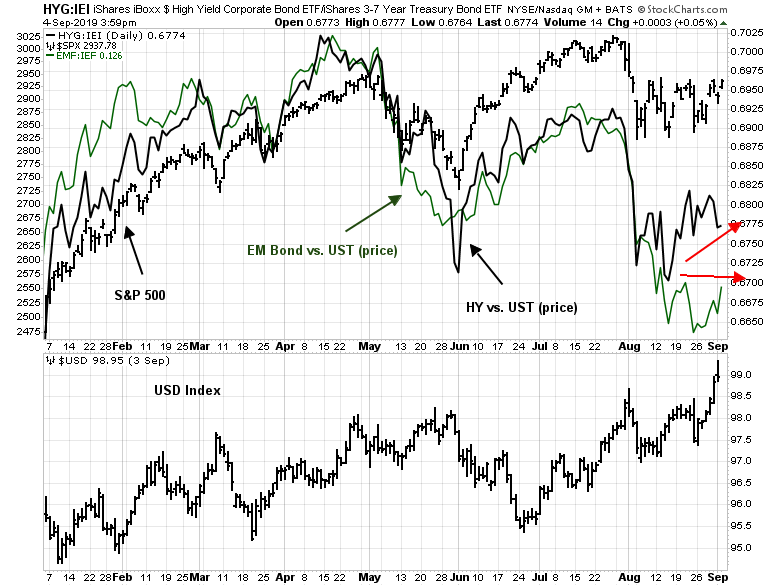
Another key risk is the strength of the USD. Greenback strength has pressured weak EM markets and economies. As the chart below shows, while the relative price returns of US high yield (junk) bonds have not confirmed the recent stock market strength, EM bonds have underperformed HY as the USD rose.
An academic study by Boz (IMF), Gopinach (Harvard), and Plagborg-Møller (Princeton) entitled “Global Trade and the Dollar” found that “a 1% U.S. dollar appreciation against all other currencies in the world predicts a 0.6% decline within a year in the volume of total trade”.
Notwithstanding the negative effects of a strong USD on global trade, USD strength is putting pressure on the Chinese economy. The Chinese yuan has weakened as a consequence of dollar strength, and Beijing responded by tightening capital controls in order to reduce the risk of capital flight. Reuters reported that free trade zones, which were formed to encourage foreign investment, have languished because of capital controls.
The strong dollar has also strained Chinese companies’ offshore finances. Bloomberg reported a widening spread between Chinese corporate onshore debt and offshore debt:
Yields are moving in opposite directions in China’s junk bond market.
Offshore, demand has weakened as escalating trade tension and a slumping yuan dampen demand for dollar notes. Concern about property developers’ ability to refinance is adding to selling pressure. Onshore, yields are falling as liquidity improves in the wake of a bank bailout.
Average yield on Chinese high-yield dollar bonds rose about 105 basis points since end-June, according to an ICE BofAML Index. The yield on five-year AA rated yuan corporate bonds, considered high-yield in the onshore market, fell 34 basis points during the same period, ChinaBond data show. Issuance of bonds rated AA or below rose to a four-month high of 22.1 billion yuan ($3 billion) in August, while junk bond offerings in the greenback declined to two-year low, data compiled by Bloomberg show.
Depleted quotas and new restrictions on offshore issuance will also weigh on dollar bond sales from developers for the rest of the year, according to a Moody’s Corp. note on Friday. China’s property sector makes up the majority of the Asian high-yield bond universe.
The poster child of the deeply indebted property developers is China Evergrande. The company now owes US$113.7b, with $53b due to mature in the next 10 months alone. Debt jumped $20b in the first half.

Bloomberg’s recent profile of Evergrande CEO Hui Ka Yan tells the story of a house of cards built on debt:
Donald Trump once called himself the “king of debt.’’ Hui Ka Yan, China’s richest property mogul, has a much stronger claim to the throne.
No one has gotten wealthier on the back of a corporate borrowing binge than Hui. His junk-rated China Evergrande Group is not only the nation’s most indebted developer, it also has the highest leverage among companies underlying the world’s largest fortunes.
Hui, who has a net worth of $35 billion, is the 26th richest person in the Bloomberg Billionaires Index. Everyone above him for whom data is publicly available — from Amazon.com Inc.’s Jeff Bezos to Las Vegas Sands Corp.’s Sheldon Adelson — has grown their fortune via companies with far more conservative balance sheets.
In many ways, Hui is more emblematic of recent trends in global business than his richer peers. Worldwide corporate debt has swelled by 26 percent over the past decade to $132 trillion as companies have taken advantage of historically low interest rates to fund their growth. Like Evergrande, many have also used borrowed cash to repurchase shares and boost dividends.
The stock recently violated a key long-term support level. Despite last night’s reflex rally in Hong Kong, the stock remains below support, which is the market’s signal of possible trouble.

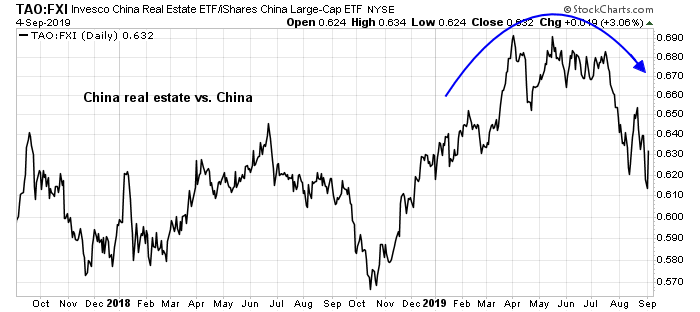
Is China Evergrande too big to fail? Only time will tell, but the recent poor relative performance of China’s real estate sector is an ominous sign.
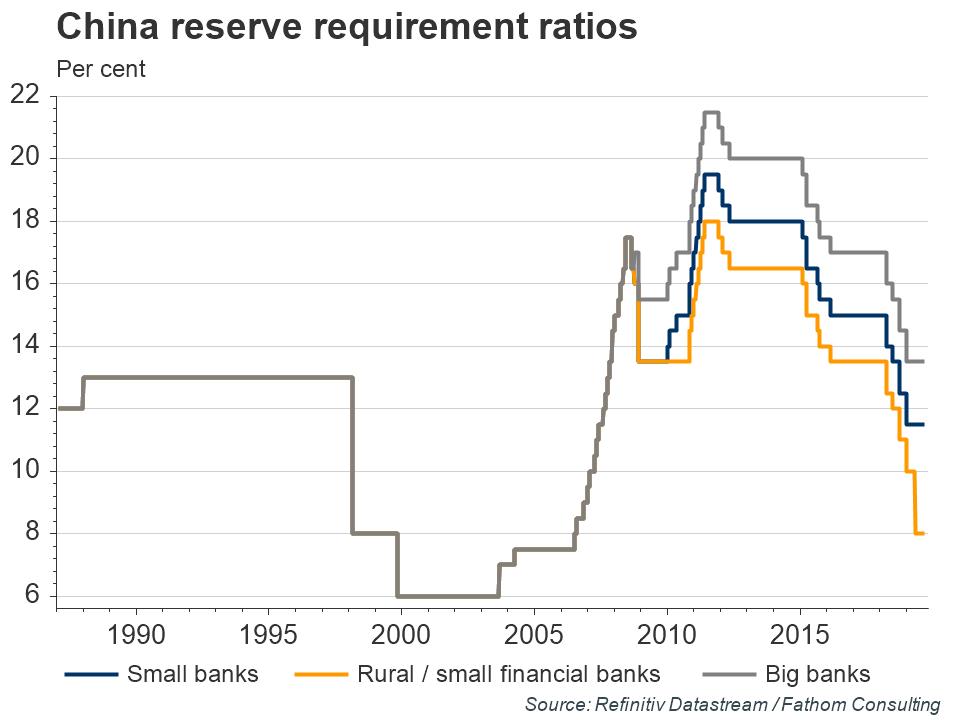
To be sure, Beijing’s policy makers have sufficient policy levers to cushion a disorderly unwind of the debt bubble. However, the costs of a rescue could be considerable, such as a devaluation and capital flight, or a Lost Decade of slow growth.
To conclude, the near-term outlook for the stock market is relatively balanced. Upside potential is balanced by downside risk. However, there is tail-risk in the form of headline trade tension risk, and the negative macro effects of USD strength.
My inner investor remains defensively positioned, and he is underweight equities. Until stock prices break out of its trading range, my inner trader is continuing to buy the dips, and sell the rips. As the market is at the top of the range, he is maintaining a short position, with a stop loss set at just above 2970.
Disclosure: Long SPXU
In my assessment the A-D line is already upward bound.
Can, when you indicate that your investor portfolio is defensive, what does that mean? Are you sector oriented, style oriented, etc. thanks ahead of time.
Defensive = Underweight equities vs policy target
I meant Cam. Sorry.
The new high in NYAD is really impressive this time. Maybe some breakout in price will come soon (overnight market already up a lot)
You may recall my comment about while the A-D Line was making new highs, the equal weighted S&P 500 and Value Line Geometric were lagging. Not sure what that means but this is not an unequivocally bullish sign.
The strength of the market is really surprising. The S&P futures just hit 2965. You may hit your stop quickly Cam.
Sept is quarter end. It means a lot of options expiration. There are a lot of ITM options causing gamma events. We have a good chance of rallying into Fri 9/20.
In early August, SentimenTrader projected a lag time of two months (based on a 9-10 day decline in EEM) before the start of another EM rally – but that number’s an average (or median, I can’t recall). The Wednesday move in the Hang Seng may go down as the starter pistol.
I wouldn’t rule out a +10% move on solid progress in trade relations. Much higher if an agreement is reached.
A tailwind might be an unwinding of the bond trade – a huge source of funds moving back into equities.