Traders are always interested in improving their techniques. Today, I would like to offer a framework for thinking about your trading, using the way fund sponsors evaluate investment managers, called the 5 Ps.
- People: Who are you, and what’s your experience and training?
- Performance: How have the returns been, and what kind of risk did you take to achieve those results?
- Philosophy: What makes you think you have an edge?
- Process: How do you implement the edge you have on the market?
- Portfolio: Does your portfolio reflect what you are saying about philosophy and process?
With the preface that there are never any single right answer in investing and trading, I will focus on “philosophy” and “process”.
Philosophy
Many neophytes have difficulty distinguishing between the idea of an investment philosophy, and investment process. I would encourage you to think about it this way. Trading is hard, and markets are mostly efficient. A philosophy describes why you think you found a market inefficiency.
Here is an example of what a trend-following Commodity Trading Advisor might write:
Economic systems exhibit trends, or serial correlation. For example, when an economy grows in one time period, the tendency in the next period is to continue growing. That’s a trend that investors can exploit.
Managers have to be prepared to answer hard questions about their investment philosophy. One of the most difficult is, “To achieve superior returns, you have to make bets. Under what circumstances will your returns be subpar?”
I have asked that of many traders and portfolio managers, and it is surprising how many have responded, “We beat the market under all conditions.”
That is a huge red flag, and it is an indication that the manager has not fully thought through his approach. If you are making a bet, and you don’t know why the bet might fail, then you are going to blow up one day.
Wesley Grey at Alpha Architect outlined a hypothetical example of what might happen if an investor had perfect knowledge (see Even God would get fired as an active investor). He first formed a series of stock portfolios by deciles, sorted by 5-year forward returns:
Starting on 1/1/1927 we compute the 5-year “look ahead” return for all common stocks for the 500 largest NYSE/NASDAQ/AMEX firms. For simplicity, we eliminate any firms that do not have returns for a full 60 months.(2) We look at gross returns and all returns are total returns including dividends. Next, we create decile portfolios based on the forward five-year compound annual growth rate (CAGR).
We rebalance the names in the portfolio on January 1st of every fifth year. The first portfolio formation is January 1, 1927 and is held until December 31, 1931. The second portfolio is formed on January 1, 1932 and held until December 31, 1936. This pattern repeats every fifth year. To be clear, this is a non-investable portfolio that would require one to know with 100% certainty the performance of the top 500 stocks over the next 5 years.
Needless to say, the resulting portfolios had incredible returns. But what were the drawdowns of those portfolios over the study period? The worse drawdown came to -76%, and a -76% loss would get anyone fired as a portfolio manager (even God).
The perfect foresight portfolio eats a devastating 76% drawdown (Aug 1929 to May 1932). But the pain doesn’t end there, here is a chart of the drawdowns on the portfolio over time:

If you had perfect foresight, what if you formed a long/short portfolio by buying the top decile winners and shorting the bottom decile losers? Maximum drawdowns was -47%, and that would get you fired as a hedge fund manager.

The point of this exercise is not to show how hard trading is, but to illustrate the point that traders have to enunciate their market edge. In turn, it shows the risks that they are taking. In the case of the perfect foresight portfolio, you are trading off long-term information for short-term volatility.
My inner trader’s philosophy
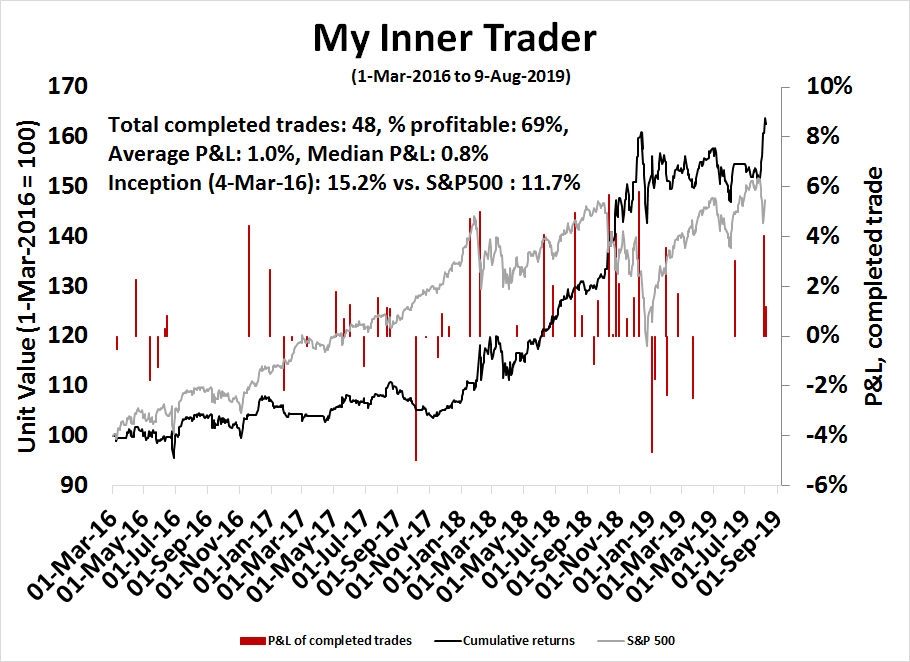
Here is another example. I have written extensively about my trading model under the persona of “my inner trader”. This is his investment philosophy:
You can achieve superior market timing returns using a combination of capitalizing on trend following techniques (see trend following philosophy above), combined with short-term overbought/oversold models to capitalize on sentiment extremes.
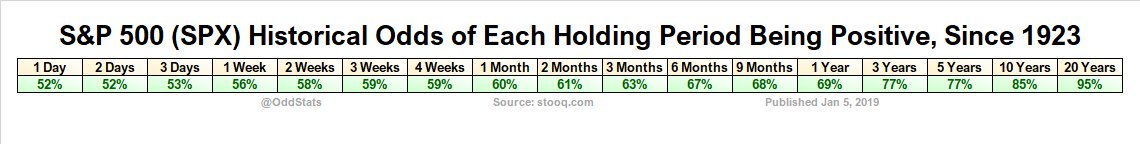
The key phrase in that statement is “market timing”. On average, stock prices rise, and the odds of the market rising increases with time. If you are market timing, and you have no information, the default bet is to be long and accept equity downside risk (see perfect foresight example above).
If you choose to be defensive, either by moving to cash or shorting the market, the odds are stacked against you. The corollary example can be seen in the hypothetical performance of my inner trader’s signals. When the market is going up in a straight line, you don’t need market timing.
You use market timing in order to avoid the really ugly losses that occur in bear markets and corrections. Conceptually, you are buying a long portfolio with a put option. Put options cost money. The only thing skillful market timers can do is to minimize the price of the put.
Investment process
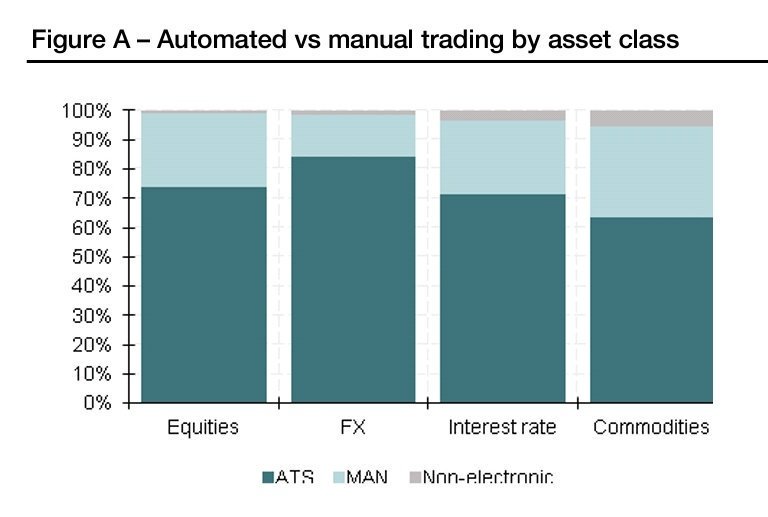
The investment process is the way you implement your investment philosophy. Recent analysis by SocGen shows that a substantial proportion of trading is automated. If you can outline your investment philosophy, then you should be able to automate the process.
Another implementation issue to think about is trade timing. The folks at Resolve Asset Management studied the dispersion of returns using the same investment discipline of portfolio construction using different rebalancing frequencies:
The goal of this article is to illustrate how seemingly inconsequential changes to the trading mechanics of a strategy, which have little impact on the long-term expected performance, can have a material impact on results in the short-term.
To explore this concept we will examine the results of simulations based on the exact same underlying strategy, with exactly the same universe of investments, but where a change is made to just one minor variable. Specifically, we will see how small differences in rebalance frequency can have negligible impact on long-term results, but can lead to performance differences of 10 percentage points or more over one year observation horizons.
The results were astounding. By varying rebalancing frequency between 1 and 20 days using the exact same investment discipline, the 90% range of rolling 252 day returns varied from 4.2% to 10.9%.

Evaluating my inner trader’s process
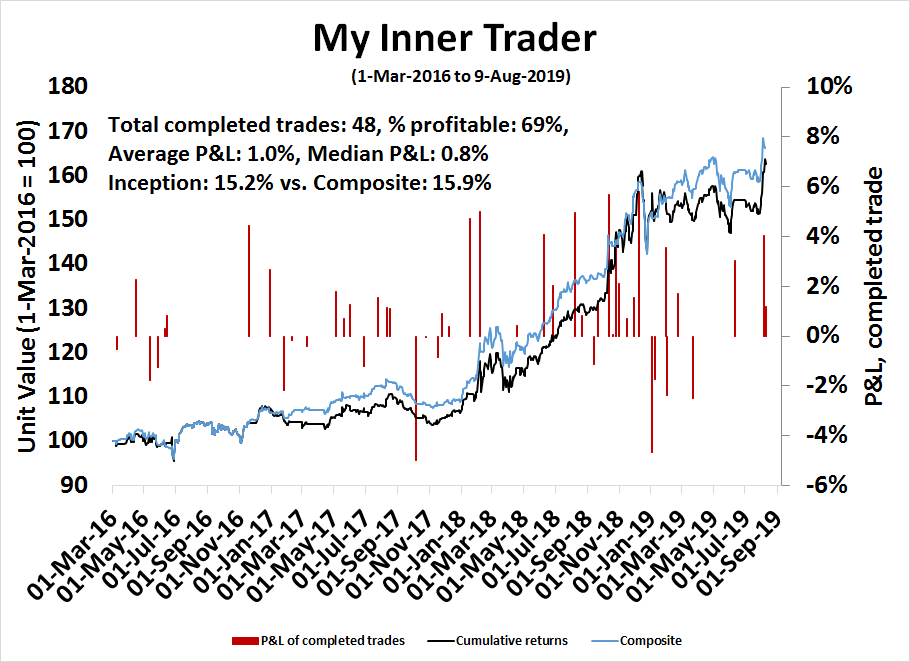
Here is another example. The hypothetical returns of my inner trader’s signals is based on execution at the closing price on the day of the signal. I performed some sensitivity analysis if the trade was done 1, 2, 3, 4, and 5 days later. As it turns out, returns were mostly better, except if I wait an extra day. The most astonishing result is performance is better at t+5, or if the trade is executed five days after the signal.

I also formed a composite portfolio where 20% of the trade is done every day for five days, instead of executing instantly at the time of the signal. Returns are slightly better (blue line) compared to the t=0 base case (black line). The returns from inception for the composite portfolio came in at 15.9%, compared to 15.2% for the current portfolio.
This example shows another component of the investment process, namely model and portfolio diagnostics. The most intense scrutiny of an investment process when returns are subpar, but that is also part of the opportunity to learn about the strengths and weaknesses of the system.
This exercise taught me the time horizon of my trading signals is longer than I think they are.
I recently came upon a saying among traders:
Give a man a trade, he’ll eat for a month.
Teach a man how to trade, he’ll be in the poorhouse in three months.
Make sure you don’t wind up in the poorhouse. Scrutinize your investment philosophy and process, and always be learning.
‘The most astonishing result is performance is better at t+5, or if the trade is executed five days after the signal.’
I agree, both with the result and with the reaction to it. I’ve been using some variation of (ST/LT) market timing since 1989. My wife (an astute observer) once casually commented ‘Why not wait a day or two?’ She was right. Rather than jump in immediately when a pattern emerges, it often pays off to wait at least another day. I’ve never waited as long as t+5, but I’ll start tracking!
After today’s dive, waiting is a good move.
t+1 definitely won the day.
I’ll be watching t+5.
Building a long position on pull backs makes sense, as President is slowly back tracking on trade war, first move being postponing of tariffs to December and President talking sweet nothings about President Xi.
Next pullback may be a crackdown in Hong Kong, that may happen as early as tonight. Monday may see a pull back at open, that may give another entry, if 2820 on S&P holds.
Gold is down 10$ in the futures markets, overnight, bonds are selling off some, all good signs.