Preface: Explaining our market timing models
We maintain several market timing models, each with differing time horizons. The “Ultimate Market Timing Model” is a long-term market timing model based on the research outlined in our post, Building the ultimate market timing model. This model tends to generate only a handful of signals each decade.
The Trend Model is an asset allocation model which applies trend following principles based on the inputs of global stock and commodity price. This model has a shorter time horizon and tends to turn over about 4-6 times a year. In essence, it seeks to answer the question, “Is the trend in the global economy expansion (bullish) or contraction (bearish)?”
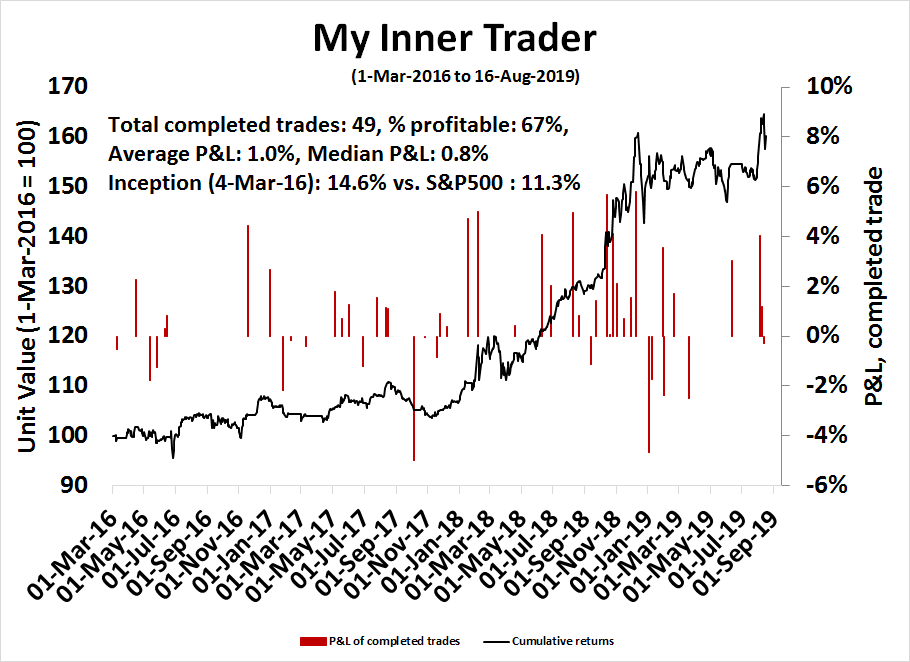
My inner trader uses a trading model, which is a blend of price momentum (is the Trend Model becoming more bullish, or bearish?) and overbought/oversold extremes (don’t buy if the trend is overbought, and vice versa). Subscribers receive real-time alerts of model changes, and a hypothetical trading record of the those email alerts are updated weekly here. The hypothetical trading record of the trading model of the real-time alerts that began in March 2016 is shown below.
The latest signals of each model are as follows:
- Ultimate market timing model: Buy equities
- Trend Model signal: Bearish
- Trading model: Bullish
Update schedule: I generally update model readings on my site on weekends and tweet mid-week observations at @humblestudent. Subscribers receive real-time alerts of trading model changes, and a hypothetical trading record of the those email alerts is shown here.
The remarkable FAANG run
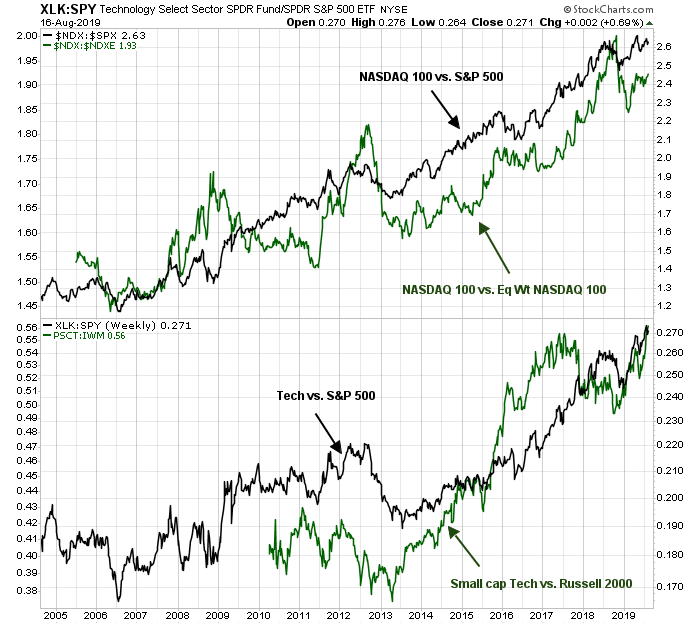
Technology stocks, and FAANG in particular, have had a remarkable run in the last decade. The chart below reveals the level of dominance.
The top panel shows the relative performance of the NASDAQ 100 (NDX) in the last 15 years (blackline). Not only is the NDX dominating the market, the NDX has also been steadily beating the equal-weighted NDX (green line), indicating that large caps within that index have outperformed small caps. The bottom panel also shows the relative performance of large cap technology (black line) and small cap technology (green line) against their respective indices. Both have led the market in the past decade.
As we peer into 2020 and the next decade, numerous signs are appearing that this cycle of technology and FAANG leadership may be coming to an end.
When the turn does come, the likely winners are gold, value stocks, and European equities. As well, you should expect subpar performance from technology and the bond market in the decade ahead.
Paradigm shift ahead
Bridgewater Associates founder Ray Dalio recently penned an essay on investment paradigm shifts. He stated one of his key investing principles as:
Identify the paradigm you’re in, examine if and how it is unsustainable, and visualize how the paradigm shift will transpire when that which is unsustainable stops.
Over my roughly 50 years of being a global macro investor, I have observed there to be relatively long of periods (about 10 years) in which the markets and market relationships operate in a certain way (which I call “paradigms”) that most people adapt to and eventually extrapolate so they become overdone, which leads to shifts to new paradigms in which the markets operate more opposite than similar to how they operated during the prior paradigm. Identifying and tactically navigating these paradigm shifts well (which we try to do via our Pure Alpha moves) and/or structuring one’s portfolio so that one is largely immune to them (which we try to do via our All Weather portfolios) is critical to one’s success as an investor.
The essay is well worth reading in its entirety, but Dalio summarized the current paradigm since 2009 this way:
- Central banks have been lowering interest rates and doing quantitative easing (i.e., printing money and buying financial assets) in ways that are unsustainable.
- There has been a wave of stock buybacks, mergers, acquisitions, and private equity and venture capital investing that has been funded by both cheap money and credit and the enormous amount of cash that was pushed into the system.
- Profit margins grew rapidly due to advances in automation and globalization that reduced the costs of labor.
- Corporate tax cuts made stocks worth more because they give more returns. The most recent cut was a one-off boost to stock prices.
He went on to forecast the next paradigm this way:
I think that it is highly likely that sometime in the next few years, 1) central banks will run out of stimulant to boost the markets and the economy when the economy is weak, and 2) there will be an enormous amount of debt and non-debt liabilities (e.g., pension and healthcare) that will increasingly be coming due and won’t be able to be funded with assets. Said differently, I think that the paradigm that we are in will most likely end when a) real interest rate returns are pushed so low that investors holding the debt won’t want to hold it and will start to move to something they think is better and b) simultaneously, the large need for money to fund liabilities will contribute to the “big squeeze.” At that point, there won’t be enough money to meet the needs for it, so there will have to be some combination of large deficits that are monetized, currency depreciations, and large tax increases, and these circumstances will likely increase the conflicts between the capitalist haves and the socialist have-nots. Most likely, during this time, holders of debt will receive very low or negative nominal and real returns in currencies that are weakening, which will de facto be a wealth tax.
The process that Dalio described is the life and death of a bubble. You first start with a good idea. Early movers capitalize on the idea, which attracts more investors. Returns rise, and eventually go parabolic. More money rushes in, and late investors lever themselves up. The entire scheme becomes unsustainable and the bubble bursts.
Dalio went on to forecast gold is the winner in the next investment paradigm, but there are sufficient signs that a number of investment relationships have become so stretched that they are ripe for reversal.
Watch for leadership reversal
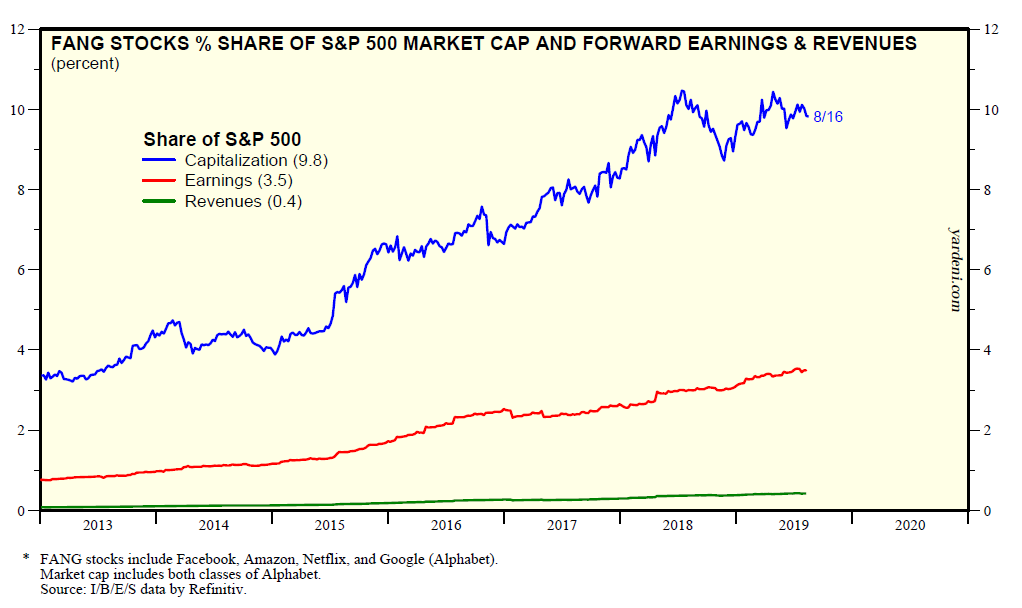
Here are some examples. Yardeni Research documented the rise of FANG stocks as a percent of market cap, sales, and earnings. While FANG accounts to about 10% of index market cap, these stocks represent a far lower proportion of sales and earnings, indicating rising valuation levels.
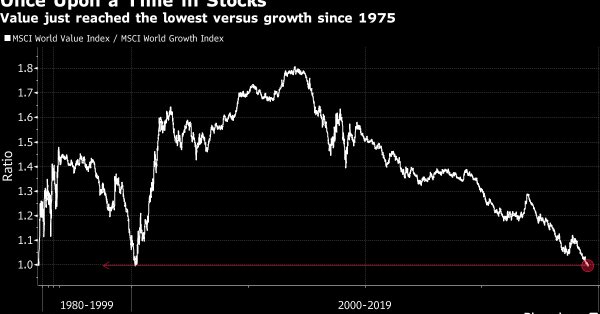
Another sign of an imminent paradigm shift can be found in value stocks, which are becoming extremely stretched by historical standards. The spread between MSCI World Value and Growth reached a low not seen since 1975, which marked the top of the Nifty Fifty era.
A Yahoo Finance article highlighted what JPMorgan’s quantitative strategist Marko Kolanovic called a “once in a decade opportunity” in value stocks:
“Currently, there is a record divergence between value/cyclical stocks on one side, and low volatility/defensive stocks on the other side,” Kolanovic wrote. “The level of divergence is much more significant even when compared to the dot-com bubble valuations of late ’90s.”
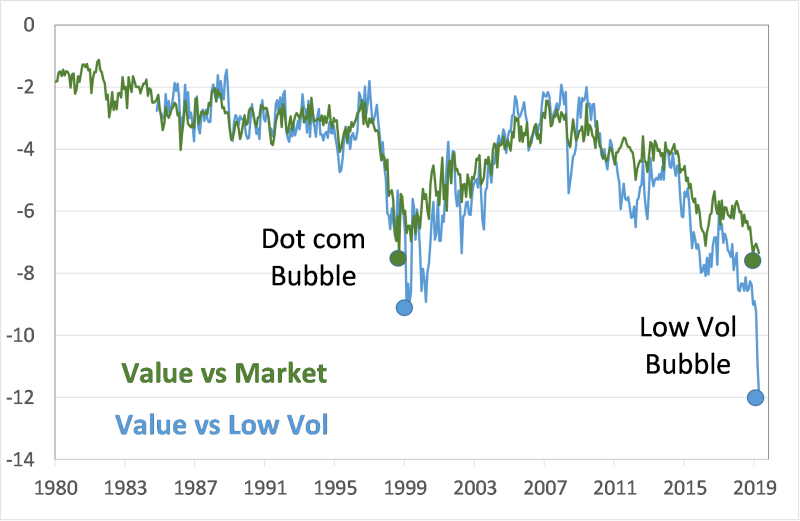
The point is, the gap between value stocks and low volatility stocks is unusually wide, as the chart above shows in terms of forward P/E valuation.
“While there is a secular trend of value becoming cheaper and low volatility stocks becoming more expensive due to secular decline in yields, the nearly vertical move the last few months is not sustainable,” Kolanovic wrote. “The bubble of low volatility stocks vs. value stocks is now more significant than any relative valuation bubble the equity market experienced in modern history.”
A variant of the value vs. growth relationship can also be indirectly seen in the possible relative revival of European stocks (see Europe: An ugly duckling about to be a swan?). The outperformance of US stocks can mainly be attributable of the dominance of the technology sector in the US, while technology stocks are largely absent in European markets.
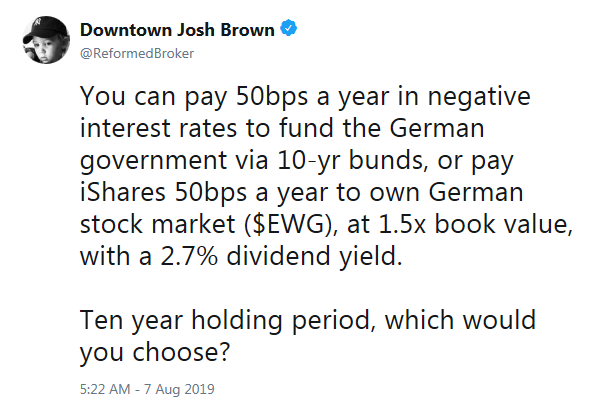
Another stretched relationship can be seen in interest rate trends. The ECB has pushed rates so far down that the entire German, Dutch, and Swiss yield curves are negative. Austria’s 100-year bond is now trading at a yield of under 1%. When something gets too stretched, it reverses. This tweet from Josh Brown summarizes the intersection of low and negative yields, value investing, and European equities.
In his essay, Dalio identified gold as one of the winners in the next decade’s investment paradigm:
Most people now believe the best “risky investments” will continue to be equity and equity-like investments, such as leveraged private equity, leveraged real estate, and venture capital, and this is especially true when central banks are reflating. As a result, the world is leveraged long, holding assets that have low real and nominal expected returns that are also providing historically low returns relative to cash returns (because of the enormous amount of money that has been pumped into the hands of investors by central banks and because of other economic forces that are making companies flush with cash). I think these are unlikely to be good real returning investments and that those that will most likely do best will be those that do well when the value of money is being depreciated and domestic and international conflicts are significant, such as gold. Additionally, for reasons I will explain in the near future, most investors are underweighted in such assets, meaning that if they just wanted to have a better balanced portfolio to reduce risk, they would have more of this sort of asset. For this reason, I believe that it would be both risk-reducing and return-enhancing to consider adding gold to one’s portfolio.
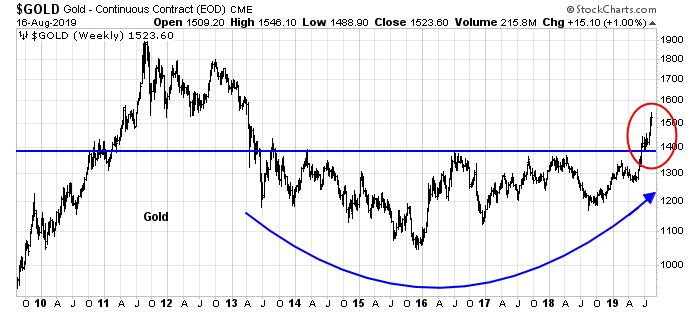
Indeed, we can see that gold formed a multi-year saucer bottom, and recently staged an upside breakout to a recovery high. This is an additional sign of the reversal of a stretched relationship.
Timing the paradigm shift
One of the assumptions underlying Dalio’s analysis is that investment paradigms ends when the old leaders go into a bear market. There is a washout and catharsis, out of which the new paradigm and leadership emerges.
For investors, the task of timing the top of the FAANG and technology bull is a challenge. I have identified a number of catalysts.
First, the regulatory environment is becoming less and less friendly to Big Data technology companies. American regulators are turning their anti-trust scrutiny towards tech. Europeans have led the way with privacy regulations based on the “right to be forgotten” initiatives like GDPR. These initiatives are likely to erode the business moats of many Big Data companies like Facebook, Google, Amazon, and others.
Another catalyst may come in the next recession, whenever that occurs. The ECB experience has shown that there are limits to monetary policy, and fiscal and trade policy will also have to play their part to promote economic growth.
Central bankers are running out of bullets. Pushing interest rates into negative territory has devastated the European banking sector. Joe Wiesenthal at Bloomberg suggested that “negative yields are basically the market’s way of taxing people who oppose fiscal stimulus because they don’t want to be taxed”, and “this probably all ends when rich people find that Elizabeth Warren-style 2% wealth taxes offer a better return than holding money in a bank.”
I had suggested that Europe might change when the German Greens gain greater power and push through some of their green spending proposals. This will promote growth as Germany is one of the countries in the eurozone with the fiscal room to stimulate the economy (see Europe: An ugly duckling about to be a swan?).
In the US, investors will likely have to wait until after the 2020 election. Both President Trump and the Democrats are effectively supporters of the Modern Monetary Theory (MMT), which states that a sovereign country that issues debt in its own currency cannot go bankrupt. Its debt capacity is only limited by the willingness of lenders to buy its debt. This allows greater fiscal flexibility for the government to stimulate growth. Trump would like call for more tax cuts, and a Democrat would try to pass safety net style legislation such as student debt forgiveness, Medicare for All, and green initiatives. The debate will not be over whether fiscal stimulus is necessary, but over fiscal priorities.
When the turn does come, the likely winners are gold, value stocks, and European equities. As well, you should expect subpar performance from technology and the bond market in the decade ahead.
The week ahead
How can investors and traders make sense of the volatility as we look ahead to next week and beyond? I am grateful to my former Merrill Lynch colleague Fred Meissner for the following analytical framework of separating the shorter term (daily chart) and longer term (weekly) chart perspectives.
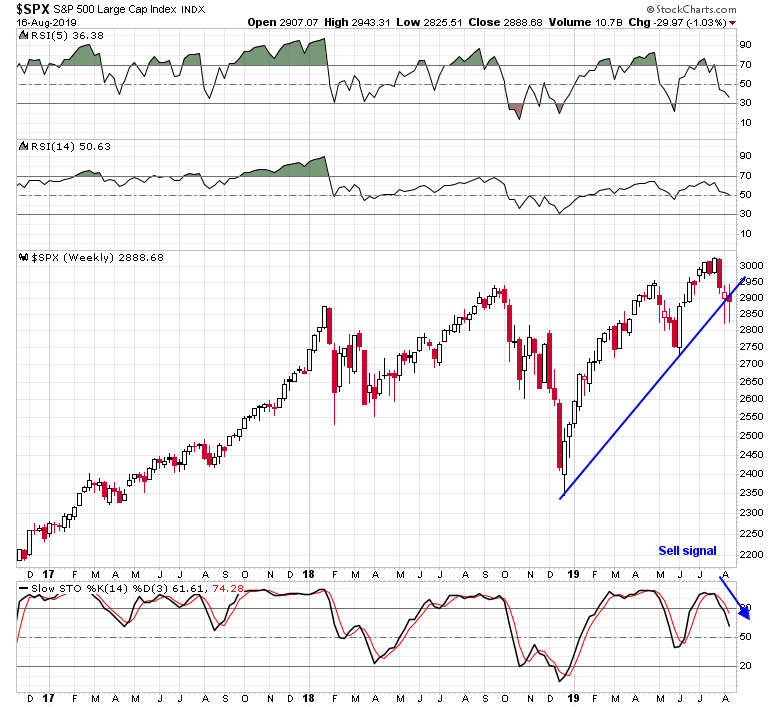
In the short run, the market tested support at about 2845 while displaying positive RSI divergences. It was also oversold on the stochastic, and the subsequent bounce was not surprising. A likely price recovery lies ahead, and overhead resistance at 2950 is a reasonable first rally objective.

The longer term perspective on the weekly chart does not look as rosy. The index has violated a key uptrend indicating technical damage, and the weekly stochastic has rolled over from an overbought reading and it is flashing a sell signal. This kind of market structure calls for a relief rally within a trading range.
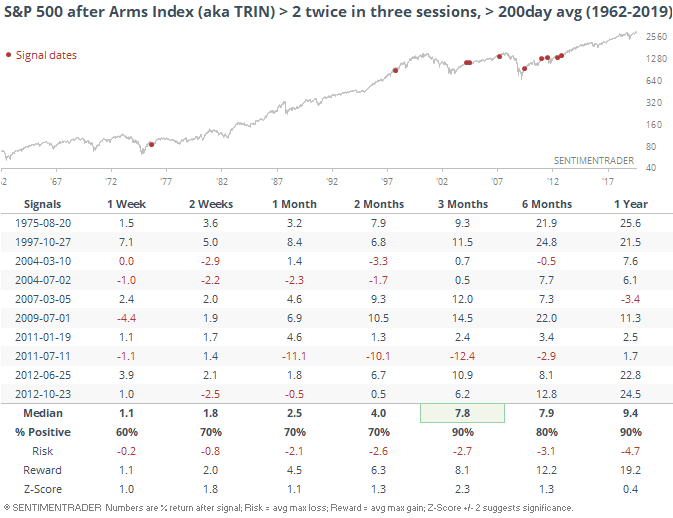
There were plenty of signs that the market was ripe for a bounce. The TRIN Index spiked above 2 twice last week, and a reading of 2 or more can be interpreted as a sign of capitulation. SentimenTrader documented what happened after such episodes when the index is above its 200 dma. Three-month returns are almost universally positive.
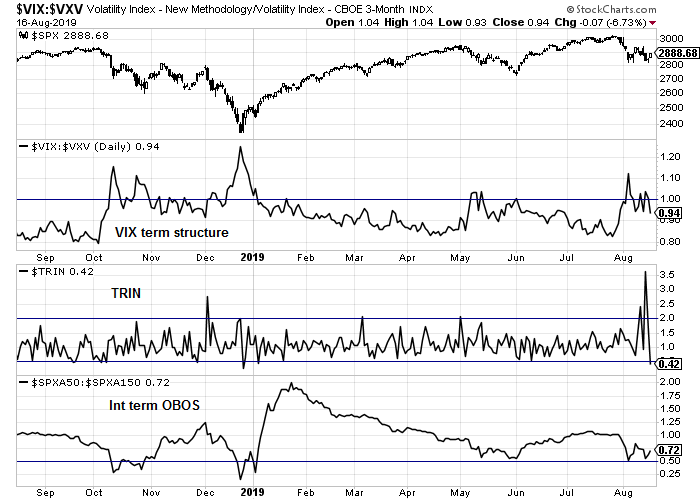
My own Trifecta Spotting Model had flashed an exacta buy signal last week. As a reminder, the Trifecta Model is based on three uncorrelated short-term factors for finding market bottoms:
- VIX term structure: An inverted term structure indicates fear in the option market.
- TRIN: A TRIN reading of above 2 can be an indication of price-insensitive selling, or a “margin clerk” market. This kind of selling can flush out the weak holders in a falling market and build conditions for an advance.
- Intermediate term overbought/oversold model: The ratio of stocks above their 50 dma to stocks above their 150 dma is a momentum indicator, and a reading below 0.50 can be interpreted as an oversold extreme.
The Trifecta Model flashed an exacta buy signal last week when the first two conditions were triggered, but not the third. While oversold markets can become more oversold, exacta and trifecta signals have been usually followed by relief rallies.
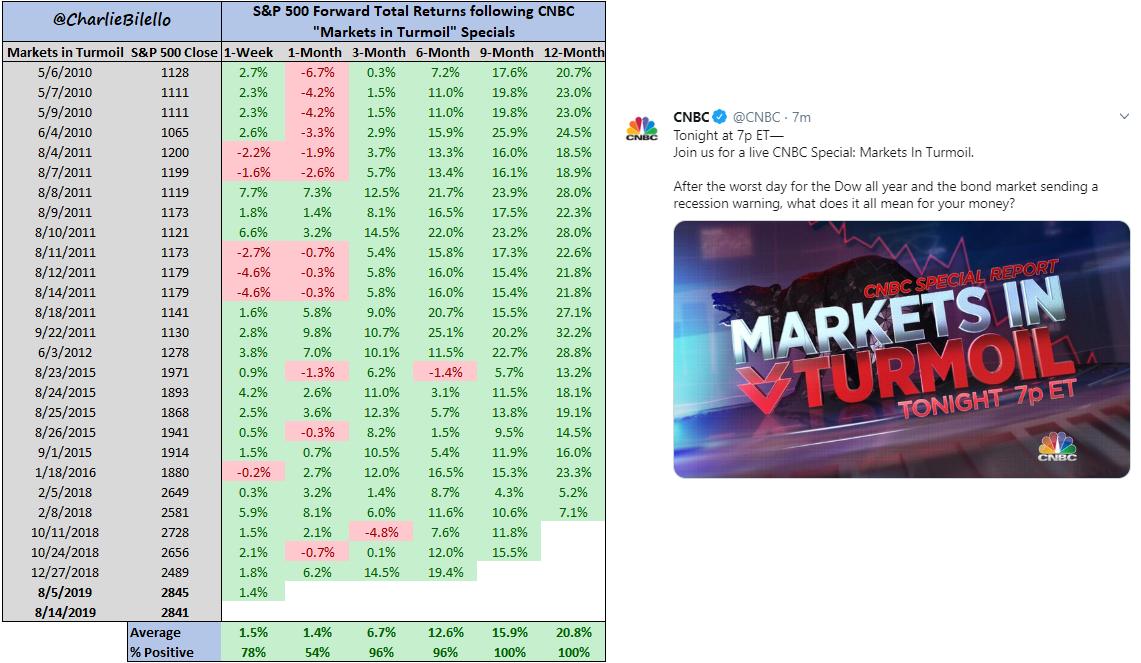
Lastly, CNBC did a “Markets in Turmoil” program last Wednesday at the bottom of the sell-off. The market has historically performed well after such programs.
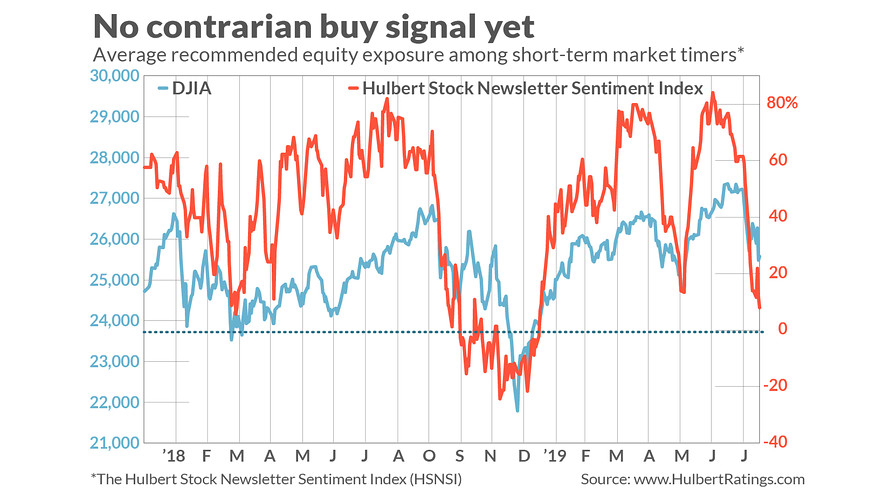
On the other hand, Mark Hulbert believes that while sentiment is bearish, it is not bearish enough for a durable bottom.
Consider the average recommended equity exposure among the several dozen short-term stock market timers I monitor on a regular basis (as measured by the Hulbert Stock Newsletter Sentiment Index, or HSNSI). This average currently stands at 7.9%.
Though that average is a lot lower than the 84.2% reading that prevailed in early July, it is still markedly higher than the readings below minus 20% that accompanied the market’s late-December lows. (See below chart.)
Similar sentiment conditions can be found in the NAAIM Exposure Index. Historically, this index has provided a useful buy signal when it has fallen below its lower Bollinger Band. The index neared, but did not fall below its lower BB in the last two weeks.

In short, the bulls are not out of the woods. Considerable risk loom ahead. The UK lurching towards a disorderly no-deal Brexit, which would tank the British economy and also sideswipe the rest of Europe. The developments in Hong Kong represent a geopolitical wildcard, which could spook the markets. The USD is strengthening again, and a rising greenback raises the odds of a Trump-induced currency war, and puts pressure on fragile EM economies with high external debt levels.

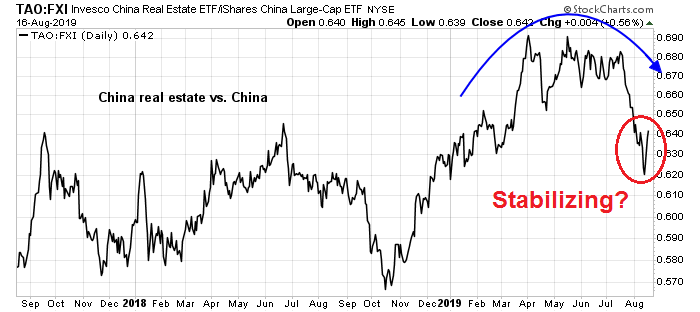
One sector with rising USD debt are the Chinese property developers, and they are especially vulnerable in light of their highly leveraged balance sheets. I am particularly concerned about the price action of China Evergrande (3333.HK), which is one of China’s largest property developers. The stock tanked on an unexpected loss when it reported earnings and violated an important long-term support level. It is unclear whether the breach is specific to the company, or signs of a larger systemic problem in China’s highly leveraged real estate sector.

So far, the stock charts of the other Chinese developers that I monitor are holding up well, and the sector is showing some early signs of relative strength.
Is the relative strength turnaround genuine, or just a dead cat bounce? The jury is out on that question. The chart of the broker-dealers in 2008 reveals few clues. The performance of the industry group shows little systemic anxiety at the time of the Bear Stearns and Lehman bankruptcies.

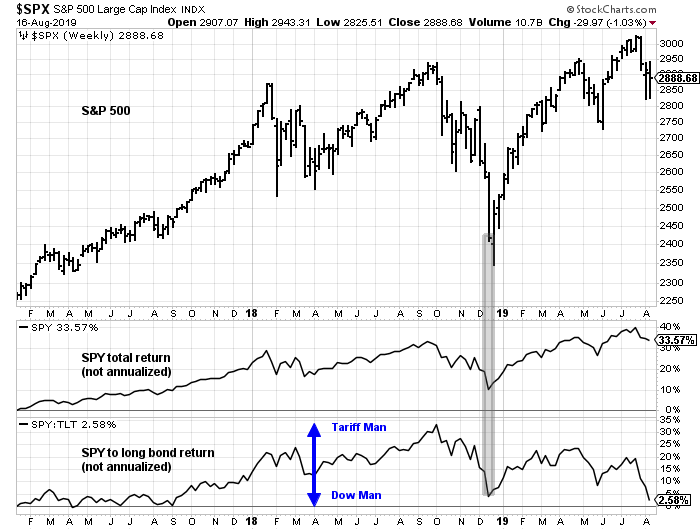
The relief rally within the context of a range-bound market also makes sense from a political perspective. President Trump styles himself as “Tariff Man”, but he also has a different persona of “Dow Man” who measures the success of his administration by the stock market. Investors reached the point last week when they were almost better off owning the long Treasury bond than stocks since Trump’s inauguration (bottom panel). At the bottom of the relative performance range, Dow Man becomes the dominant personality and he will endeavor to support stock prices. Near the top of the range, Tariff Man feels that he has a sufficient financial cushion to act tough in the trade war with China. While Dow Man has the upper hand today, watch for Tariff Man to take over again as stock prices recover.
My inner investor is cautiously positioned and targeting an underweight position in stocks. My inner trader began buying the market last week, and he is accumulating a long position on weakness based on the results of recent research (see Audit your trading the way the pros do it).
Disclosure: Long SPXL
I ran across an interesting analysis by Damon Race of Kaliber Capital. It suggests, if past is prologue, that the current correction may already be over. https://twitter.com/kalibercap/status/1162084309567754241
I believe QUALITY should be added to VALUE – GROWTH – LOW VOLATILITY, in the new paradigm.
The new paradigm will have companies that have borrowed too much in today’s easy credit environment paying the piper. Those are value stocks. These value stocks are often old companies with huge worker pension overhangs that will be onerous. They could be cheap now because they are losing out in the digital world and will continue to lose. Think Macy’s and General Electric this week.
But QUALITY is a group that has value characteristics but is strong business and balance sheet-wise to weather any storm. Companies here have growth in sales and earnings but importantly growing dividends that are attractive in a low interest rate world.
Here are some charts to show the dynamics.
First a chart of the 2015-2016 bear market. Note Quality did as well as Low Vol as both outperformed Value (Big Loser) and Growth.
https://tmsnrt.rs/2Hdn5eS
Next, the bull market from Feb 11, 2016 to now. Note Value did great coming out of the bear market but has underperformed since. This is common since value stocks get crushed too much during a bear and then roar back when a new cycle starts.
https://tmsnrt.rs/2ZdaChJ
Lastly, here is a chart since the low December 24, 2018. Note how value burst up and led briefly from the low. Value got crushed in the fourth quarter and this action is a recovery of that overly negative period. But the outperformance quickly fades. Quality and Low Vol are the two groups the hit higher highs in 2019, together with Quality outperforming during risk-on periods.
https://tmsnrt.rs/2KVCYI0
Agreed. Quality makes sense. Quite a few of these co’s also have good buy-back programs. In the low growth future buy-backs will help a lot. We should also pay attention to those companies whose biz are aligned with secular trends, notably co’s in ETFs IHI, XHE, and ARKG..
Hello Ken, I’m wondering which ETFs you are using for Pure Growth, Pure Value, Low Volatility, and Quality. Your momentum spreadsheet includes SPLV (Low Volatility), RPG (Pure Growth), IWD (Russell 1000 Value). Are these the ones that you show on the graph? And how about Quality? Very interesting perspectives, many thanks.
It is SPHQ for Quality (Invesco). Pure Value and Pure Growth are the S&P 1500 Pure Value and Growth indexes not ETFs. The 1500 index includes the 500 big cap, 400 midcap and 600 small cap. Invesco has a Pure Value ETF for the S&P 500 RPV. iShares has a S&P 500 Growth, IVW
Thanks Ken. What kind of high quality value ETFs/MFs do you see as worth buying?
I wonder in the Yardani Research chart if the earning is the earning per share. The divergence between company capitalization and earning could be accounted by share buybacks, which has been an important factors in share price appreciations in recent years. The share buybacks reduced the number of outstanding shares, thus increases earning per share, but not actual earning. So the distinction is crucial.
I can’t speak directly for YRI, but the standard methodology for calculating aggregate ratios is total earnings or sales, not per share.
Cam
I would like to take a minute and thank you for your timely advice. From what I read here, it is time to cut exposure in the past 12 months and coming 12 months to elections, and buy value/quality, gold and Europe, which have been laggard assets, over the past decade.
Thanks.
Cam
Wouldn’t bonds perform well under the scenario?