Mid-week market update: I am writing my mid-week update a day early because of the extraordinary volatility in the stock market.
My wife and I took a few days to go on a Danube river cruise. As we arrived in Vienna, we spied a white swan swimming beside our ship. The white swan seems to be an apt metaphor for today’s market, which is a market of known risks.

A short-term bottom ahead
The stock market has certainly been volatile. Last Wednesday, I suggested that the market was ready to bounce (see Ripe for a counter-trend rally). The market has duly rallied, and stalled out late last week, when I issued a trading sell signal. That sell signal just got negated by a looming buy signal today as the trading model just flipped bullish.
Urban Carmel pointed out that the 20 day moving average of TRIN has spike to levels consistent with past trading bottoms. While this indicator does not peak on the exact day of the bottom, current readings show that we are close.

In addition, my Trifecta Bottom Spotting Model, which has had an uncanny accuracy, flashed an exacta buy signal. As Stockcharts has not updated the data for the intermediate-term overbought/oversold model (bottom panel), we may have already triggered a full trifecta buy signal.

The latest BAML Global Fund Manager Survey shows that anxiety has reached new highs, as measured by the breadth of hedging activity.

While the market will likely trace out a short-term bottom this week, my base case scenario calls for a range-bound choppiness in the weeks ahead. Here is why I think stock prices will not immediately recover to test the old highs and make new ones.
USD headwinds ahead
The USD Index recently staged an upside breakout out of an inverse head and shoulders pattern, but it weakened back to test neckline support. USD strength had been one key driver of CNY weakness, which has been causing untold consternation in the markets.

Guess what, USD strength is about come back, and that`s not good for the pricing of risk assets, like stocks.
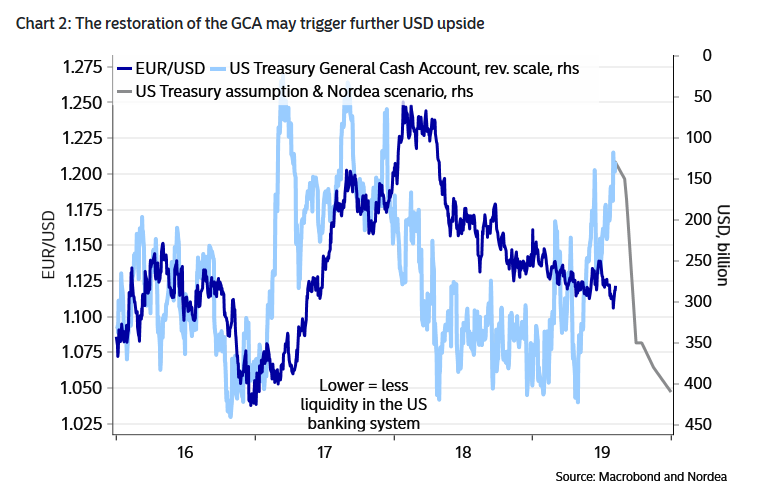
Recent research from Nordea Markets highlighted the effects of the debt ceiling deal on USD liquidity. To make a long story short, raising the debt ceiling allows Treasury to borrow, which drains dollar liquidity from the banking and financial system.
Falling dollar liquidity can cause havoc in the global financial system. The most exposed are EM countries with USD debt. From a systemic risk viewpoint, the most exposed part of the global market that could cause a “black swan” event are the Chinese property developers. These companies have been financing in USD, as Beijing’s deleveraging program pushed up domestic funding costs. Equally serious is the statement from official media China Daily that Beijing will rely on fiscal stimulus, instead of monetary stimulus to stabilize growth. In effect, the highly levered development sector can kiss any hope of preemptive rescue from the PBOC. As the chart below shows, the relative returns of Chinese real estate developers is rolling over. While conditions are not at crisis levels, the risk of a series of confidence shaking defaults is rising.

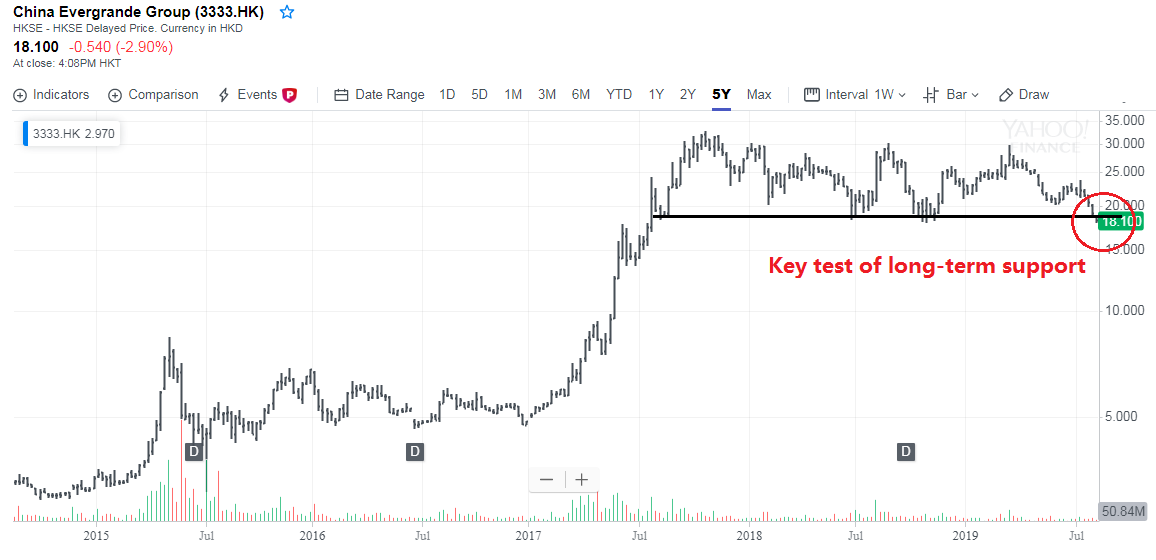
China Evergrande (3333.HK) is one of China`s largest property developers. The stock weakened last week because of poor earnings report, and it is testing a long-term support level. A breach of support could be represent a spike in systemic risk. I don’t want to sound Apocalyptic and Zero Hedge here, but China Evergrande, along with other developers, have significant levels of offshore USD debt, and a disorderly retreat in its stock price could be a warning of a Bear Stearns/Lehman 2.0 event. Fortunately, the stock price of the other developers are holding well above their respective long-term support, but this is something to keep an eye on.
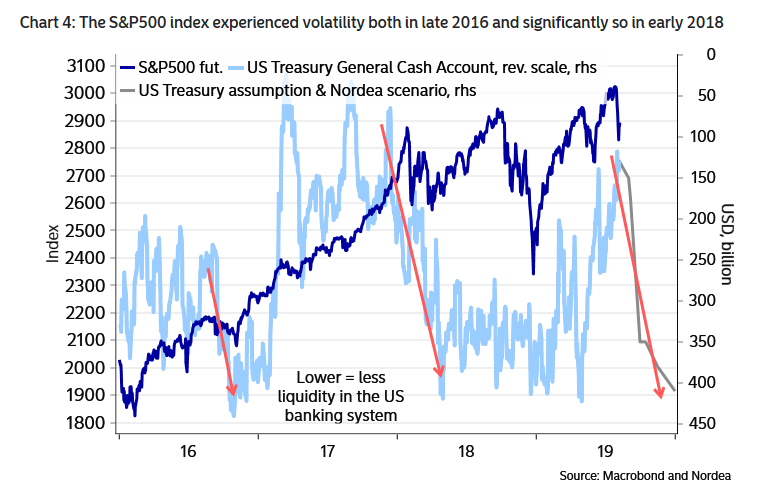
The overall effect of diminished dollar liquidity puts pressure on risk appetite, as proxied by the SPX. The last few episodes of falling dollar liquidity saw stock prices decline. I don’t mean to get all Zero Hedge bearish, but falling USD liquidity from increased Treasury borrowing poses a risk to stock prices over the coming weeks and months.
The USD is enjoying bullish tailwinds from Trump’s policies. The Economist pointed out that Trump cannot have rising tariffs, a strong economy, and a weak currency all at the same time.
Mr Trump wants a booming economy, protected by tariffs and boosted by a cheap dollar, and when he doesn’t get them he lashes out. But economic reality makes these three objectives hard to reconcile. Tariffs hurt foreign exporters and dampen growth beyond America’s borders; weaker growth in turn leads to weaker currencies, as business becomes cautious and central banks ease policy in response. The effect is particularly pronounced when America is growing faster than other rich countries, as it has recently. The dollar’s enduring strength is a result, in part, of Mr Trump’s policies, not of a global conspiracy.
The markets need to adjust to that new reality:
Faced with the uncertainty created by a vicious superpower brawl, firms in America and elsewhere are cutting investment, hurting growth further. Lower interest rates are making Europe’s rickety banks even more fragile. China could face a destabilising flood of money trying to leave its borders, as happened in 2015. And further escalation is possible as both sides reach for economic weapons that were considered unthinkable a few years ago. America could intervene to weaken the dollar, undermining its reputation for unfettered capital markets. China or America could impose sanctions on more of each other’s multinational firms, in the same way that America has blacklisted Huawei, or suspend the licences of banks that operate in both countries, causing havoc.
The short and intermediate term outlook
In short, market reaction to news from Hong Kong, Argentina, and the relief from the delay of certain tariffs are mainly known white swan events. We seemed to have passed a peak bad news moment for market sentiment. Technical and sentiment indicators are nearing washout levels that warrant a market bottom this week.
Trump`s decision to delay the implementation of selected tariffs was not a big surprise. Tariff Man had huffed and puffed ahead of the election in 2020, but investors were nearing a point where they were better off in owning the long Treasury bond than the stock market. Dow Man had to swing into action, but we will undoubtedly see backtracking and Tariff Man become more prominent again once the markets have calmed down.

However, longer term sentiment has not been fully washed out. The Fear and Greed Index has not fallen into the sub-20 zone when durable bottoms have been made in the past.

In addition, the problems of USD strength from the budget agreement creates longer term sustainable headwind for stock prices. As well, the threat of a disorderly unwind of Chinese real estate developer debt, and a no-deal Brexit are longer term challenges for risk appetite. This combination of factors suggests that while the stock market is likely to trace out a short-term bottom, it will resolve itself in further range-bound choppiness in the manner of 2011.
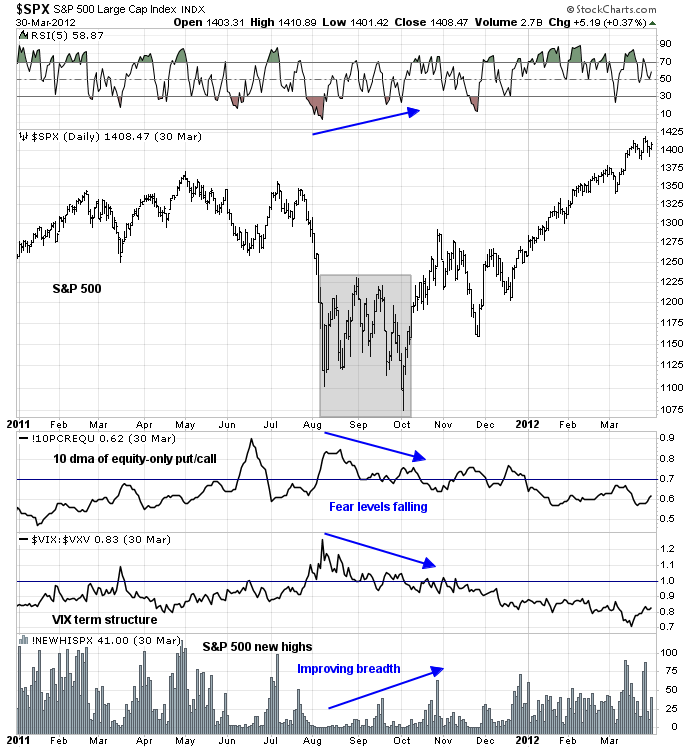
Here are the latest readings for the current market. Assuming that the market does start a short-term rally this week, we have yet to see similar patterns of fading risk assessment and improving breadth that marks a durable market bottom.

My inner investor is preparing to sell into the rally and target a slightly underweight in equities. My inner trader has flipped from short to long, and the trading model is now bullish.
Disclosure: Long SPXL
What’s your take on EM here, Cam?
$USD strength +/- the negative two-month ‘outlook’ from SentimenTrader aside, is it possible the sector bottomed this morning?
The early minutes of trading in EEM retested the August 5 lows. The subsequent rally on high volume tells me at least a few institutions find valuations compelling.
RYWVX (Rydex 2x EM) closed the 1030 window up +3.7%. I expected much lower prices @ the 1545 window – somewhat surprising that it barely budged at +3.49%. That’s real momentum. EEM/ VWO/ iEMG all printed outside days on >average volume.
I reopened VEMAX (Vanguard EM) at the close, which ended the day up a more sedate +0.48%. Not worried about it…yet.
Red sky.
Another retest underway.
I noted the positive divergence tweet, but of course we all have our own trading styles. In my opinion, it was a failed retest and I closed VEMAX end of day. Will revisit the trade as soon as tomorrow if conditions change.
Cam, has anything changed due to today’s price action, or is the trading model still bullist?
This is just my opinion, but If we see another CNBC broadcast tonight (note that odds improve with two programs in close proximity):
https://twitter.com/sentimentrader/status/1158474025351503872
And combine with that with a signal that may have been early but is accurate 7 out of 8 times:
https://stockcharts.com/h-sc/ui
Then I would say the trading model is even more bullish today.
Still bullish. Added to my long position
I decided to get with the plan and opened RYSPX (Rydex S&P500) @ the 1030 est trading window. Don’t bet against Cam!
Added a few China positions in the premarket session. With ~50% of the trading account invested, now 90% invested.
Do I regret having exited Wednesday? Yes and no.
(a) The odds of a gap-down open the following day may not have been high – but neither were they insignificant. I was able to sidestep the majority of two brutal declines in 2018 (late January + October->December) by exiting immediately on similar selloffs that led to continued declines.
(b) That said, sure – I’m not thrilled to be buying back in at premiums to my exits.
(c) However, I was able to mitigate the discomfort by switching from emerging markets to the SPX on Thursday. There were three advantages to making the switch: [i] I’m now invested in a safer sector, [ii] the SPX declined -2.91% on Wednesday, whereas I took only a -2.09% hit on VEMAX, and [iii] I was able to buy back in to RYSPX at a very small premium (~0.3%). I was able to trade in a Bimmer for a safer Lexus which suddenly became affordable!