Preface: Explaining our market timing models
We maintain several market timing models, each with differing time horizons. The “Ultimate Market Timing Model” is a long-term market timing model based on the research outlined in our post, Building the ultimate market timing model. This model tends to generate only a handful of signals each decade.
The Trend Model is an asset allocation model which applies trend following principles based on the inputs of global stock and commodity price. This model has a shorter time horizon and tends to turn over about 4-6 times a year. In essence, it seeks to answer the question, “Is the trend in the global economy expansion (bullish) or contraction (bearish)?”
My inner trader uses a trading model, which is a blend of price momentum (is the Trend Model becoming more bullish, or bearish?) and overbought/oversold extremes (don’t buy if the trend is overbought, and vice versa). Subscribers receive real-time alerts of model changes, and a hypothetical trading record of the those email alerts are updated weekly here. The hypothetical trading record of the trading model of the real-time alerts that began in March 2016 is shown below.

The latest signals of each model are as follows:
- Ultimate market timing model: Buy equities
- Trend Model signal: Bearish (downgrade)
- Trading model: Bearish
Update schedule: I generally update model readings on my site on weekends and tweet mid-week observations at @humblestudent. Subscribers receive real-time alerts of trading model changes, and a hypothetical trading record of the those email alerts is shown here.
Welcome to the Q3 tantrum
The stock market has enjoyed a terrific run in the first six months of 2019. Welcome to Q3, as the challenges become more evident. The Sino-American trade war is flaring up again and threatens to escalate into a currency war. While the Fed has turned dovish, it is becoming apparent that rate cuts are no panacea to the problem of slowing growth and a loss of business confidence.
For investors, the question of the day is, “Is this an ordinary correction, or the start of a recession and bear market?”
The answer lies in deciding how much the trade war matters to the US economy. My analysis concludes that the latest market tantrum is just a hiccup. In the absence of catastrophic events that cause the permanent loss of capital, like a major war or rebellion, history has shown that stock prices rise. Low double-digit drawdowns is just part of the bargain in taking on equity risk.
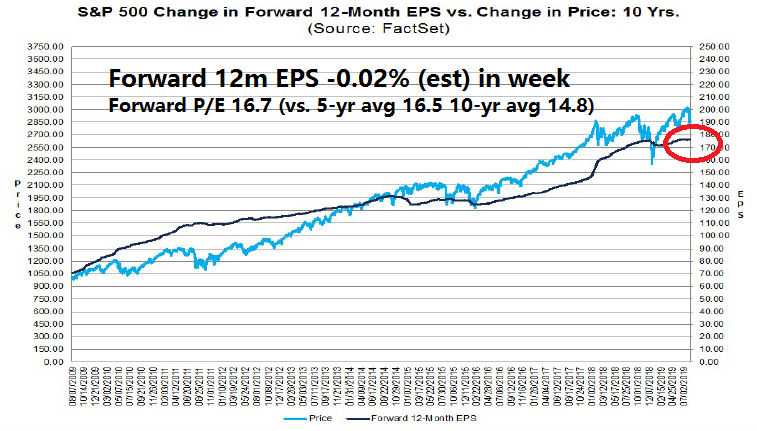
The market recently peaked at a forward P/E ratio of 17.1. Our analysis calls for a bottom at a forward P/E ratio of between 14.7 and 16.4, with an average of 15.5. The current forward P/E ratio is 16.7. A correction represents a valuation reset that is likely to be a buying opportunity.
Expect greater volatility in August and September. Undoubtedly there will be threats and escalations. An additional 10% tariff will be imposed on Chinese imports on September 1. Expect it to eventually rise to 25% as Beijing will probably stand firm. Moreover, the fear of a disorderly no-deal Brexit will be an overhang to Europe’s growth outlook and temper risk appetite. This period of uncertainty is likely prove to be a terrific buying opportunity for investors who can stomach some short-term volatility in anticipation of a better 2020 growth outlook.
Trade War + Currency War?
The US-China trade war is flaring up again. Trump broke the truce by announcing an extra 10% tariff of another $300 billion in Chinese imports. China retaliated by suspending all purchases of US agricultural products, and allowed the CNY to depreciate. The yuan was already overvalued, and the depreciation last week through the USDCNY 7 level was reflective of market forces. Arguably, the problem isn’t a weak yuan, but a strong USD.

Treasury Secretary Mnuchin has designated China a currency manipulator, which is a signal that a currency war may be about to begin.
The Omnibus Trade and Competitiveness Act of 1988 requires the Secretary of the Treasury to analyze the exchange rate policies of other countries. Under Section 3004 of the Act, the Secretary must “consider whether countries manipulate the rate of exchange between their currency and the United States dollar for purposes of preventing effective balance of payments adjustments or gaining unfair competitive advantage in international trade.” Secretary Mnuchin, under the auspices of President Trump, has today determined that China is a Currency Manipulator.
By law, the US has to consult with the IMF, though it is not required to take the IMF’s advice:
As a result of this determination, Secretary Mnuchin will engage with the International Monetary Fund to eliminate the unfair competitive advantage created by China’s latest actions.
The IMF is not likely to give the US much satisfaction. Its July 2019 report gave China a clean bill of health. Most analysis show that China stopped manipulating its currency about five years ago, and any recent intervention has been to keep the yuan stronger than warranted. Even then, the sanctions spelled out in Omnibus Trade and Competitiveness Act of 1988 are not exactly onerous. Undoubtedly, the Chinese are deathly afraid of “expedited negotiations”.
If the Secretary considers that such manipulation is occurring with respect to countries that (1) have material global current account surpluses; and (2) have significant bilateral trade surpluses with the United States, the Secretary of the Treasury shall take action to initiate negotiations with such foreign countries on an expedited basis, in the International Monetary Fund or bilaterally.
In the meantime, other central banks responded with surprise rate cuts. India, Thailand, the Philippines, and New Zealand all unexpectedly cut rates. This may be the start of a stampede that begins a round of competitive devaluation, and global currency war.
My view is investors should not over-react to the prospect of a Chinese devaluation and currency war. The weakness in the yuan was attributable partly to USD strength, and China’s response to rising US tariffs. Citi observed that the devaluation has virtually offset all of the effects of the tariffs.

FT Alphaville highlighted the analysis by well-known China watcher Michael Pettis, who pointed out that a devaluation runs counter to China’s long-term desire to rebalance its economy:
There are three problems with devaluing the currency, however.
First, it works for China by spreading the cost of US tariffs on to all of China’s trading partners, and not just to the US, which may only increase global tensions.
Second, it may raise further concern among wealthy Chinese worried about protecting the value of their wealth and so intensify flight capital.
And finally, a devaluation works by transferring income from net importers, who in China are the household sector, to net exporters and those long dollars, ie the tradable goods sector and the central bank. As the PBoC [People’s Bank of China] has pointed out many times before, in order to reduce its reliance on debt for growth, China needs to do the opposite, ie rebalance income in favour of ordinary households.
Pettis believes Trump’s tariffs and trade war with China has not improved the American trade position either. He pointed to a chart by David Dollar, which shows while the US trade deficit with China fell in H1 2019, the decline was offset by rising trade deficits with other trading partners.

This begs the question: What exactly did the trade war and possible looming currency war accomplish, other than to dent business confidence and slow global growth?
The bear case
Here is the bear case scenario for the next 12-18 months. The trade war is back on. We will see continued escalation, and retaliation. The Sino-American trade war becomes a currency war, which drags other trading partners into the conflict. We have already seen considerable loss of business confidence, which is creating a drag on capex and investment. Here is how Powell expressed concerns about business confidence and global weakness during the latest post FOMC press conference:
[Businesses] don’t come in and say we’re not investing because the federal funds rate is too high. I haven’t heard that from a business. What you hear is that demand is weak for their products. You see manufacturing being weak all over the world. Business investment is weak and I wouldn’t lay all of that at the door of trade talks. I think there’s a global business cycle happening with manufacturing and investment and that’s been definitely a bigger factor than certainly we expected late last year. I think global growth started to slow down in the middle of last year, but that has gone on to a greater extent. And by the way, trade policy uncertainty has also been I think more elevated than we anticipated.
The Eurodollar market is now discounting deeper Fed Funds rates cuts, but lower rates is no panacea. During these periods of panic, earnings matter more than interest rates. The latest update from FactSet shows forward EPS estimate revisions have been flat to down.
The global economy is slowing. The industrial metals to gold ratio, which is a filtered indicator of the global cycle, is in decline. This ratio is highly correlated to the stock/bond ratio, which is a risk appetite indicator. In short, when the global cycle turns down, stocks tend to underperform bonds.

The perception of contagion risk is rising. The relative performance of stock markets of China and her major Asian trading partners to MSCI All-Country World Index (ACWI) is weak, which reflects market concerns that slowing Chinese growth could drag the rest of Asia into a recession.

The bull case
Here is the bull case scenario, which rests on the premise that the US is largely insulated from a global slowdown.
Assuming the American economy sidestep a recession in H2 2019, the US economy revives in 2020.
The driver is low commodity prices from the global slowdown, which results in lower input costs, and consumer strength. The American consumer is on fire. Real retail sales per capita is still rising, and historically it has peaked ahead of recessions.

While the trade war will be an overhang, household balance sheets have been repaired since the last recession. If the consumer wants to spend, there is lots of debt capacity.

Unemployment is low, and wage growth is strong.

In this cycle, it was the corporate sector that has piled on debt, but monetary policy is easy. There are few signs of a credit squeeze that tanks economic growth. Corporate balance sheets are unlikely to break.
What are you so worried about?
How much does the trade war matter?
How can we choose between the bull and bear case scenarios? The answer lies in deciding how much the trade war matters to the US economy.
Jerome Powell stated that he didn’t have a good estimate for the effects of a trade war in the last post FOMC press conference:
You know, the mechanical effects of the tariffs are quite small. They’re not large as it relates to the U.S. economy. The real question is what are the effects on the economy through the confidence channel, business confidence channel. And again, very, very hard to tease that out. I’ve seen some research, which, you know, which says that they are meaningful, meaningful effects on output as to say not trivial. And I think that that sounds right, but it’s quite hard to get—there is no way to get an accurate measure…
A recent Bloomberg study came to a more optimistic conclusion.
We’re more exposed to the global products, services, ideas and people than ever — just in different ways:
- How much stuff we ship around the world is not the best measure of globalization. The trade in goods may be slowing, but that’s an incomplete picture that doesn’t capture the digital realm.
- Traditional trade measures also don’t reflect the real supply chain. A more accurate measure of trade and economic relationships involves not where a product is made but where its value is added.
In other words, measure value-added, not just the value of the trade. The ubiquity of global supply chains creates double counting problems when analysts use the traditional metrics of trade flows.
Traditional trade measures also don’t reflect the real supply chain. A more accurate measure of trade and economic relationships involves not where a product is made but where its value is added.
Companies are more multinational than ever. China hawks in Washington, for instance would welcome “decoupling” of the U.S. and Chinese economies. But with such large markets abroad, few in business see that as a realistic prospect.
Trump’s tariffs are the exception, not the rule. As he erects trade barriers, most of the U.S.’s main trading partners are continuing to lower import duties and sign deals.
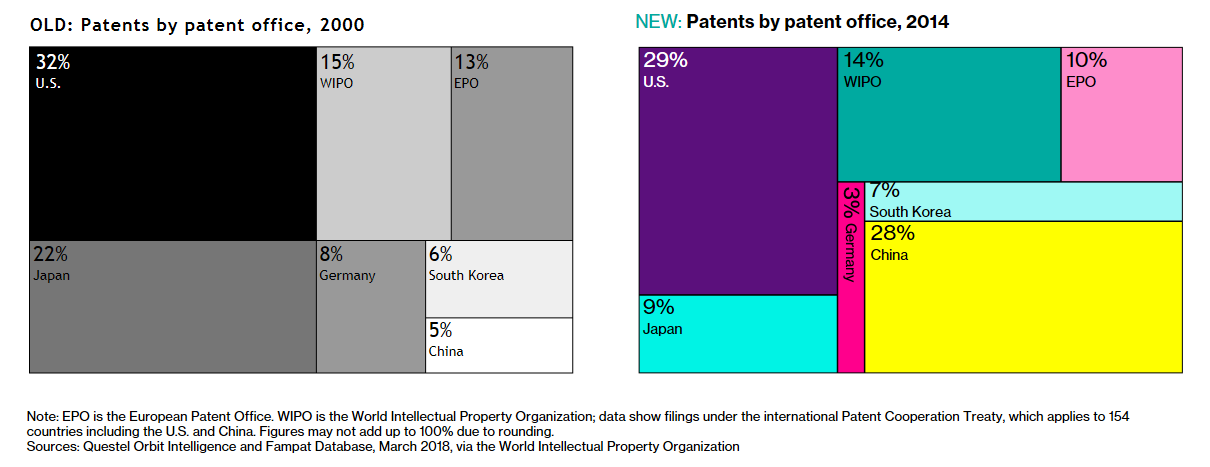
Innovation is increasingly global. At the center of U.S. complaints about China is intellectual property and what the U.S. argues is a long and systematic pattern of IP theft encouraged by the Chinese state. But increasingly experts say the incentives are changing for China.
In other words, Trump’s tariffs will not kill globalization. Sooner or later, the market will come to that realization.
Peterson Institute 2016 trade war study
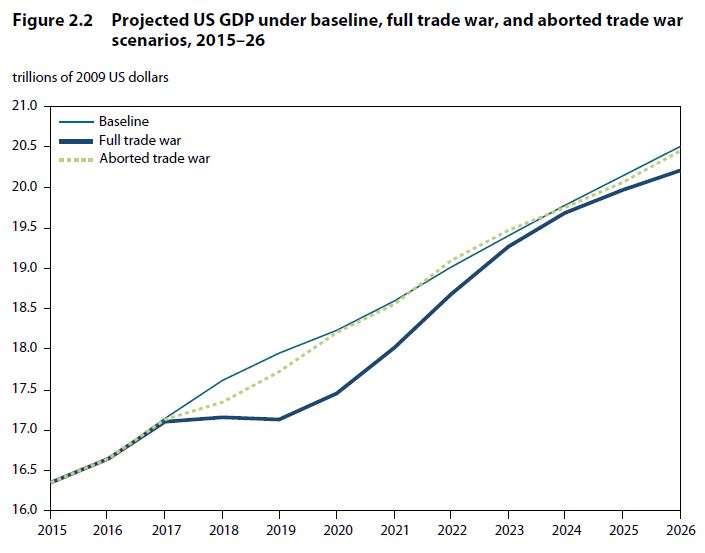
For a second opinion, I dusted off a Peterson Institute study written in September 2016. The study projected the possible effects of a trade war. It modeled three trade war scenarios based on the assumption that a war would begin as soon as Trump took office in early 2017:
- In the full trade war scenario, the United States imposes a 45-percent tariff on nonoil imports from China and a 35-percent tariff on nonoil imports from Mexico. China and Mexico respond symmetrically, imposing the same tariffs on U.S. exports.
- In the asymmetric trade war scenario, China and Mexico do not retaliate symmetrically with an across-the-board tariff. China retaliates on specific U.S. goods and services. With the dissolution of NAFTA, Mexican tariffs on all U.S. goods would snap back to their MFN levels, which currently average about 8 percent. The modeling in this scenario is not contingent on the Moody’s macro model or the imposition by the United States of across-the-board tariffs of a specific level on China and Mexico.
- In the aborted trade war scenario, U.S. tariffs are imposed for only a single year, because China and Mexico concede to U.S. demands, the U.S. Congress overturns the action, or President Trump loses in the courts, or the public outcry is such that the administration is forced to stand down.
The effects on economic growth are shown in the following chart. In a full trade war, GDP growth would flatten out for two years and the economy would enter a mild recession. The aborted trade war, on the other hand, would see growth slow, but the economy would be able to avoid recession.
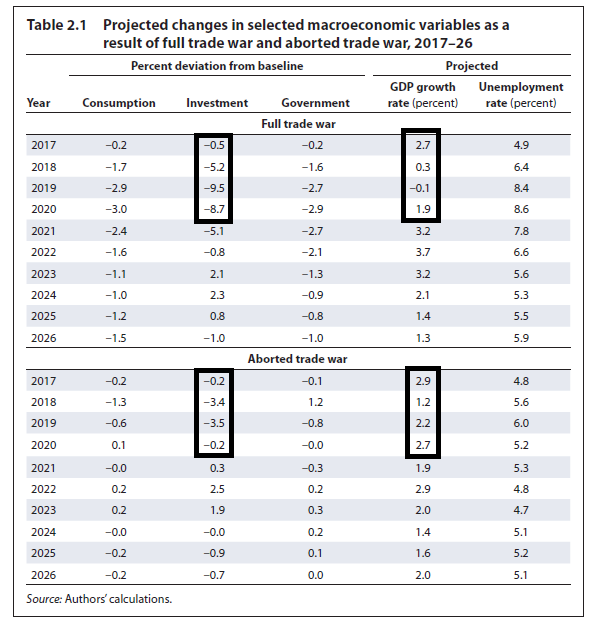
The following table summarizes the model results. In particular, we focus on GDP growth, and the difficult to model effects on business investment. In the worst case (full-blown trade war) scenario, investment spending skids badly and bottoms out at -9.5%, and the economy undergoes a mild recession. In the more optimistic (aborted trade war) scenario, business investment falls -3.5% for two years, but the economy avoids recession.
Here is the report card on the Peterson forecasts. The latest durable goods report shows that new orders fell -1.9% year/year in June, and that was an improvement from a -3.8% rate in May. Since Trump has not seen fit to impose a 45% tariff on Chinese imports, and there are no new tariffs on Mexico, the trade war of 2019 lies somewhere between the full blown war and the aborted war scenarios modeled by the Petersen Institute. The behavior of durable goods orders bears out that assessment.

Based on the results of these two studies, I conclude that the trend of decline in business investment is not weak enough to push the US economy into recession, especially in light of a robust consumer and a Federal Reserve that stands ready to act.
Just a hiccup
Viewed in this context, the latest market tantrum is just a hiccup. In the absence of catastrophic events that cause the permanent loss of capital, like a major war or rebellion, history has shown that stock prices rise. Low double-digit drawdowns is just part of the bargain in taking on equity risk.

When I put the bull case scenario with the Petersen Institute study and Bloomberg’s analysis of global trade patterns, my base case calls for a H2 growth slowdown, with a rebound in 2020 into the 1-2% region. The growth scare would shake out the stock market, and provide a base for revival later this year.
Last week, I made a number of downside projections based on the market’s behavior during recent corrective episodes (see Powell’s dilemma, and why it matters). The market fell into the target range and staged a relief rally. My tactical assessment is there is more unfinished business on the downside, but if history is any guide, this should be just a run-of-the-mill correction.

The market recently peaked at a forward P/E ratio of 17.1. My analysis calls for a bottom at a forward P/E ratio of between 14.7 and 16.4, with an average of 15.5. The current forward P/E ratio is 16.4. A correction is likely to be a valuation reset that is likely to be a buying opportunity.

Expect greater volatility in August and September. Undoubtedly there will be threats and escalations. An additional 10% tariff will be imposed on Chinese imports on September 1. Expect it to eventually rise to 25% as Beijing will probably stand firm. Moreover, the fear of a disorderly no-deal Brexit will be an overhang to Europe’s growth outlook and temper risk appetite. This period of uncertainty is likely prove to be a terrific buying opportunity for investors who can stomach some short-term volatility in anticipation of a better 2020 growth outlook.
The week ahead
Looking to the week ahead, I stand by the view outlined last week that the market is undergoing a corrective episode, which has more unfinished business to the downside. The SPX broke down through an uptrend line indicating considerable technical damage. It staged a relief rally back up to test and stall right at trend line resistance. It would be unusual to see a V-shaped rebound and the bull phase to resume as if nothing had ever happened. At a minimum, this kind of market structure calls for a period of choppiness and sideways consolidation.

Sentiment has not fully washed-out. Typically sentiment will fall to capitulation levels before a durable bottom is made. One example is the Fear and Greed Index falling to under 20.

To be sure, the latest AAII sentiment survey shows the bull-bear spread falling to wash-out levels. However, the survey suffers from a small sample size, and the same participants are not the same in each week`s survey. AAII had the following comment about the latest unusual results where bearishness spiked precipitously.
The survey period runs from Thursday through Wednesday. Reminders to take the survey are sent out every Monday.
Many individual investors have been monitoring trade negotiations, particularly between the U.S. and China. Last Thursday’s threat by President Donald Trump to impose new tariffs and the subsequent drop in stock prices likely had a significant impact on this week’s readings. Additionally, a separate survey we recently conducted among AAII members found that 48% expect a recession to start within the next 12 to 24 months.
Also having an influence on sentiment are Washington politics, geopolitics, valuations, corporate earnings, monetary policy and interest rates.

Other sentiment surveys, such as Investors Intelligence, saw bullishness fall, but did not see a similar surge in bearishness.

More evidence of unfinished business to the downside came from momentum indicators. Subscribers received email alerts of a short-term buy signal last week, and subsequent sell signal Thursday based on % of stocks above the 5 dma recyling from an oversold to overbought condition.

Even as the short-term % above 5 dma surged to an overbought condition, the slightly longer % above 10 dma indicator is exhibiting a series lower lows and lower highs, indicating breadth deterioration.

Net 20 day new highs-lows, which is an indicator with a longer time horizon, is also displaying a similar pattern of lower lows and lower highs.

What can turn me bullish? I would like to see a gradual recovery in new highs before becoming more constructive on stocks. While new highs have risen marginally to break the recent downtrend, I would like to see a more prolonged bottoming pattern before sounding the all-clear signal.

As well, the Zweig Breadth Thrust Indicator flashed an oversold condition last Monday, which is a setup for a possible breadth thrust. The market has 10 days after the oversold condition to rise to an overbought reading, which would be a signal of a bullish breadth thrust. Last Tuesdy was day 1. While a ZBT buy signal is always possible and I am keeping an open mind on this matter, I am not holding my breadth.

My inner investor has adopted a more defensive view on stocks. He is aiming to lighten up his equity position from a neutral weight to a slight underweight on rallies.
My inner trader scalped a minor gain last week when he caught the brief rally. He took profits last Friday, and he is back to a short position in the market.
Disclosure: Long SPXU
Excellent explanations Cam, as always. Thanks for all your hard work in pulling in disparate parts.
Cam,
I’ve been following the Chinese real estate companies you offered a few weeks ago. At least one is looking to break support. How concerned should one be about a Chinese recession. I offered the Kyle Bass opinion before, but to go further, he believes this is not about trade but about the dollar, and that we are starving them of dollars to get a deal. The bear case is if they don’t deal, trouble comes from abroad and not from the US. Any thoughts? Much obliged.
China Evergrande (3333) fell and it is nearing long-term support because of a poor earnings report. The others remain well above support.
China Evergrande is a major developer, and its stock price is something that should definitely be monitored. Not panicking yet, but it’s something to keep an eye on.
Thanks.
Can you provide performance information on your Trend Model which just turned Bearish. Thx.
Cam
Thanks for the excellent missive. August and September remain bad months, with October being the “bear slayer”. Furthermore with elections next year, Ken’s predictions for November 2020 remains in play. That said, Ken, seems to be in summer hibernation! Lol.
Let us see if and how much volatility cracks up in the current quarter.
I’m back from hibernation. LOL
There is a possible huge money making event coming up in autumn. When China stands strong Trump will see stocks fall and the economy weaken
This severely hurts his reelection chances. I believe he will choose to abandon the “restrain China” initiative. This means firing Navarro.
If Navarro is fired I think markets globally would rally 10% week one and keep going up.
I suggest everyone has a plan on what to do if that happens.
The other surprise possibility is Trump demoting Powell from Chairmanship. He can’t fire him but he can demote. This would be positive for stocks, negative for the American dollar and gold would take off.
Just a heads up.
Hey welcome back! I always enjoy your thoughts. Do you have a website or newsletter?
Thanks
Thank for your input Ken. So sying “You’re fired!” to Powell or Navarro (or both!) may jump start the markets upward.
Plan for an Autumn bonanza
Ken
Sorry to wake you up, LOl. Your proposed scenario sounds quite plausible and could come sooner than later with the crackdown on Hong Kong protestors. Cam has already described the other two known factors i.e. tariffs on 1 September and Brexit in October.
Global growth scare emanating from Hong Kong shutdown would push central banks to lower rates further, benefitting gold.
Let us pencil in 19th August, coming Monday. The temporary reprieve that Huawei got, ends coming Monday. If this is not extended (likely IMHO), there will be further retaliation from China. We shall see in what form this retaliation takes place.
Hi Cam, as I can see the EXACTA buy signal was activated yesterday. Are you contemplating to use the signal? I do think that the retest of previous low on ES basis must arrive first. Thx for explanation.
There was a nice shortsqueeze couple moments ago – I have also bought some more shorts 🙂
The market is oversold and I would not doubt that EM could rally, but the headwinds for USD is persistent. Unless the fundamentals of the budget deficit changes, or Treasury`s financing schedule changes (not sure how), the USD is going to be well bid over the next few months.