Preface: Explaining our market timing models
We maintain several market timing models, each with differing time horizons. The “Ultimate Market Timing Model” is a long-term market timing model based on the research outlined in our post, Building the ultimate market timing model. This model tends to generate only a handful of signals each decade.
The Trend Model is an asset allocation model which applies trend following principles based on the inputs of global stock and commodity price. This model has a shorter time horizon and tends to turn over about 4-6 times a year. In essence, it seeks to answer the question, “Is the trend in the global economy expansion (bullish) or contraction (bearish)?”
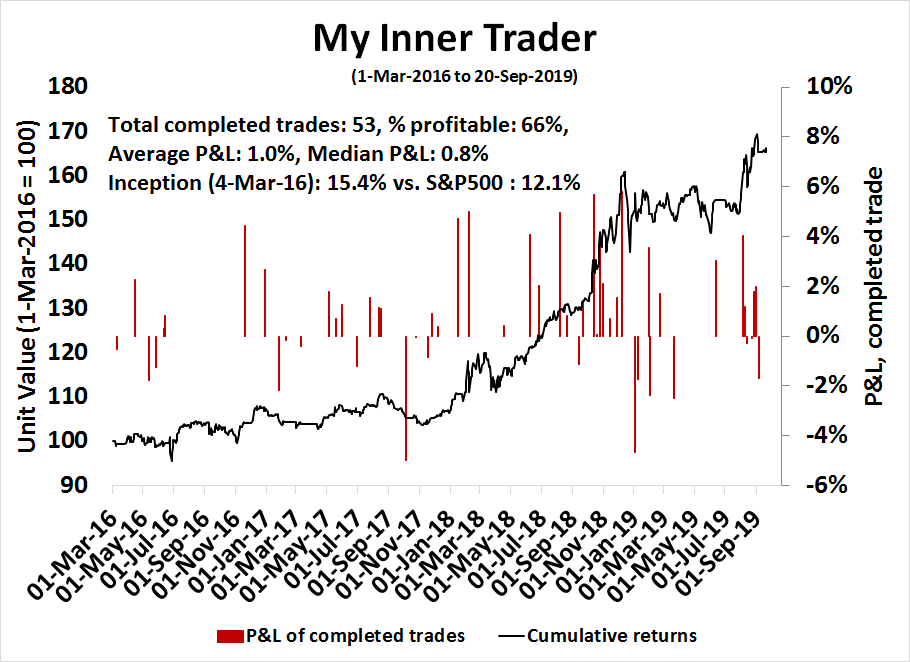
My inner trader uses a trading model, which is a blend of price momentum (is the Trend Model becoming more bullish, or bearish?) and overbought/oversold extremes (don’t buy if the trend is overbought, and vice versa). Subscribers receive real-time alerts of model changes, and a hypothetical trading record of the those email alerts are updated weekly here. The hypothetical trading record of the trading model of the real-time alerts that began in March 2016 is shown below.
The latest signals of each model are as follows:
- Ultimate market timing model: Buy equities
- Trend Model signal: Bearish
- Trading model: Bearish
Update schedule: I generally update model readings on my site on weekends and tweet mid-week observations at @humblestudent. Subscribers receive real-time alerts of trading model changes, and a hypothetical trading record of the those email alerts is shown here.
The bull and bear cases
In light of my recent cautious views, I have had a number of intense discussions with readers about the equity outlook for the next 3-6 months. I would like to explain my reasoning by analyzing the bull and bear cases.
The bull case
The bull case for equities rests mainly on momentum, which can be seen at both the technical, macro, and fundamental dimensions.
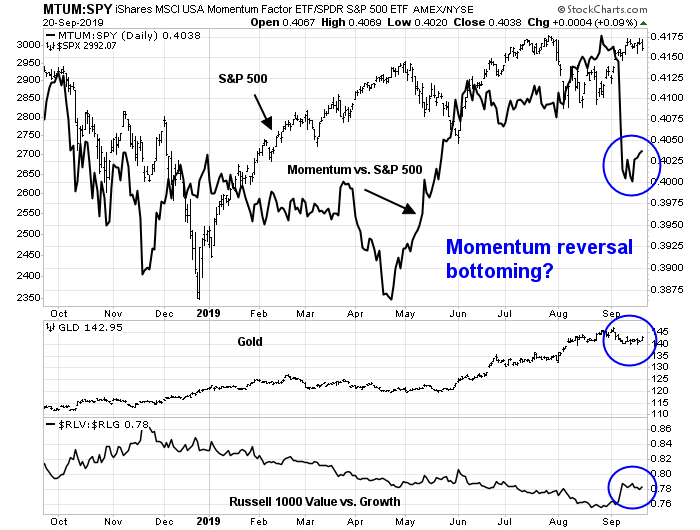
It is important to preface these remarks with definitions of technical momentum. There is the price momentum factor, which posits that stocks which outperform will continue to beat the market. The price momentum factor suffered a recent reversal, and its outlook is uncertain. On the other hand, asset price momentum, which is based on the theory that outperforming asset classes will continue to rise, is still going strong. One manifestation of asset price momentum is FOMO, or the Fear of Missing Out.
There is plenty of academic evidence for the psychology of price momentum. A Bloomberg article outlined one example of the herding effect in musical tastes:
Over a decade ago, a celebrated paper by sociologists Matthew Salganik, Peter Dodds and Duncan Watts tried to answer such questions. They asked: When a song turns out to be a spectacular success, is it because it’s really great, or is it just because the right number of people, at an early stage, were seen to like it?
Salganik and his colleagues created a control group in which people could hear and download one or more of dozens of songs by new bands. In the control group, people were not told anything about what anyone else had downloaded or liked. They were left to make their own independent judgments.
The researchers also created eight other groups, in which people could see how many people had previously downloaded songs in their particular groups. Here was the central question: Would it make a big difference, in terms of ultimate numbers of downloads, if people could see the behavior of others?
It certainly did. While the worst songs (as established by the control group) never ended up at the very top, and while the best songs never ended up at the very bottom, essentially anything else could happen. If a song benefited from a burst of early downloads, it could do really well. If it did not get that benefit, almost any song could be a failure. In short, the judgments of a few early movers could initiate a social cascade, making or breaking a song.
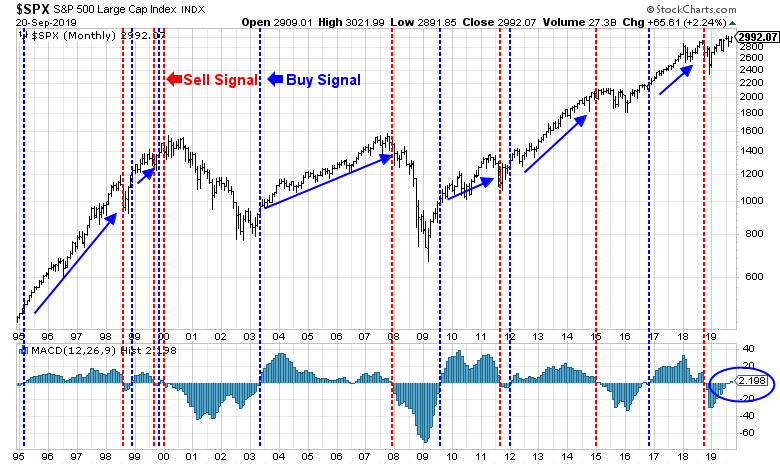
One preliminary bullish sign of asset price momentum can be seen in the monthly S&P 500 MACD signal. Should the index remain at these levels by the end of September, this indicator will generate a long-term buy signal for the market. As the chart below shows, past buy signals have been very prescient at calling bull trends.
There is an important caveat. The monthly chart of the broader Wilshire 5000 has not confirmed the monthly MACD buy signal, though it is very close.

Nor has it been confirmed by global stocks, or the EAFE Index (chart not shown).

In the short term, the upside breakout by the S&P 500 at 2950 was accompanied by evidence of a breadth thrust, which is a sign of bullish asset price momentum.
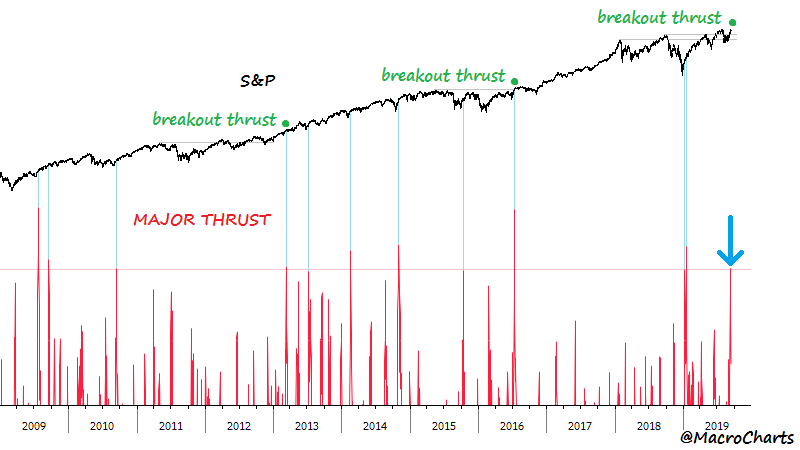
However, that analysis does come with another caveat. Price momentum signals like breadth thrusts have been less effective in the last decade because of a herding effect, probably exacerbated by investors and traders crowding into the price momentum factor.
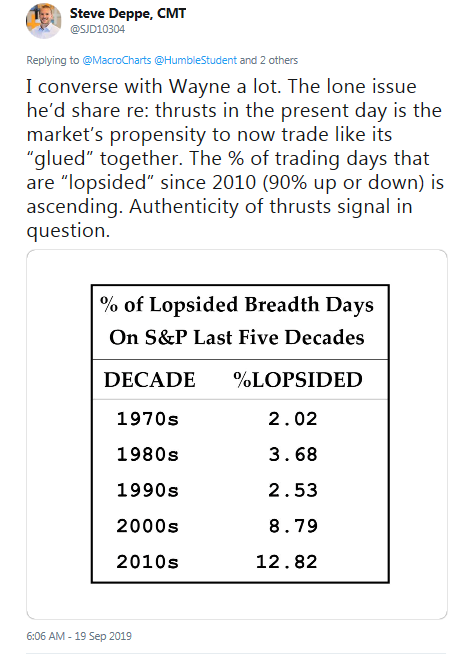
To summarize the technical bull case, the market is flashing a bullish breadth thrust, and it is on the verge of an unconfirmed long-term MACD buy signal. Should stock prices continue to rise in the coming weeks, we should have bona fide case for a FOMO stampede.
Macro and fundamental momentum
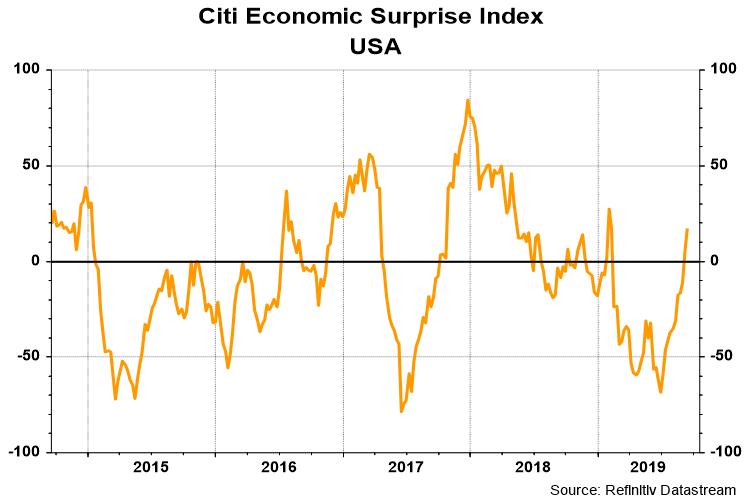
The bull case does not just rest on technical momentum, but macro and fundamental momentum as well. The Citigroup Economic Surprise Index, which measures whether high frequency economic data is beating or missing expectations, has been on a tear lately. This is an indication that the economy is improving much faster than expected.
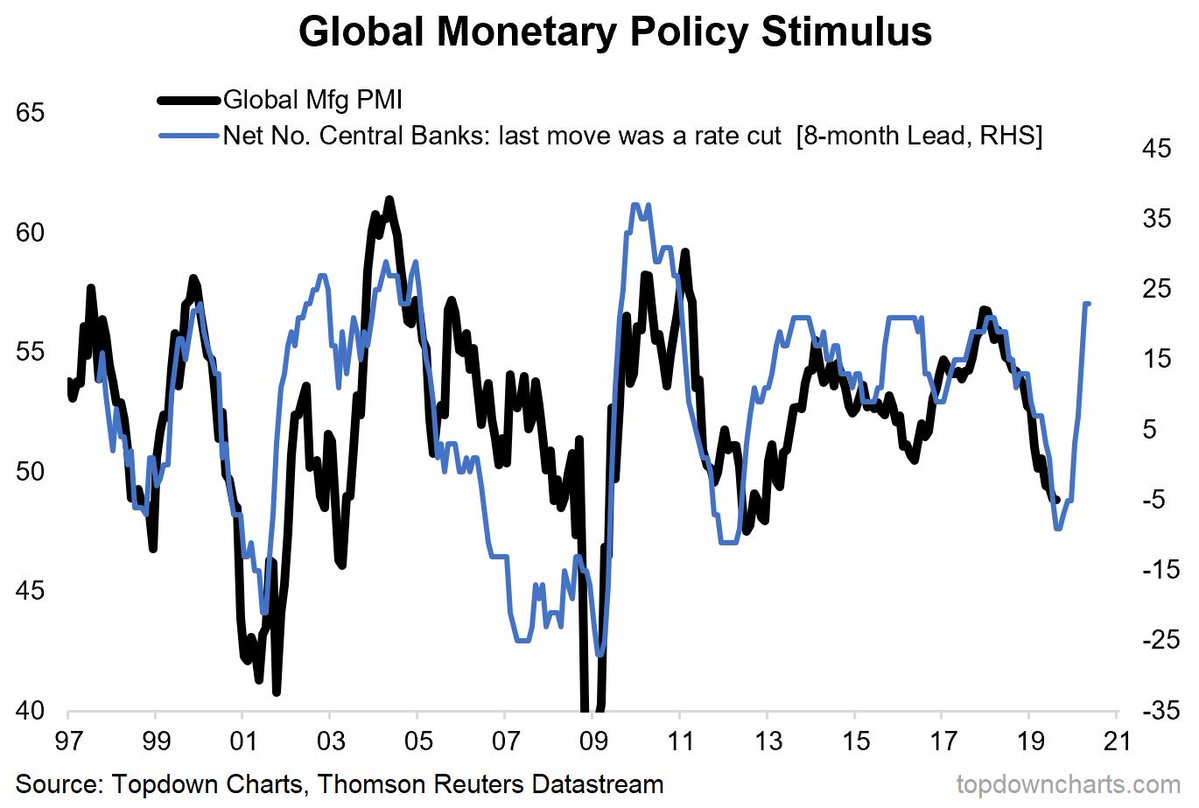
Callum Thomas at Topdown Charts observed that global monetary policy is easing, which should lead to a recovery in PMIs in the near future. A rebound in the global cyclical outlook in early 2020 is imminent.
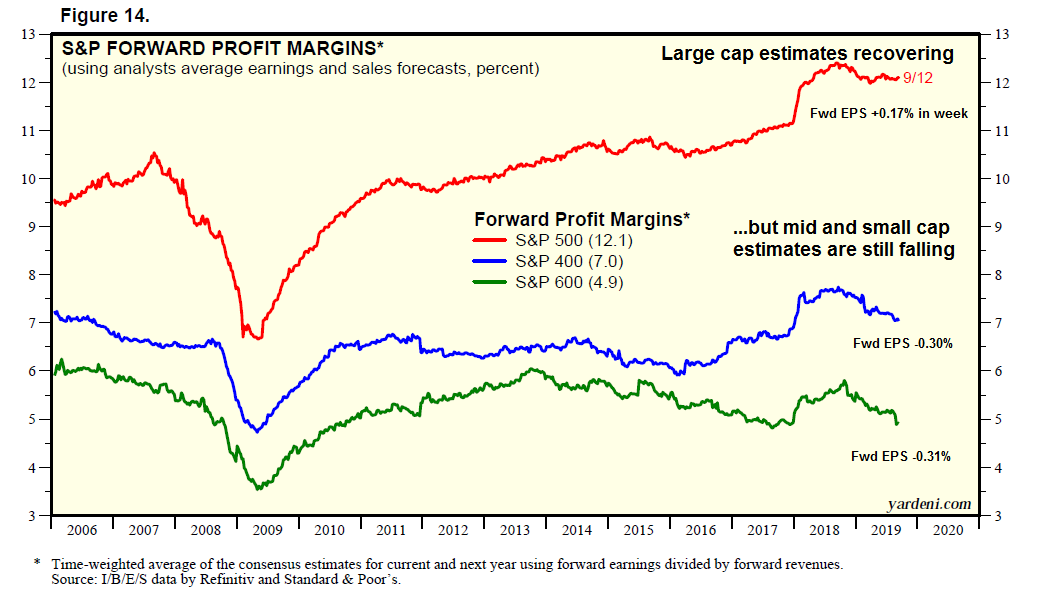
Earnings estimates have begun to turn up in an uneven fashion. Forward 12-month margin and EPS estimates are recovering for large cap S&P 500 stocks. However, they are still declining for mid and small caps.
To summarize, the bull case rests on momentum. The slowdown in the global economy appears to be bottoming out. Earnings estimates are starting to improve. The improvement in fundamentals is being reflected in technical price momentum. Investors should hitch a ride on the bullish train.
The bear case
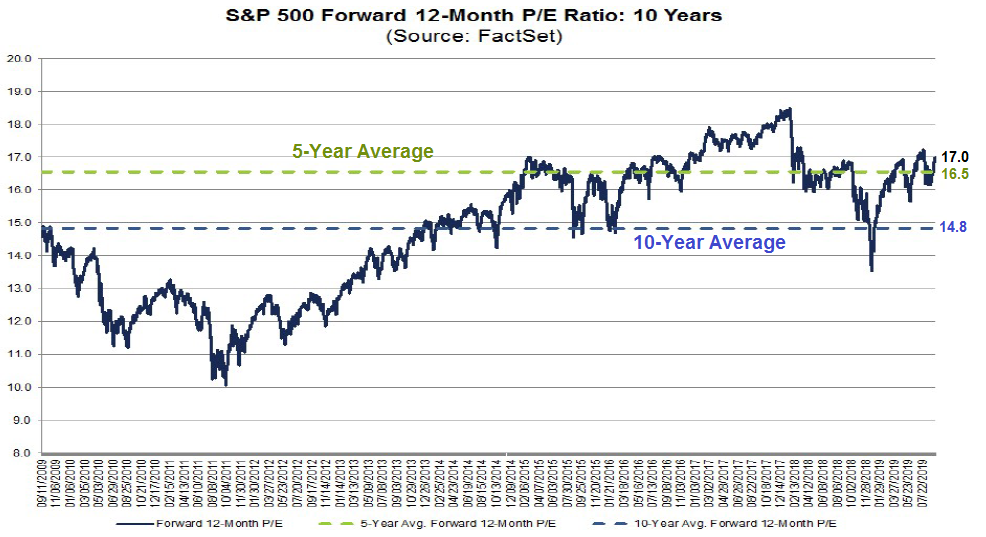
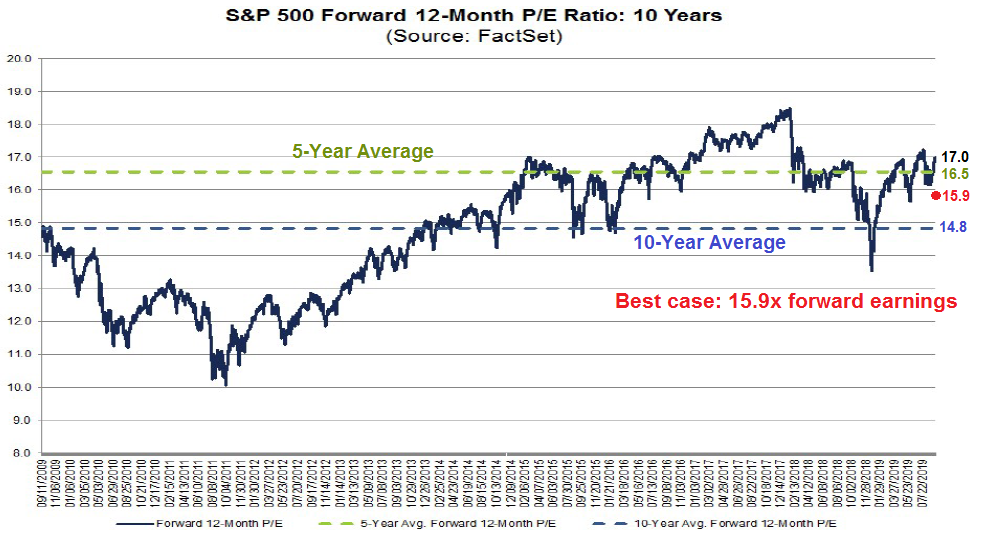
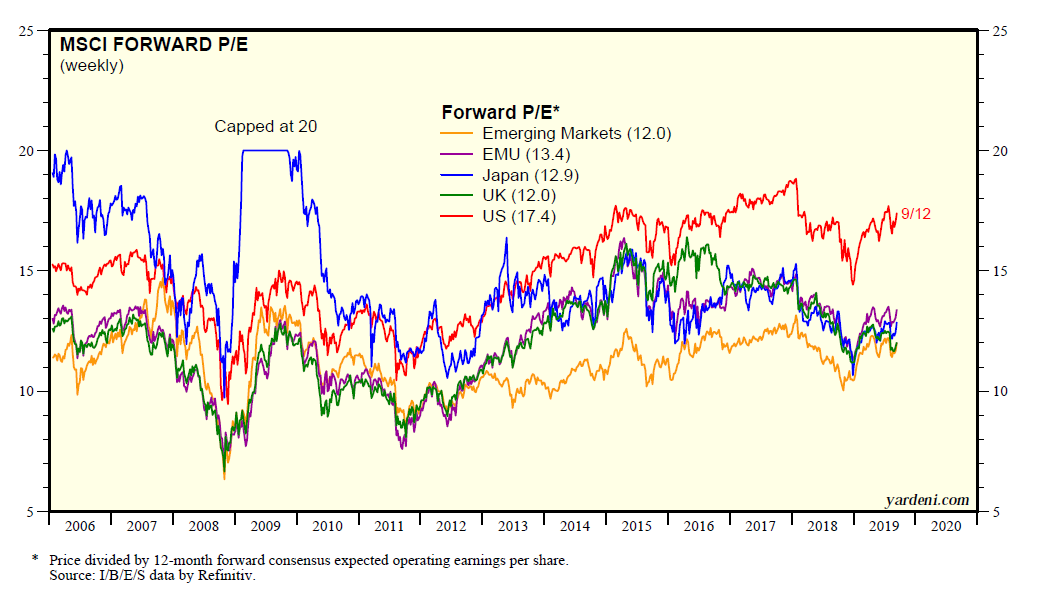
I hate to sound like an old fogey, but one of the reasons for caution is valuation. The market trades at a forward P/E ratio of 17.0, which is above its 5-year average of 16.5 and 10-year average of 14.8. Even though the E in the P/E ratio is rising, valuations are elevated at 17 times forward earnings. It is difficult to envisage much upside without postulating an irrational investment bubble in stock prices.
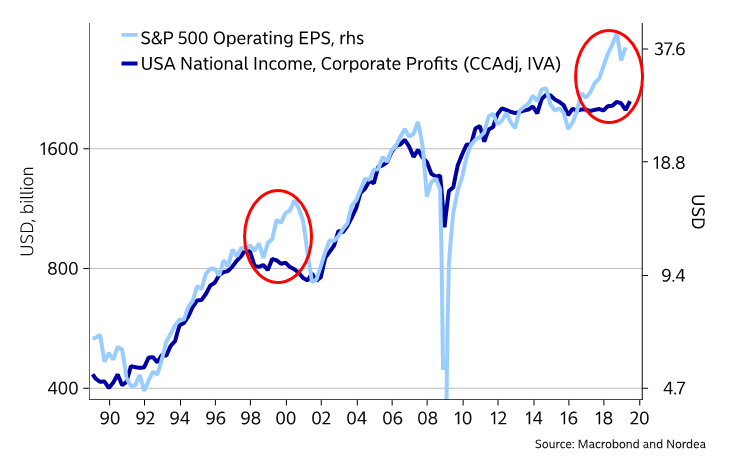
As a reminder, the stock market is not the economy, and NIPA profits better reflects the American economy. We can see a similar effect when we chart S&P 500 profits against NIPA profits. The last time this degree of divergence occurred was the top of the NASDAQ Bubble.
A second reason to be cautious is the uncertainty in trade negotiations. The Sino-American trade war is unlikely to be resolved in the near future. That’s because Trump really doesn’t know what he wants from the Chinese. Linette Lopez explained the dilemma in a Business Insider editorial:
It is easy to forget that initially this trade war was about making China’s markets fairer for US businesses — ending favoritism for domestic companies, forced technology transfers, and intellectual-property theft. In March 2018, US Trade Representative Robert Lighthizer wrote a report to Congress outlining all these issues and all the ways China was in violation of World Trade Organization rules. It all made sense.
But at the same time there was Trump and his obsession with trade deficits — with getting China to buy more US stuff. This did not, and still does not, make any sense. In sophisticated economies, bilateral trade deficits don’t mean anything.
Lighthizer wants changes that would make China a more free-market economy like the US. Trump wants changes that further distort the Chinese economy by explicitly forcing it to buy goods from one place rather than another. The former is capitalism. The latter is Trump’s variety of populist nationalism. And they do not play well together.
“There are various ways in the short run to reduce the bilateral trade deficit, but this would be done in ways that are essentially market-distorting,” Lee Branstetter, a Carnegie Mellon University economist, told Business Insider.
These two conflicting goals have repeatedly caused issues during the on-again, off-again negotiations. Think back to December: Trump ratcheted up the tariffs, China managed to negotiate a temporary peace by promising to buy US soybeans, negotiations resumed, and then they collapsed as China refused to yield to the US’s conflicting demands.
Before, Trump making a trade deal with China “was always about setting the rules and structures and accepting the market outcomes,” Branstetter said.
Now it’s about sales.
And on the other hand, if Lighthizer’s objectives (changing the rules to open up China for US companies) are met, it’s likely that Trump’s core nationalist objectives (forcing companies to move to the US) will suffer.
Chinese and American negotiators are scheduled meet yet once again. However, this internal contradiction in the US negotiating position continues to overhang the talks. As Trump vacillates between the two goals, his frequent flip-flops undercuts his own negotiating team, and confuses the Chinese. In addition, US attention is likely to turn towards the EU, and a new front in the trade will could open.
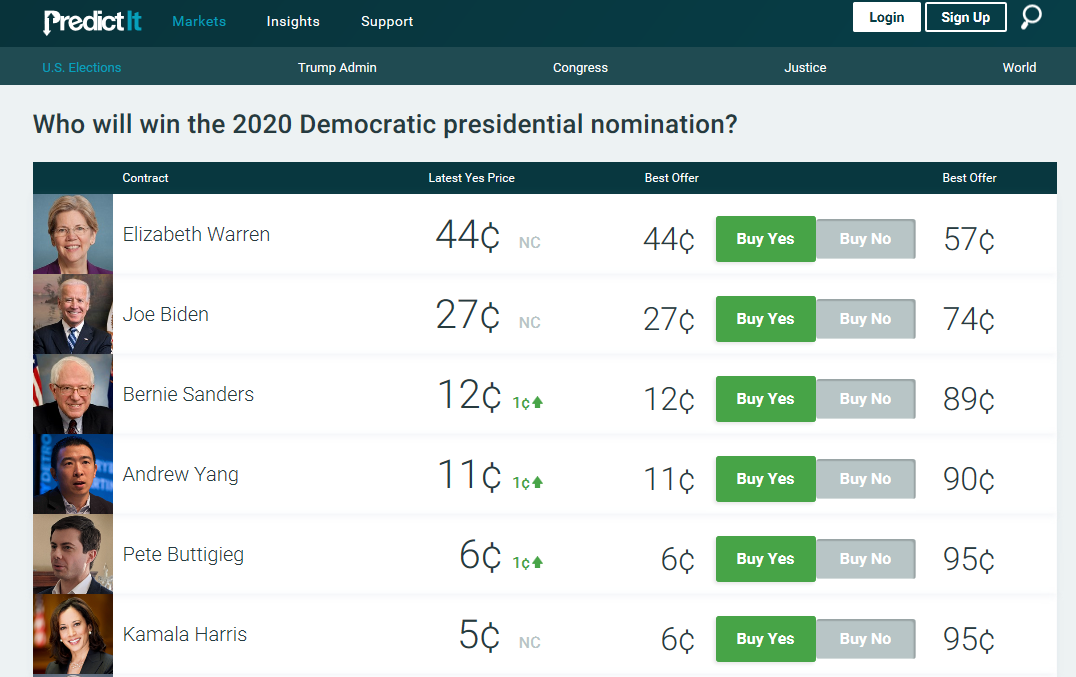
Another possible bearish development that I have not seen any analyst discuss is the implication of the Democrat battle for the presidential nomination. While Joe Biden is currently leading in the polls, Elizabeth Warren is well ahead in the better odds at PredictIt. The market has not begun to discount the possibility of a Warren presidency, whose policies would unsettle the markets.
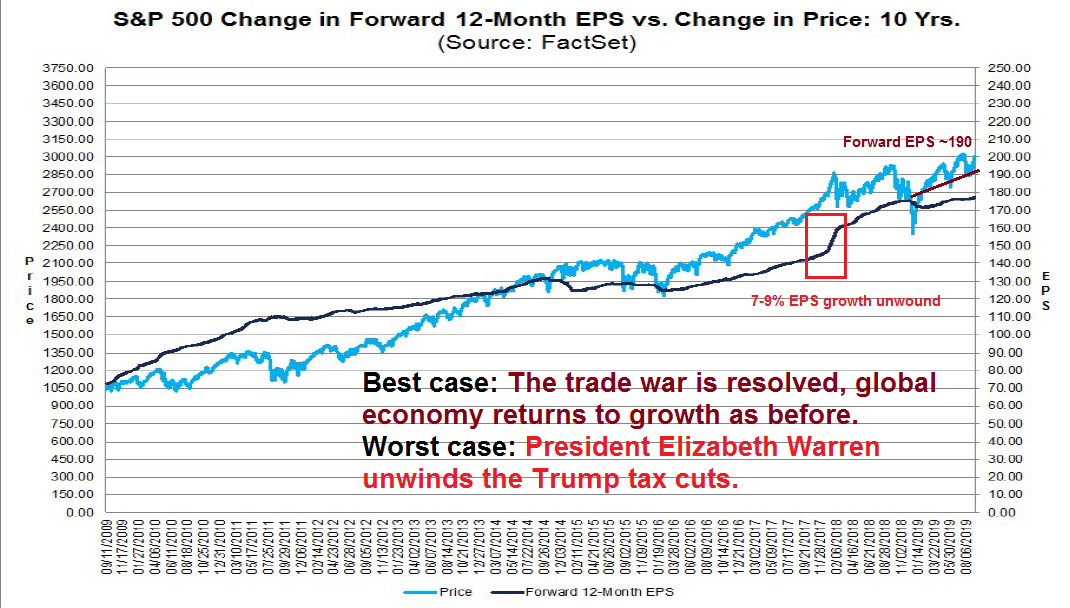
Let us consider the best and worst case analysis for the earnings outlook. In the best case scenario, the US concludes a comprehensive trade agreement with China. Global protectionism drops, and so does business uncertainty. Earnings growth revert to a pre-protectionism path. Forward earnings rise to about 190 per share. In the worst case, a Warren White House unwinds the Trump corporate tax cuts, and earnings, which received a one-time bump of about 7-9%, drops by the same amount.
Consider the valuation effects of the best case scenario. Forward P/E would drop from 17.0 to 15.9, which represents moderate value, but that does not make the stock market extremely cheap. In reality, the best and worst case scenarios will never be achieved. Even if the US and China were to come to a trade agreement, implementation would be slow, and confidence would not recover instantly. As well, Warren’s ability to reverse the corporate tax cuts is dependent on which party controls the Senate. Even if the Democrats were to win the upper house, it is unclear whether Senate Democrats would agree with her proposals. In addition, her re-distributive policies would have some stimulative effect of unknown magnitude. Middle and lower income Americans will find more in their pockets, which would boost consumer spending.
In short, equity risk/reward is unfavorable on a valuation basis. It is difficult to see how much upside potential could be achieved in light of the policy risks facing investors.
Resolving the bull and bear cases
Putting it all together, here is how I resolve the bull and bear cases.
Here is the big picture. Investors had herded into a crowded short and overly defensive position, and that trade reversed itself. The reversal was evidenced by the dramatic cliff dive exhibited by the price momentum factor. A lot of the fast hedge fund money was forced to buy equity beta by its risk managers.
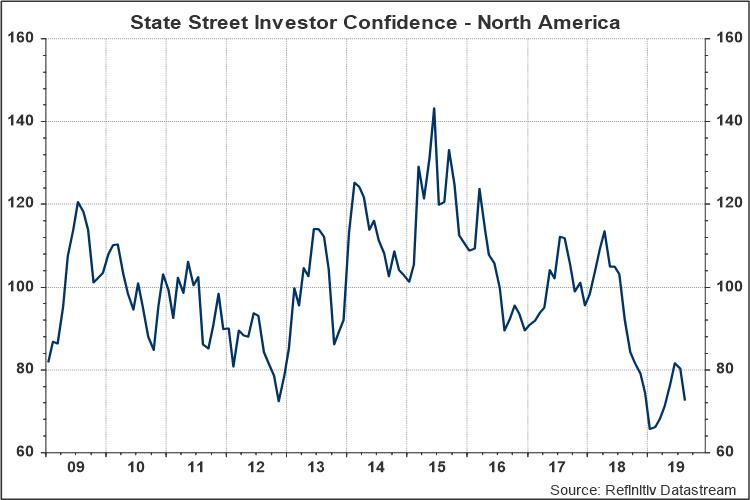
The big question is: Will the slow but glacial institutional money follow and pile into the beta trade? Domestic managers in North America were still defensively positioned as of last report.
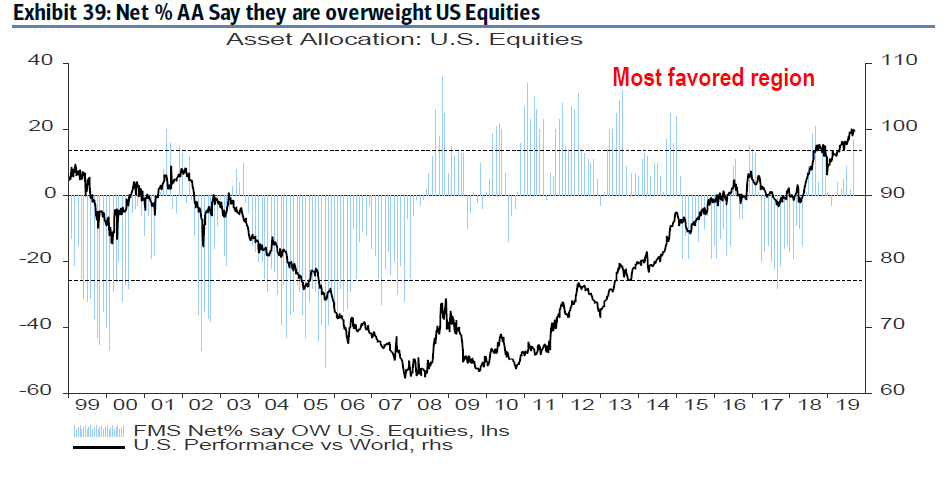
My judgment is “no”. Institutional funds have longer time horizons than individuals or hedge funds, and they have longer time horizons where valuation plays a much bigger role in the decision process. Valuations are too high, and the risk/reward is unfavorable. In addition, while domestic equity managers are short beta, the BAML Global Fund Manager Survey shows that global managers had been piling into US equities as the last source of growth. It is therefore difficult to see where additional demand will appear in the face of stretched valuation, and an overweight position by non-US managers.
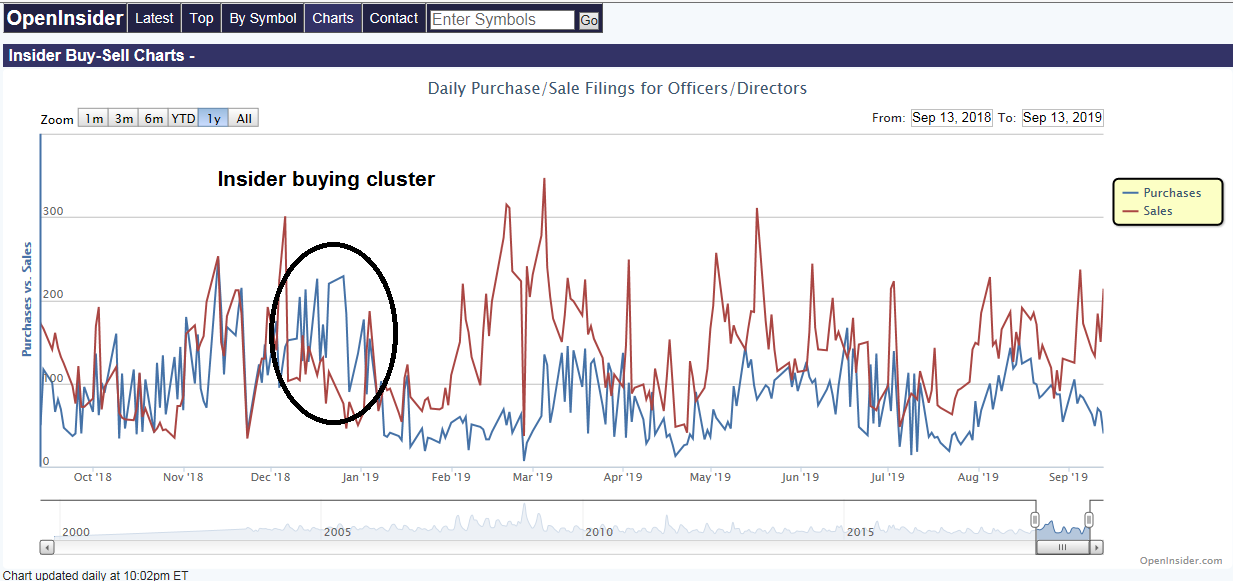
Another signal of caution comes from insider activity. While high insider selling is not useful as a sell signal, we are not seeing the sort of insider buying clusters that mark a buy signal either. This is another indication that insiders do not consider the shares of their own companies to be cheap.
In fact, Mark Hulbert reported that CFO confidence from the Duke CFO Magazine Global Business Outlook survey is plunging.
According to the survey, 53% of CFOs expect a recession no later than the third-quarter of next year. When asked if a recession will begin by the end of next year, the percentage grows to 67%.

This does not mean, however, that investors should totally abandon equities. While US equity valuation is stretched, equity valuation outside US borders are far more reasonable. However, each region does come with its own sets of risks. Emerging markets depend on the USD, which has been strengthening, and resolution in the Sino-American trade war. The eurozone economy is weak, and it is dependent on exports to China, and therefore it has a high beta to Chinese growth, which is slowing. The UK is facing a strong binary risk of a no-deal Brexit, which would also sideswipe Europe if it left the EU in a disorderly fashion.
Pick your poison, but at least the risk/reward ratio is more attractive than a commitment to US equities.
The week ahead
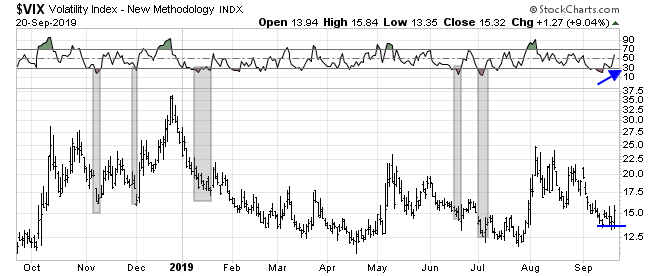
Looking to the week ahead, the market may be setting up for a volatility spike. If a time traveler from the future appeared last weekend and told you that the stock market would trade in a tight 0.5% range after a major attack on Saudi oil processing facilities, would you have believed him? That is precisely what has happened. the market traded in a tight range despite the news of the Saudi attack, and the FOMC meeting. The market may be overly complacent about volatility and risk.

Realized volatility has been unusually low, but it may be setting up for a new spike. The VIX Index became oversold on the 5-day RSI, and past oversold episodes in the past year have usually been resolved with VIX rallies. In addition, the latest instance occurred with a positive RSI divergence, which is volatility bullish, but equity bearish.
One bearish trigger may be renewed USD strength. The USD Index had been tracing out a possible bull flag, which is a bullish continuation pattern. The Index staged a minor, but unconfirmed, breakout from the flag pattern on Friday. This could be the start of a new dollar rally which could unsettle markets.

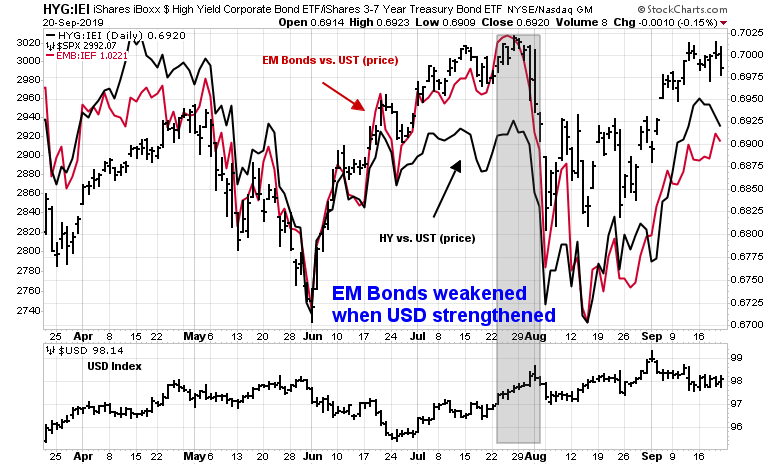
The pain of a strong USD will be felt most acutely in EM economies. As the following chart of credit market risk appetite shows, the relative price performance of high yield (junk) bonds (black line) is already tracing out a negative divergence against the stock market. The relative price performance of EM bonds (red line) weakened when the USD rallied. EM bonds are now trading in line with HY bonds, which are negative signs for equity prices.
In addition, a strong USD will pose headwinds for large cap multi-nationals operating overseas. Even then, an analysis of the relative performance by market cap bands is uninspiring. Megacaps are range bound on a relative basis. Mid and small cap stocks remain in relative downtrends, and NASDAQ leadership is also uninspiring. Should USD strength depress the relative strength of megacap multi-nationals, where will the leadership come from if the market is to rally to new highs?
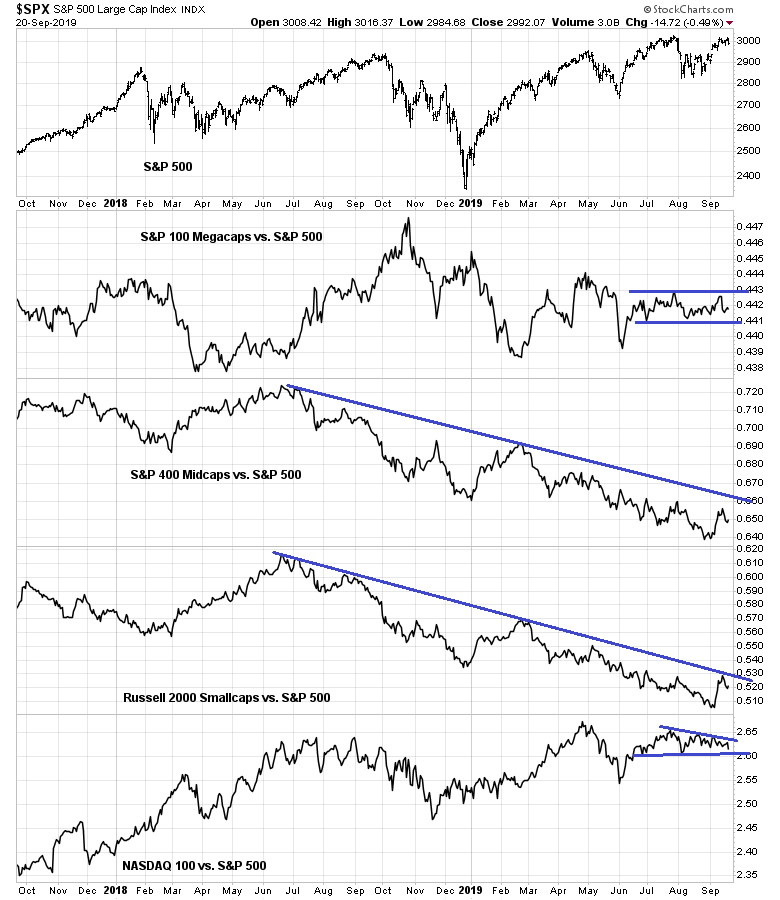
Similarly, the relative performance of high beta groups does not reveal any pattern of dynamic bullish leadership. Most are in relative downtrends, or range bound.
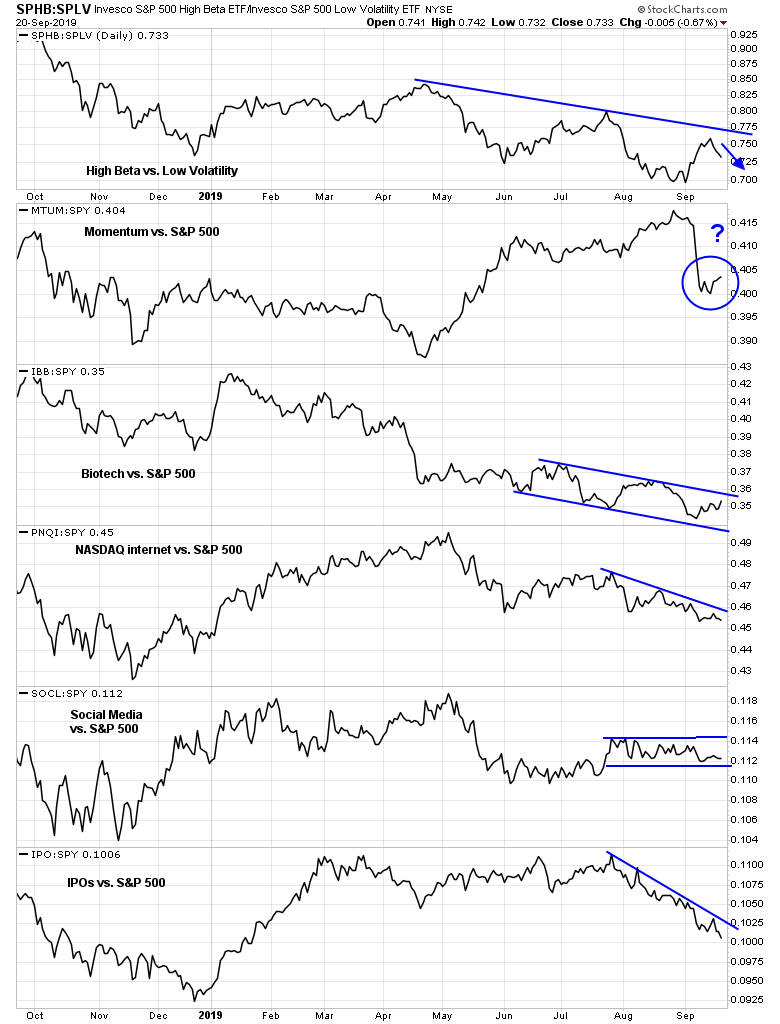
How can the market rally to new highs if leadership is so insipid?
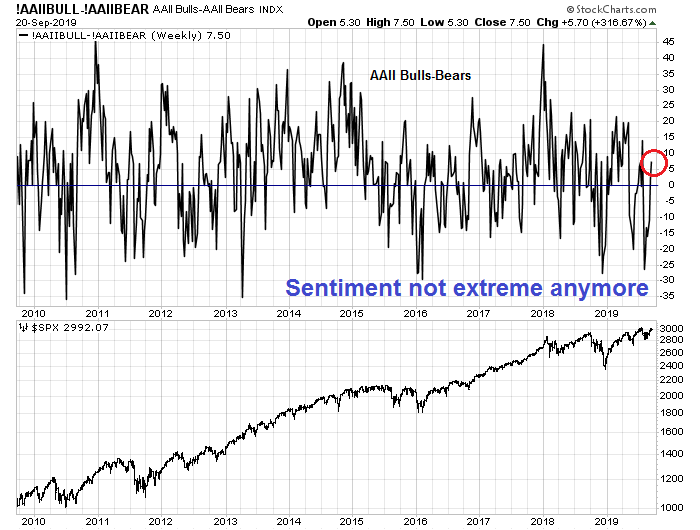
As well, the bulls cannot depend on a tailwind from a crowded short readings on sentiment models. Trader sentiment has normalized. Exhibit A is the weekly AAII survey, where bulls now outnumber bears.
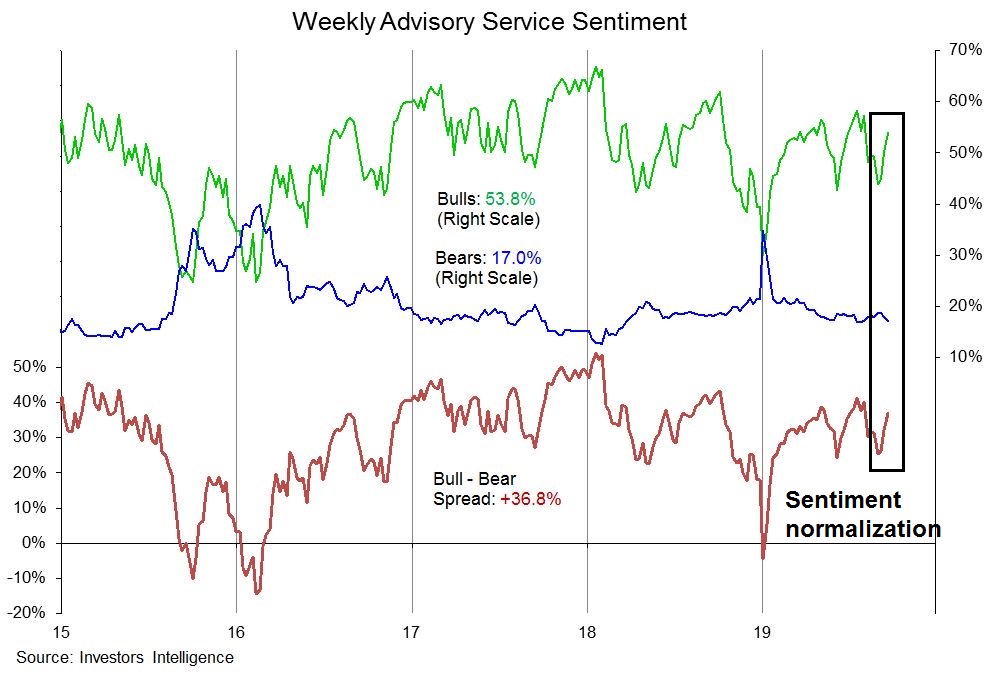
Investors Intelligence also shows a similar pattern of sentiment normalization. Arguably, the net bull-bear II spread could be interpreted as becoming close to a crowded long.
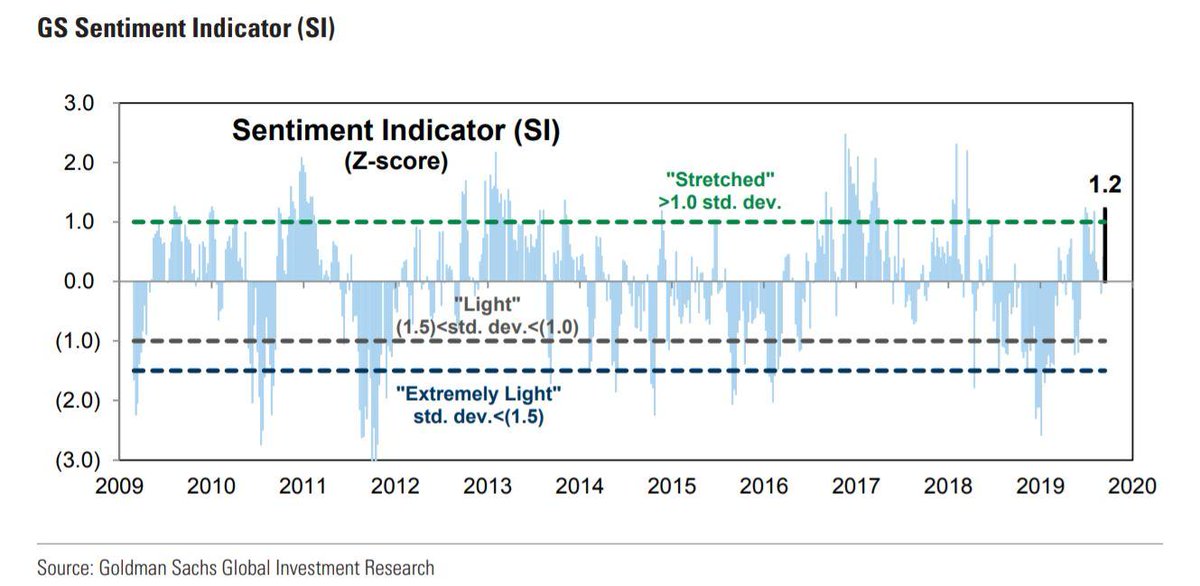
The Goldman Sachs Sentiment Indicator also tells a similar story. Goldman reported that hedge fund net exposure is now highest since July 2018, and foreign investors are piling into US equities.
In the short run, momentum indicators are falling and only in neutral territory, indicating that the market may have more room to fall in the early part of the week.

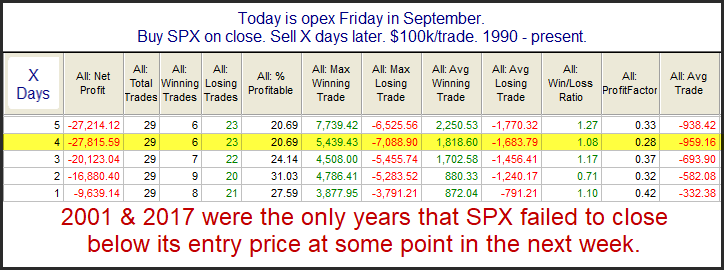
The market is also facing seasonal headwinds next week. Rob Hanna at Quantifiable Edges observed that the week after September option expiry has historically been the weakest week of the year for stocks. “Since 1960 the week following the 3rd Friday in September has produced the most bearish results of any week.”
My inner investor remains cautiously positioned. My inner trader is short the market, and he will watch how the S&P 500 behaves as it nears support at 2950 before taking further action.
Disclosure: Long SPXU
Cam, since your analysis relies on P/E ratios, the movement of the TLT seems an important variable. If we are going to see new lows in the TLT then maybe you can justify higher P/E multiples, at least until more QE of some sort arrives. Would you analyse this issue in the future. Cheers.
There are several ways of addressing this issue:
1) If you were to calculate an equity risk premium (ERP) based on the inverse of forward PE (EP) and compare it to either the 10 year or 30 year Treasury, ERP looks ok compared to its own history
2) However, as I showed, forward PE ratios for non-US regions are much lower than the US, and bond yields are negative. This implies non-US stocks have better ERPs than the US
3) David Merkel at Alphe Blog recently published his 10-year expectations of S&P 500 total returns, which came to 3.8%. This is not all that exciting when you consider what you can get in a risk-free Treasury. Add in fees (even in a passive ETF) will cut down that figure. Link here:
https://alephblog.com/2019/09/21/estimating-future-stock-returns-june-2019-update/
His methodology is based on “the proportion of US wealth held by private investors in stocks using the Fed’s Z.1 report. The higher the proportion, the lower future returns will be.”
http://alephblog.com/2016/04/09/estimating-future-stock-returns/
Thanks for your response Cam. In relation to 2). I consider the higher European ERP as reflecting its value tilt as opposed to the US market which reflects a growth tilt. I live in Europe and prefer to invest in the US, on the basis that it is comparative value trap, esp. with the trade war in the background. I find comparable analysis to other asset classes more persuasive. For example I’m more interested in gold than I used to be. 🙂
Cam: I really appreciate your work and all that you do. Thanks.
Question: You mentioned last last week that the VIX index was due for a spike according to your calculations, and last Friday it did indeed go up almost 6 %. Do you think there is any more upside potential from here in the VIX index for the remainder of September?
Short answer is yes. VIX began to rise Friday and it is still experiencing a positive 5-day RSI divergence
Hi Cam, I understand you don’t expect a new Bear market to start any time soon, but you are short and medium term Bearish. My question is „how much“ bearish are you? Do you expect mild pullback i.e. 5-8% … or do you expect a larger correction i.e. >10%? Thank you.
I don’t know about Cam but I’ve been looking for the S&P to at least close the gap at 2938.
The short position is a tactical trading position that can change at any time.
It’s hard to make any specific forecast, but if I had to guess, the S&P 500 is likely to be flat to down for the rest of the year, with a drawdown of 5-10%.
In other words, normal equity risk and not a major bear market.
Cam, you were looking for a valuation reset (5%-10% correction) in near-term and then expecting the market to rise into year-end. Is that still the case?
Sorry, my time machine is in the shop right now. There are a lot of moving parts of what might happen in the next 3-6 months, both on the political, trade, and economic fronts.
In the absence of strong political and trade developments, a 5-10% valuation reset until year-end appears reasonable. However, all bets are off if we get either positive or negative headlines news on politics and trade.
Thank you, Cam.
I think one way to gauze it could be, like Cam has indicated, when P/E resets to more historical trends, 14.5 – 16.8. Whatever level on S&P that brings us to. Based on which way the Political or Trade wind blows. That’s one way, I can make some heads or tails of it.