Preface: Explaining our market timing models
We maintain several market timing models, each with differing time horizons. The “Ultimate Market Timing Model” is a long-term market timing model based on the research outlined in our post, Building the ultimate market timing model. This model tends to generate only a handful of signals each decade.
The Trend Asset Allocation Model is an asset allocation model which applies trend following principles based on the inputs of global stock and commodity price. This model has a shorter time horizon and tends to turn over about 4-6 times a year. In essence, it seeks to answer the question, “Is the trend in the global economy expansion (bullish) or contraction (bearish)?”
My inner trader uses a trading model, which is a blend of price momentum (is the Trend Model becoming more bullish, or bearish?) and overbought/oversold extremes (don’t buy if the trend is overbought, and vice versa). Subscribers receive real-time alerts of model changes, and a hypothetical trading record of the those email alerts are updated weekly here. The hypothetical trading record of the trading model of the real-time alerts that began in March 2016 is shown below.

The latest signals of each model are as follows:
- Ultimate market timing model: Buy equities
- Trend Model signal: Bullish
- Trading model: Bullish
Update schedule: I generally update model readings on my site on weekends and tweet mid-week observations at @humblestudent. Subscribers receive real-time alerts of trading model changes, and a hypothetical trading record of the those email alerts is shown here.
The art of upside target projection
It has become evident to technical analysts that the stock market has staged a convincing upside breakout. Not only have the major global averages broken out to the upside, the monthly charts of selected indices have flashed MACD buy signals. In the past, such buy signals have indicated significant price gains, with only minor downside risk.

In that case, what is the upside potential for stocks? We estimate targets using a variety of technical and fundamental techniques, and arrived at some different answers.
I found that price targets derived from technical analysis are highly ambitious and they call for upside potential of 25% or more. By contrast, valuation and longer term projections point to highly subdued return expectations. My Third Way scenario postulates that the S&P 500 could see a price appreciation potential of 10-13%, or 3380 to 3480 before suffering a downdraft of unknown magnitude.
Ambitious targets
A brief survey of technical analysis revealed some astounding upside targets. Callum Thomas observed that Peter Brandt had projected an S&P 500 target of 3524.

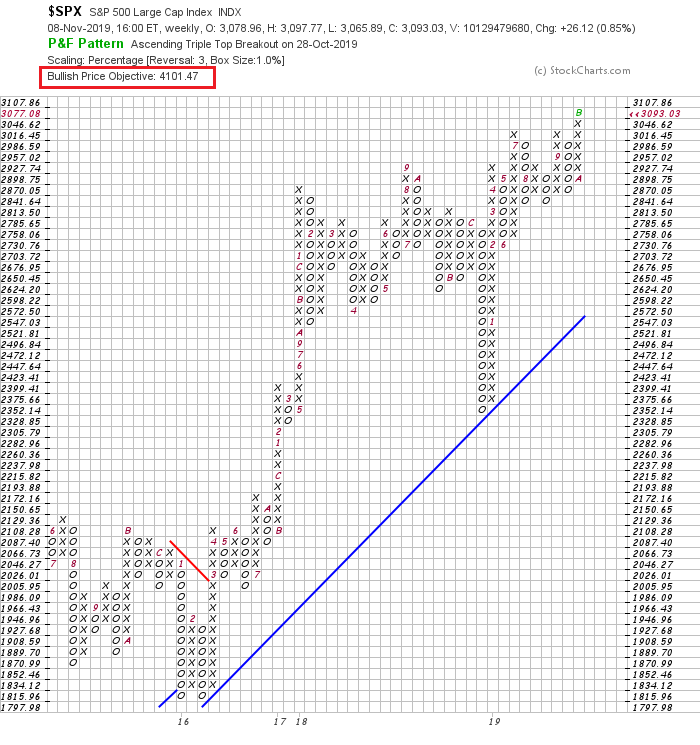
Point and figure charting yielded a series of different results, depending on the parameters set in the charts. We tried daily, weekly, and monthly charts, with traditional and 1% boxes, and 3-box reversals. The upside target ranged from 3750 to 4100, with most clustered in the 3900-4000 range. These are all aggressive targets with upside potential of 22% or more from current levels.
While these are not purely technical targets, Callum Thomas also highlighted the bullish analysis from perennial bull Tom Lee of Fundstrat, who projected even more upside potential for stock prices.

Valuation headwinds
The sunny technical forecasts are tempered by market valuation headwinds. The S&P 500 trades at a forward 12-month P/E ratio of 17.5, which is nearing the nosebleed zone. The E in the P/E ratio would have to improve considerably to justify these multiples.

From a longer term fundamental perspective, David Merkel projected a 10-year total return of only 3.6% on September 21, 2019, when the S&P 500 stood at 2990. These forecasts have been remarkably accurate. If 3.6% return were to be realized, it would either mean that the uber-bullish technical targets are pure fantasy.
There are many ways of estimating long-term returns. Merkel explained that he tried using a variety of valuation techniques, which explained “60-70% of variation in stock returns”. He settled on a technique he found at the blog Philosophical Economics,
The basic idea of the model is this: look at the proportion of US wealth held by private investors in stocks using the Fed’s Z.1 report. The higher the proportion, the lower future returns will be.
There are two aspects of the intuition here, as I see it: the simple one is that when ordinary people are scared and have run from stocks, future returns tend to be higher (buy panic). When ordinary people are buying stocks with both hands, it is time to sell stocks to them, or even do IPOs to feed them catchy new overpriced stocks (sell greed).
The second intuitive way to view it is that it is analogous to Modiglani and Miller’s capital structure theory, where assets return the same regardless of how they are financed with equity and debt. When equity is a small component as a percentage of market value, equities will return better than when it is a big component.
Bottom line: Both equity valuation and a survey of private investor positioning suggests sub-par US equity returns. The gains of 20% or more appear way too ambitious.
A Third Way market scenario
How can we square the circle of these contradictory views?
Investors can resolve this dilemma by recognizing that there are different time frames to the two schools of thought. The analysis of short-term macro outlook, institutional positioning, and valuation suggests that both are right. A more reasonable scenario is a bubbly market melt-up, followed by a downdraft, all in a 2-3 year time frame.
Let us first consider the issue of institutional positioning. Macro Charts analyzed stock and bond fund flows and concluded that investors had become excessively cautious, and the latest upside breakout in the major global equity markets is a signal that stock prices are ready to soar as sentiment changes from fear to euphoria.

A variety of institutional sentiment indicators all point to excessively cautious position. The latest Barron’s Big Money Sentiment Poll revealed a high degree of bearishness among US institutions. The State Street Confidence Index, which measures the actual custodial institutional holdings, also shows a below average market beta exposure.

The latest BAML Global Fund Manager Survey reveal a more nuanced view. The average global manager holds a below average equity weight while overweighting defensive sectors and underweighting cyclicals. That said, they were overweight US equities, as the US economy was the last bastion of growth in a growth starved world.
In addition, analysis from JPM shows that hedge fund equity beta is still very low. Further market gains would have the potential to spark a short-covering stampede.

The cycle turns up
The combination of an overly defensive institutional positioning and a cyclical turnaround could be the spark for a risk-on stampede. Indeed, we are starting to see signs of a cyclical revival. Robin Brooks of IIF observed that global PMIs are rebounding, indicating excessive overshoot to the downside.

There are signs of stabilization in Europe. German exports rose 1.5% month/month and it was the biggest increase since November 2017. As Germany has been the locomotive of growth and exports in the eurozone, this latest reading gives some relief to recession fears.

Real-time market data is also supportive of a turn in the cycle. The yield curve is steepening, which is a signal that the bond market expects better economic growth.

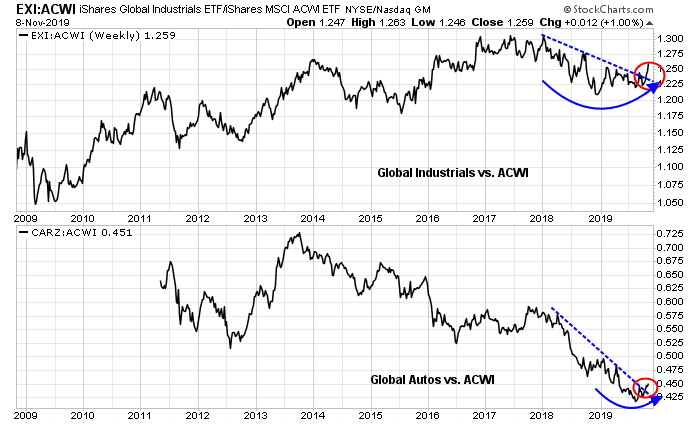
The relative performance of cyclically sensitive industries, such as global industrial stocks and global auto stocks, have bottomed and they are starting to turn up.
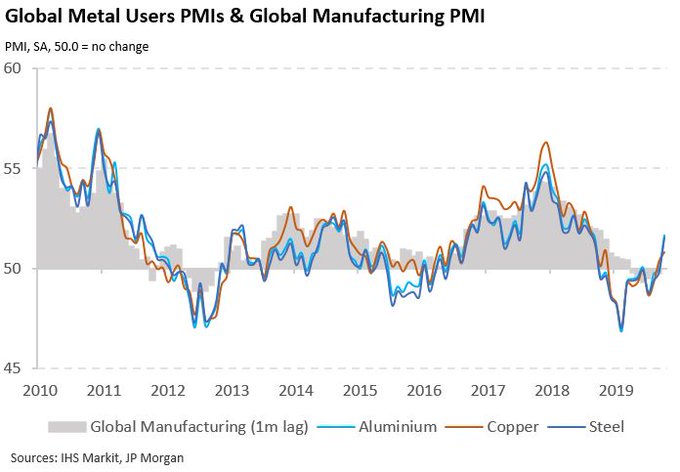
Chinese growth may be bottoming. IHS Markit reported that “global Metal Users PMIs soar into expansion territory in October, as boosts to the Chinese manufacturing sector encourage strong production uplifts at global users of key metals.”
Even the relative performance of Chinese property developers is constructive for the bull case. This is a highly leveraged and vulnerable sector in China. Beijing has done little to support to support these companies as growth has slowed. The revival in relative performance of these stocks is an encouraging sign that the worst of the tail-risk is behind us.

The Rule of 20
We began this exercise by trying to square the circle of highly bullish technical targets with cautious fundamental equity targets. The scenario I sketched out is an overly defensive institutional investor community that is caught offside by a cyclical revival, and chases equity market beta in a FOMO (Fear of Missing Out) rally.
While S&P 500 valuations are somewhat elevated, they are not yet at bubbly levels just yet. I refer readers to Ed Yardeni’s “Rule of 20”, which states that investors should be cautious when the sum of the forward P/E and inflation rate exceeds 20. With the forward P/E at 17.4 and CPI inflation at 1.7%, we are not there yet.

Looking out 12 months, if we were to pencil in a growth rate of 5-8% to forward earnings, and assuming that CPI remains at 1.7%, the S&P 500 would have an upside of 300 to 400 points, or a price appreciation potential of 10-13% before the Rule of 20 warning is reached. As history shows, the Rule of 20 is not a hard and fast rule.
In summary, price targets derived from technical analysis are highly ambitious and they call for upside potential of 25% or more. By contrast, valuation and longer term projections point to highly subdued return expectations. Our Third Way scenario postulates that the S&P 500 could see a price appreciation potential of 10-13%, or 3380 to 3480 before suffering a downdraft of unknown magnitude.
The week ahead
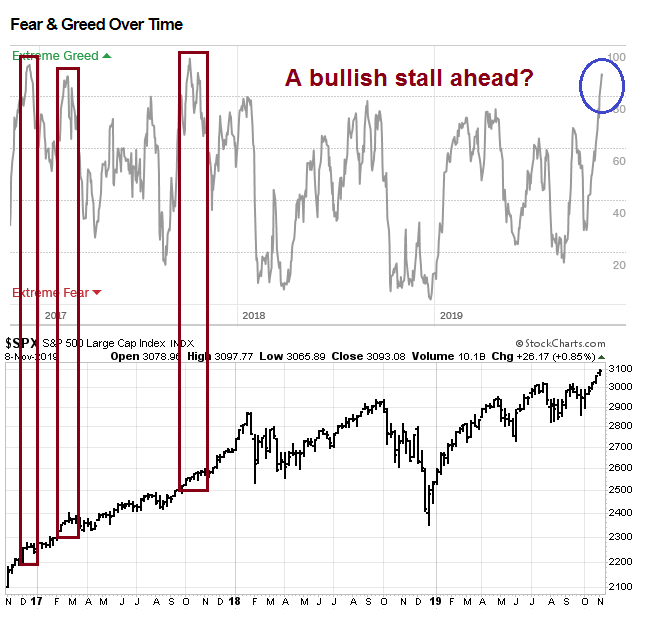
Looking to the week ahead, there are numerous signs that the market is setting up for a bullish stall. The Fear and Greed Index closed Friday at 91, which would normally be interpreted as contrarian bearish. However, past episodes of Fear and Greed Index spikes has seen the market either pause and consolidate its gains, or stage a shallow pullback, to be followed by more gains.
The daily S&P 500 chart tells a similar story. The 5-day RSI is flashing a series of “good overbought” conditions, which are signs of powerful price momentum. However, the advance has tended to stall out when the 14-day RSI reaches 70, but most of these cautionary signals were followed by only minor sell-offs.

The weekly chart shows that the index closed above its upper Bollinger Band. Such episodes are relatively rare. With the exception of the late 2017 market melt-up, upper BB closes have resolved themselves with sideways consolidations, but with a bullish bias.

However, market positioning is supportive of near-term weakness. Charlie McElligott of Nomura pointed out that dealer gamma and delta are at extremes together. Such conditions have usually resulted in market pullbacks.

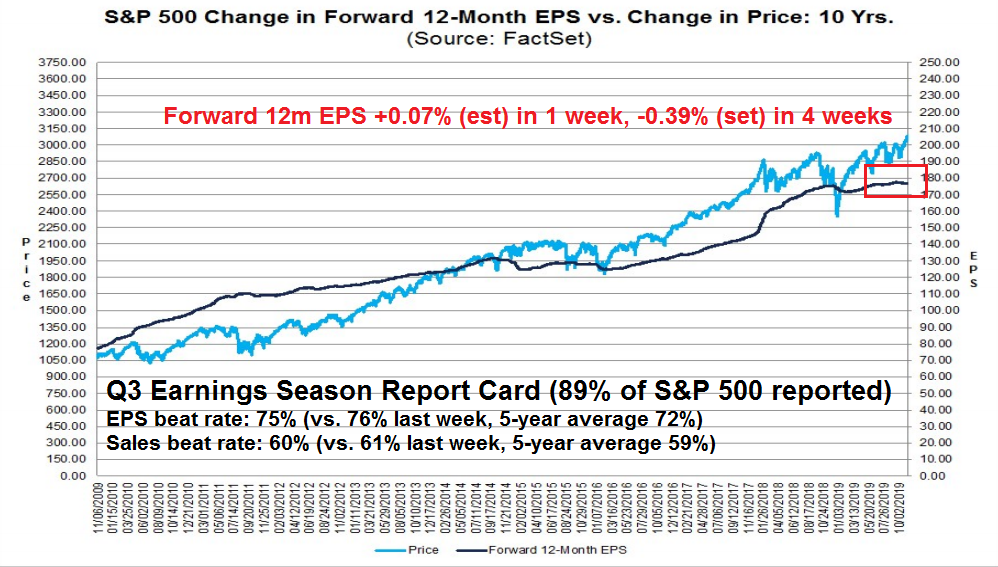
Q3 earnings season is mostly done as 89% of companies have reported results. The latest update from FactSet shows that forward 12-month EPS constructively rose last week, but the 4-week revision rate is still negative. The EPS and sales beat rates are slightly above historical averages, but only marginally. So the jury is still out on whether the bulls can expect fundamental support.
Most sentiment models are not extreme enough to flash sell signals. As an example, the AAII Bull-Bear spread is elevated, but readings do not indicate a crowded long position.

Similarly, the Citi Panic/Euphoria has been rising, but readings are firmly in neutral territory.

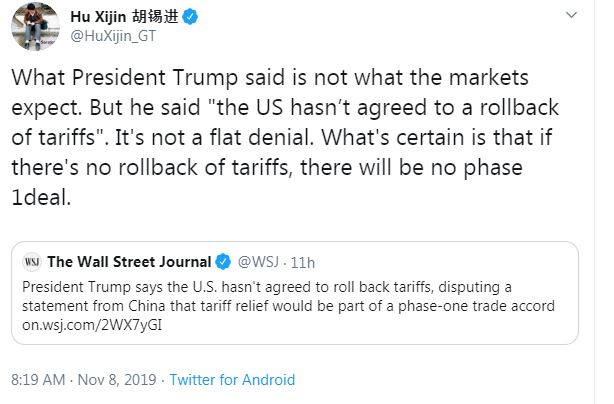
Possible disappointment over the “Phase One” trade deal remains the most likely spark for market weakness. The market became excited last week when China announced that both sides had agreed to gradually reduce tariffs as part of a “Phase One” agreement. It was later denied by the White House. The editor of Chinese official media Global Times responded that proportional tariff escalations is a condition of a deal.
Reuters summed up the negotiation this way:
Officials from both countries on Thursday said China and the United States had agreed to roll back tariffs on each others’ goods in a “phase one” trade deal. But the idea of tariff rollbacks met with stiff opposition within the Trump administration, Reuters reported later on Thursday.
Those divisions were on full display on Friday, when Trump – who has repeatedly described himself as “Tariff Man” – told reporters at the White House that he had not agreed to reduce tariffs already put in place.
“China would like to get somewhat of a rollback, not a complete rollback, ‘cause they know I won’t do it,” Trump said. “I haven’t agreed to anything.”
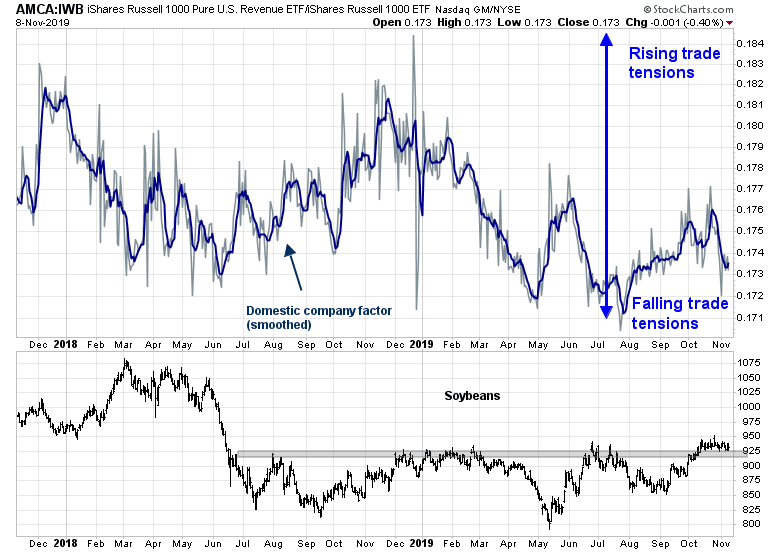
Our trade war factor shows that the market is discounting a very low level of trade tensions. Could this be an accident waiting to happen? Please be reminded that we have been here before. Both sides were close to a deal in May before talks broke down.
Next week is option expiry (OpEx) week. November OpEx seasonality has historically been below average for the bulls. The combination of sub-par OpEx seasonality, evidence of short-term exhaustion, and rising trade talk tensions could be the spark for consolidation and market weakness next week.

My inner investor is bullishly positioned as he is overweight equities. My inner trader is bullish, but he is keeping some powder dry and he is prepared to buy should the market pull back. He expects that any weakness will be relatively shallow, with downside risk of no more than 1-2%.
Disclosure: Long SPXL
Hi Cam:
Thanks for the analysis. I don’t think it’s ‘disagreement’ between tech analysis and fundamental analysis. Actually my elliot wave analysis also has a target of 4000 before the top of the next 4 year cycle. The timeframes are however, very different.
3500 – 4000 will probably be the reached longer down the road, more likely after the election. So the forward PE will be discounting 2021/2022, in addition to the fact that forward PE itself is really volatile, and wall street revisions are usually behind the curve.
3300 will be a realistic target for the coming santa rally.
Margin Debt levels have been a great long term cycle market indicator. It is flashing a powerful warning at the moment. Here is the latest from D. Short, Advisor Perspective.
https://www.advisorperspectives.com/dshort/updates/2019/10/30/margin-debt-and-the-market-down-1-6-in-september
We are experiencing the aftermath of a 2018 Beta Bubble and Crash. Stock markets in this atmosphere may grudgingly go up since there are no other attractive alternatives, especially now that Low Volatility sectors have become expensive from an historical standpoint (but not versus current interest rates).
The Value Factor seems a cheap area for investment for reluctant investors who have been burned by High Beta stocks. If the global and US economy weaken this will be a short-lived affair. Value underperforms during recessions. I believe the Quality Factor is more durable and safe going forward and Low Volatility might make a come back.
Cam is at least asking the right question. There are too many articles/posts right now devoted to predicting/managing downside risk. How many traders are positioned for upside risk?