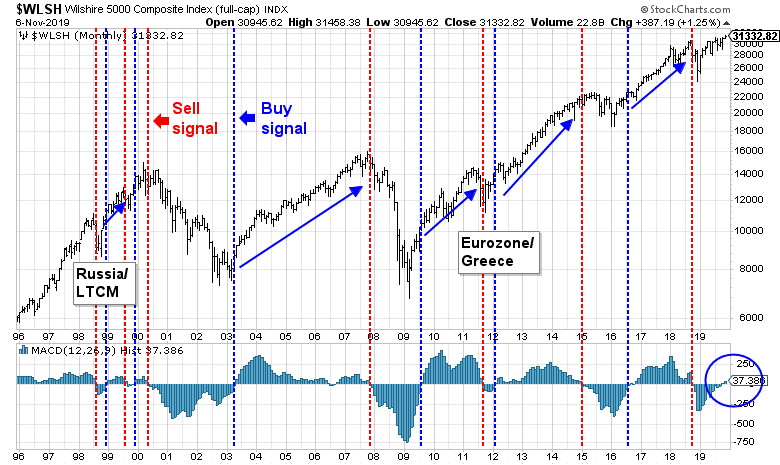
Mid-week market update: Don’t get me wrong, I am still bullish. The Wilshire 5000 flashed an important MACD buy signal on the monthly chart at the end of October. While MACD sell signals have been hit-and-miss, buy signals have historically resolved themselves in strong gains with minimal drawdowns.
The MSCI World xUS Index also flashed an interim monthly buy signal, assuming that it stays at these levels by the end of November.
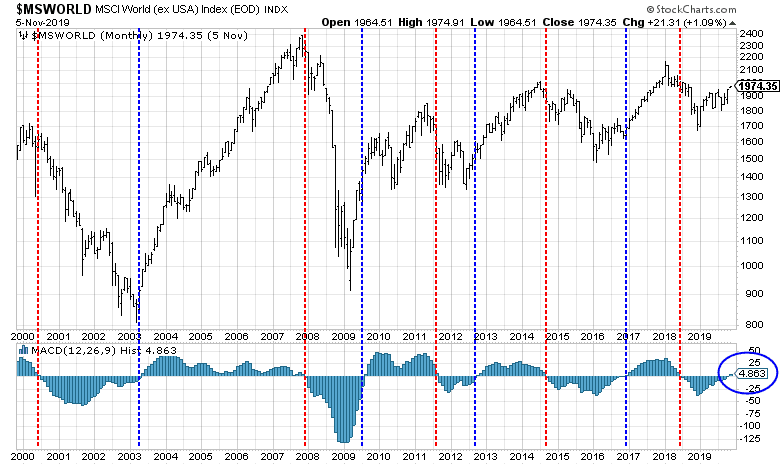
These are all unequivocally bullish signals for stock prices in the longer term, but short-term conditions suggest that the market is nearing a stall zone.
Minor stall ahead?
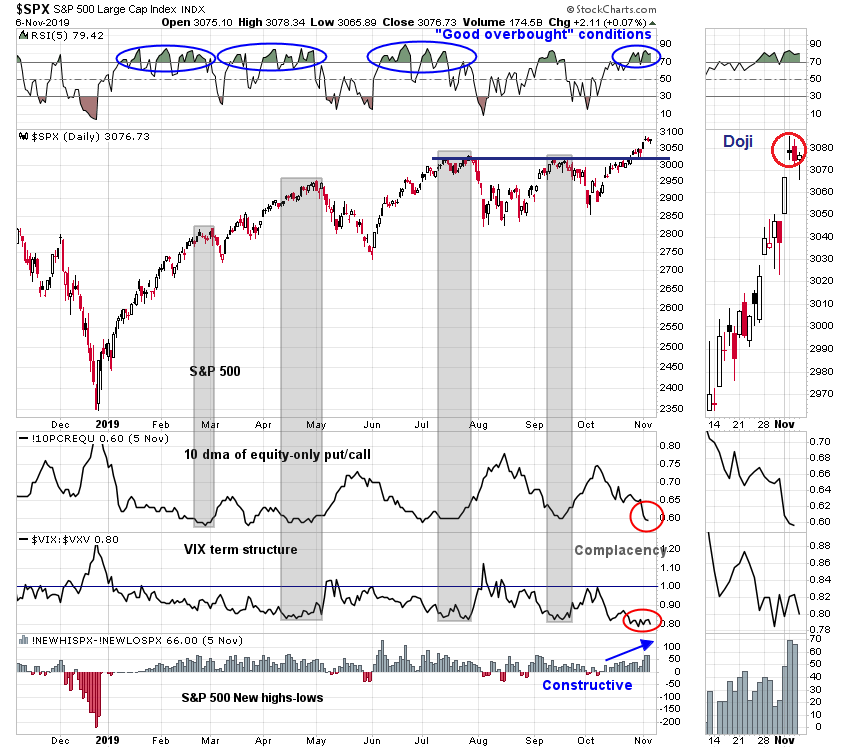
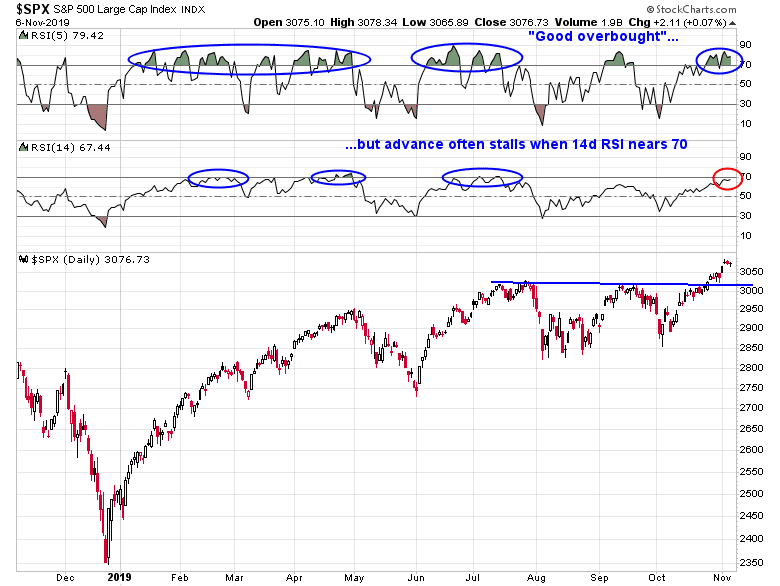
Tactically, there are a number of signs that it may not be wise to add to long positions here. The SPX traced out a doji candle on Monday on a gap up, which can be a sign of indecision. The index price proceed to slightly weaken in the next two days, which is another sign that Monday’s doji was a short-term inflection point. In addition, both the 10 dma of the equity-only put/call ratio and the VIX term structure were at levels indicating complacency. While these signals are very effective as sell signals, they nevertheless indicate above average levels of market risk. On the other hand, the 5-day RSI is flashing a series of “good overbought” readings, and the net high-lows indicator is trending upwards, which are constructive bullish signals. I interpret these conditions as a market in a powerful uptrend, but may need a little time to consolidate or pull back.
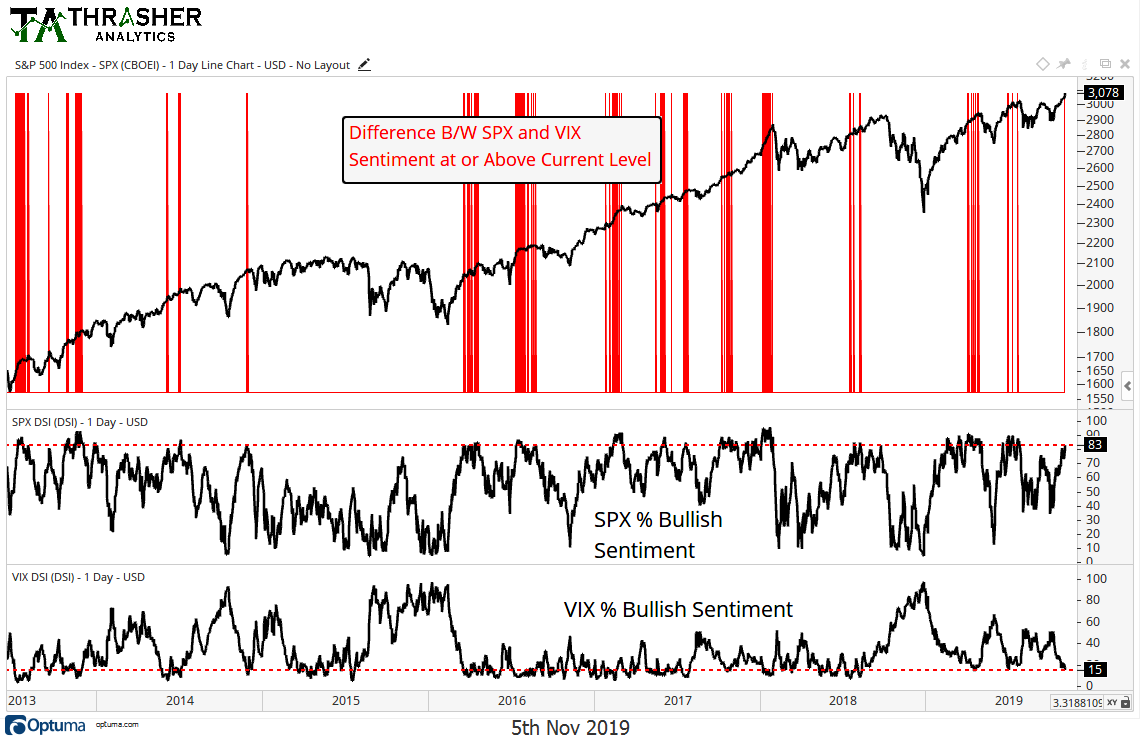
Sentiment models are also pointing to a possible pullback. Andrew Thrasher observed, “When the spread between equity and volatility sentiment hit its current level stocks have continued marginally higher before short-term pullbacks occurred.”
In addition, the Fear and Greed Index stands at 8, which is above the 80 level where past rallies have stalled.

Like the other sentiment indicators, this is not an exact short selling timing indicator. SentimenTrader calculated a proxy for the Fear and Greed Index, and found that readings above 80 functioned as only marginal sell signals.
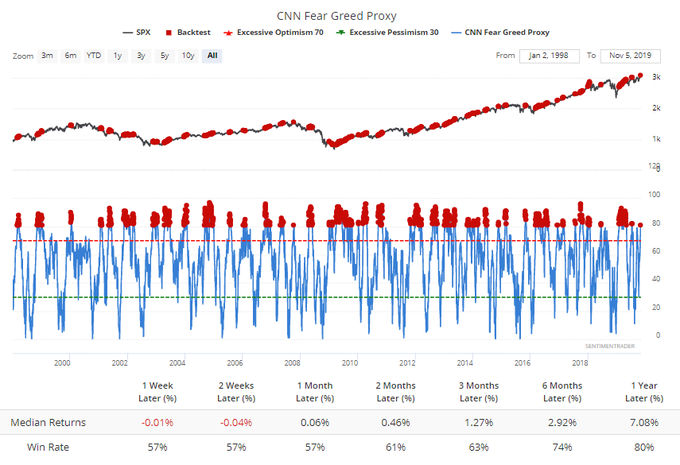
These sentiment conditions are a signal to be cautious about adding to long positions, but they do not represent an actionable sell signal for traders.
Is the Phase One deal unraveling?
The unraveling of a US-China “Phase One” trade deal is the most likely catalyst for a pullback. After Chile cancelled the APEC November summit because of ongoing protests, the US and China lacked a venue for Trump and Xi to meet and sign the “Phase One” deal reported negotiated by both sides. American negotiators have floated the idea of a signing in Iowa, where Xi had lived briefly during an exchange trip and has great political significance for Trump ahead of the 2020 election, or Alaska. The Chinese have reportedly used Trump’s desire for a signing in Iowa as leverage to ask for further concessions, according to a Bloomberg report:
People familiar with the deliberations say Beijing has asked the Trump administration to pledge not only to withdraw threats of new tariffs but also to eliminate duties on about $110 billion in goods imposed in September. Negotiators are also discussing lowering the 25% duty on about $250 billion that Trump imposed last year, the people said. On the U.S. side, people say it’s not clear if Trump, who will have the final say, will be willing to cut any duties.
From the Chinese perspective, the argument is that if they are going to remove one big point of leverage and resume purchases of American farm goods and make new commitments to crack down on intellectual property theft — the key elements of the interim deal — then they want to see equivalent moves to remove tariffs by the U.S. rather than the simple lifting of the threat of future duties.
Will Trump cave? The global financial markets would like to know. CNBC reported that the date of the signing may be delayed from November to December, which is a sign that the deal may be on the rocks:
The meeting between Trump and Xi could be delayed as the two sides still need to decide on the terms and a venue, Reuters reported Wednesday, citing a senior Trump administration official. The report also said it’s still possible the two countries will not reach a trade pact.
Expect choppiness or mild pullback
Both my inner trader and investor are bullishly positioned. However, my inner trader is tactically cautious and he is expecting a brief pullback or some near-term choppiness ahead. The 5-day RSI is constructively flashing a series of “good overbought” readings, which is bullish. On the other hand, the 14-day RSI is nearing 70, which is a level when the market has stalled and pulled back in the past year.
My base case scenario calls for a shallow pullback to a test of the upside breakout at 33303030, which represents downside risk of 1% of less from current levels. My inner trader is inclined to buy the dip should the market weaken to those levels.
Disclosure: Long SPXL
Thanks, Cam.
F
Please update the model at the end of the month, if the Wilshire 5000 and MSCI world x US is still flashing a long term buy. Thanks.
Thanks, Cam. Hopefully markets will make a pullback to 3030. 🙂