Preface: Explaining our market timing models
We maintain several market timing models, each with differing time horizons. The “Ultimate Market Timing Model” is a long-term market timing model based on the research outlined in our post, Building the ultimate market timing model. This model tends to generate only a handful of signals each decade.
The Trend Asset Allocation Model is an asset allocation model which applies trend following principles based on the inputs of global stock and commodity price. This model has a shorter time horizon and tends to turn over about 4-6 times a year. In essence, it seeks to answer the question, “Is the trend in the global economy expansion (bullish) or contraction (bearish)?”
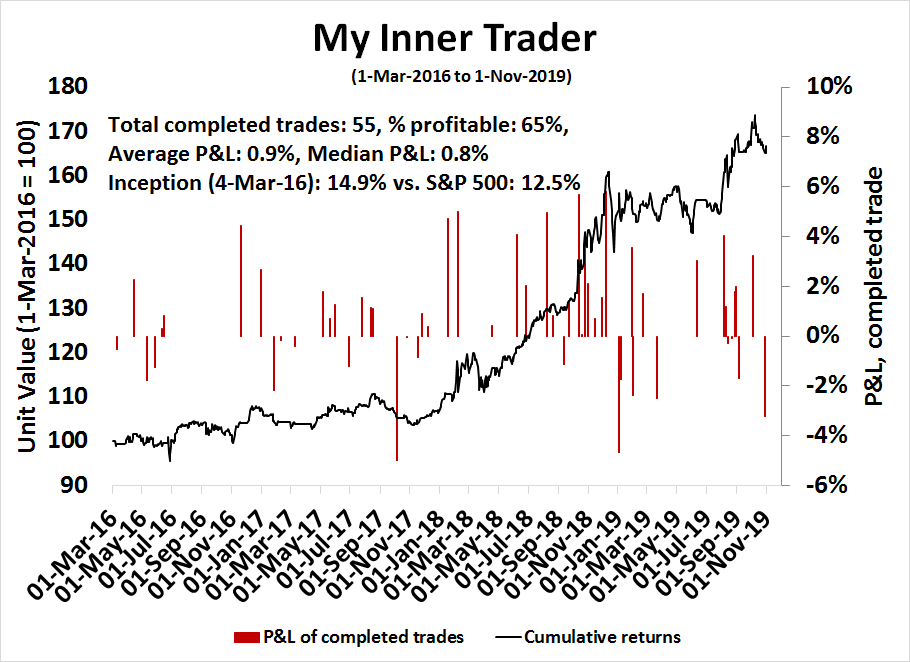
My inner trader uses a trading model, which is a blend of price momentum (is the Trend Model becoming more bullish, or bearish?) and overbought/oversold extremes (don’t buy if the trend is overbought, and vice versa). Subscribers receive real-time alerts of model changes, and a hypothetical trading record of the those email alerts are updated weekly here. The hypothetical trading record of the trading model of the real-time alerts that began in March 2016 is shown below.
The latest signals of each model are as follows:
- Ultimate market timing model: Buy equities
- Trend Model signal: Bullish (upgrade)
- Trading model: Bullish
Update schedule: I generally update model readings on my site on weekends and tweet mid-week observations at @humblestudent. Subscribers receive real-time alerts of trading model changes, and a hypothetical trading record of the those email alerts is shown here.
Buy the breakout!
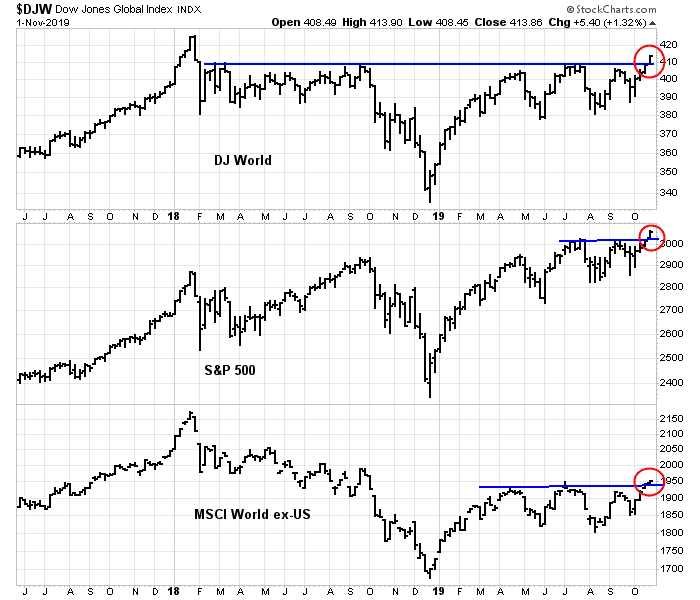
Did anyone notice the upside breakout in the global equity indices? The breakout was not only evident in the US, but it was broad and global in nature. This is an unambiguously sign to get bullish on equities. Investors with intermediate and long term horizons should buy the breakout.
I would like to reconcile the recession risk raised by a number of readers. While a number of indicators, such as the recent yield curve inversion, tanking CEO confidence, falling ISM and Markit PMIs, and so on, are signaling recession, how can I possibly be equity bullish in the face of these risks?
A review of US recession finds that the household sector is strong, monetary policy is easy and supportive of growth, but the corporate sector is struggling. We conclude that while this may point to a slowdown, no recession is in the cards.
In conclusion, global markets are staging coordinated upside breakouts. These are unambiguous signs of a global rebound in growth. Recession risks are low. The Trend Asset Allocation Model has turned bullish. This is likely the start of a new leg in an equity bull.
Here comes the global breakout
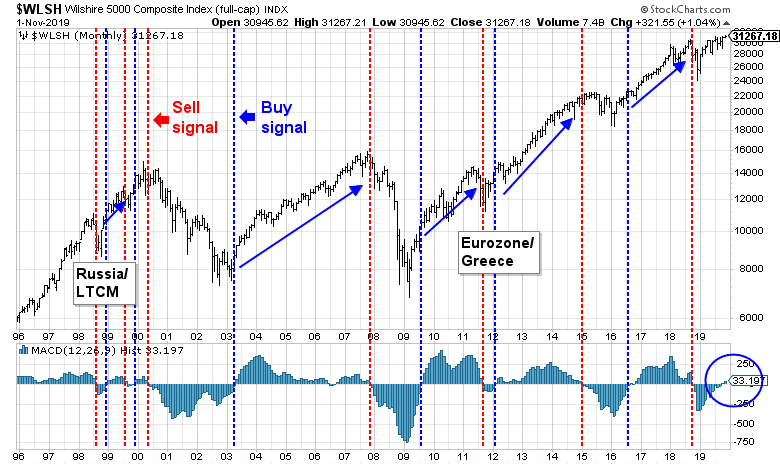
One truism of technical analysis is that there is nothing more bullish than a stock or an index making fresh highs. The broad global breadth of the price surge has been astounding. In the US, the broad-based Wilshire 5000 flashed a buy signal that has been a highly effective indicator of past bull phases that have resolved with a virtual certainty of higher prices. The monthly MACD made a bullish crossover at the end of October. If history is any guide, higher prices are ahead.
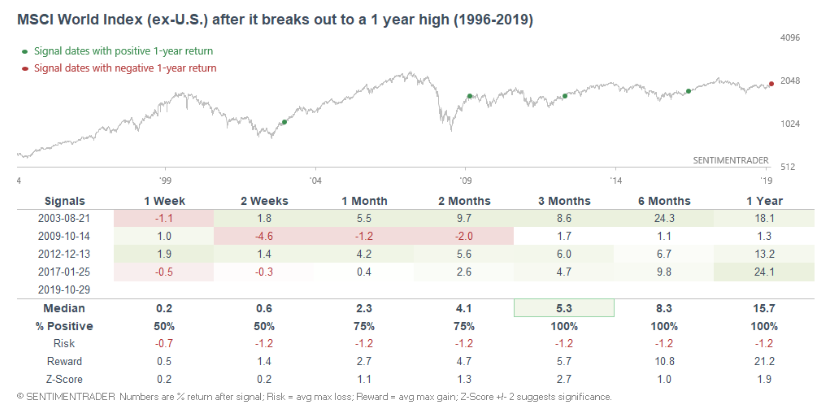
Jason Goepfert at SentimenTrader observed that past upside breakouts of MSCI World ex-US resulted in higher prices 6 and 12 months later 100% of the time. US stocks did even better under this signal.
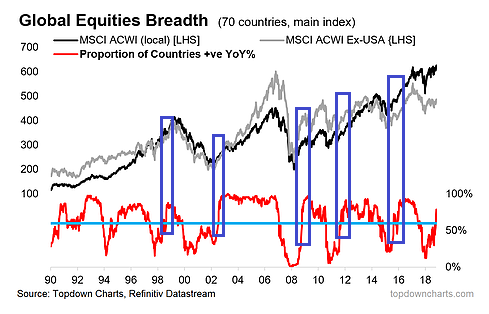
The broad breadth of the rally also has bullish implications. Callum Thomas of Topdown Charts pointed out that the proportion of countries with positive year/year price gains has been surging. Past instances of such breadth surges have usually signaled just the start of an equity rally. In other words, this is the signal of a new bull market.
Thomas added:
I also want to make passing reference to the rest of my analysis (I was recently on the road and talked through this with clients), which in essence is entirely consistent with the message from the breadth indicators that we are in about to enter a new bull market. On my metrics in absolute terms global equities are not expensive (slightly cheap), and indeed relative to bonds the equity risk premium actually looks pretty good. Add to that the fact that fund manager/institutional investor positioning remains fairly light (based on surveys, anecdotes and actual data from custodian accounts) as well as a clear reset in earnings expectations, sentiment is arguably contrarian bullish. And perhaps most important of all, the global monetary policy pivot is clear, material, and reinforces my core view that we see a rebound/re-acceleration in the global economy heading into 2020 (call it a late-cycle extension). In other words, it’s not just the technicals (and the implications of this analysis extend across asset classes).
I agree. All the stars are lining up for a new bull run.
What about recession risk?
Recently, there have been a lot of bearish analysis appearing on social media. I would like to address those concerns.
First, many recession indicators are being promoted by permabears who try to cherry pick the bearish data point of the day. I approach forecasting differently. My own framework consists of:
- Determine the goalposts, or criteria, ahead of time.
- Make sure that each indicator we use is a good forecaster on a standalone basis.
- Recognize that no single indicator is perfect, but a portfolio of uncorrelated indicators is more effective.
That way, we can avoid the cherry picking problem of analyzing or reacting to any signal after the fact. That is why I use the forecasting framework outlined by New Deal democrat, where he has specified a series of long leading recession indicators used by Geoffrey Moore to forecast recessions about a year in advance. They can be broadly categorized as measuring the household sector, monetary conditions, and the corporate sector, or what NDD calls the producer sector.
Consumer spending is on fire
Starting with the household sector, the consumer is on fire. Consumer spending is on fire. Historically, real retail sales per capita has turned down ahead of recessions. There is no sign of a top.

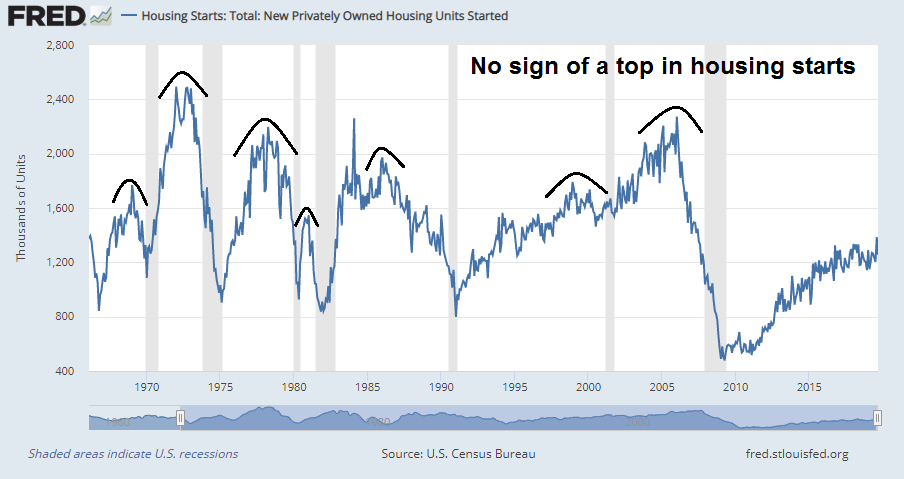
Housing is a highly cyclical sector, and it is usually the biggest item in household expenses. Housing has historically peaked before past recessions. So far, there is no sign of a top in housing starts.
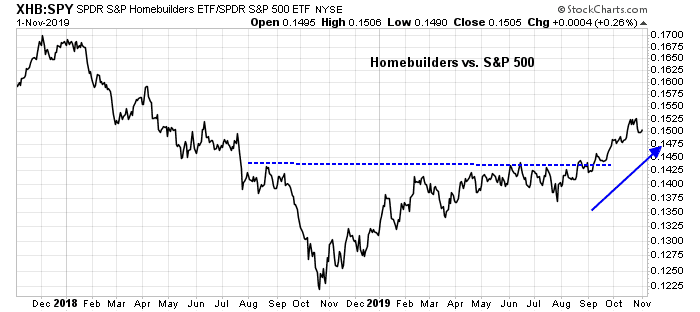
In addition, the real-time market signals of homebuilding stocks exhibit a bullish pattern. The group broke out of a saucer shaped relative bottom, and it is in a steady relative uptrend.
Last Friday’s strong October Jobs Report is another bullish factor in support of the household sector. The economy added 128K jobs, compared to an expected 89K, in the face of weakness from the GM strike, and a decline in temporary Census workers. Non-Farm Payroll employment was also revised upward for August and September. These figures point to strength in the jobs market, and consumer spending.
A dovish Fed
The second leg of long leading indicator measure monetary policy. Fed chair Jerome Powell signaled in the October post-FOMC press conference that the Fed is no hurry to raise rates:
I think we would need to see a really significant move up in inflation that’s persistent before we even consider raising rates to address inflation concerns.
The Fed is dovish, and is prepared to support growth. These are not recessionary conditions. In fact, the Fed is easing. As one measure of the level of accommodation of monetary policy, consider money supply growth. In the past, either M1 or M2 growth has fallen below CPI inflation (black line) before recessions. Today, money growth is accelerating.

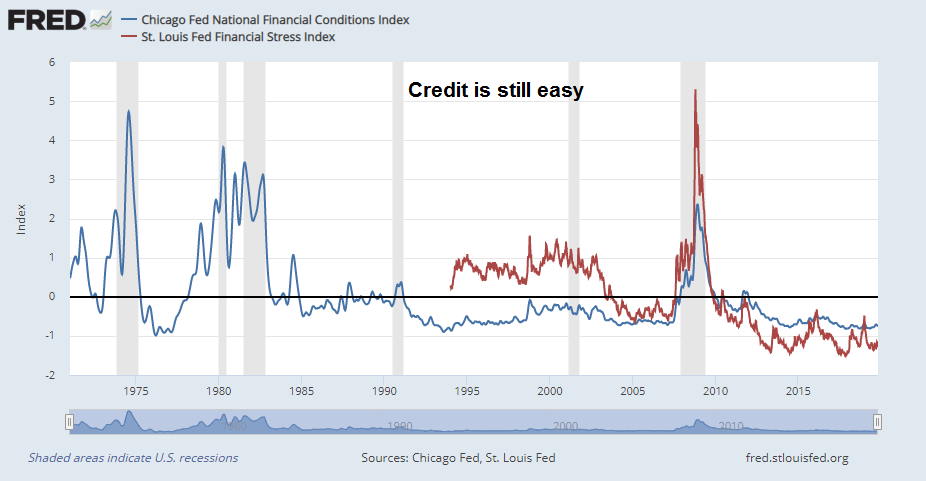
Another characteristic of recessionary conditions is tightening credit conditions. As economic conditions deteriorate, banks and other lenders tighten their lending criteria. The resulting credit squeeze tanks the economy. The latest measures of financial conditions from the Chicago and St. Louis Fed shows that credit is still easy.
Why worry about a recession?
Rising corporate angst
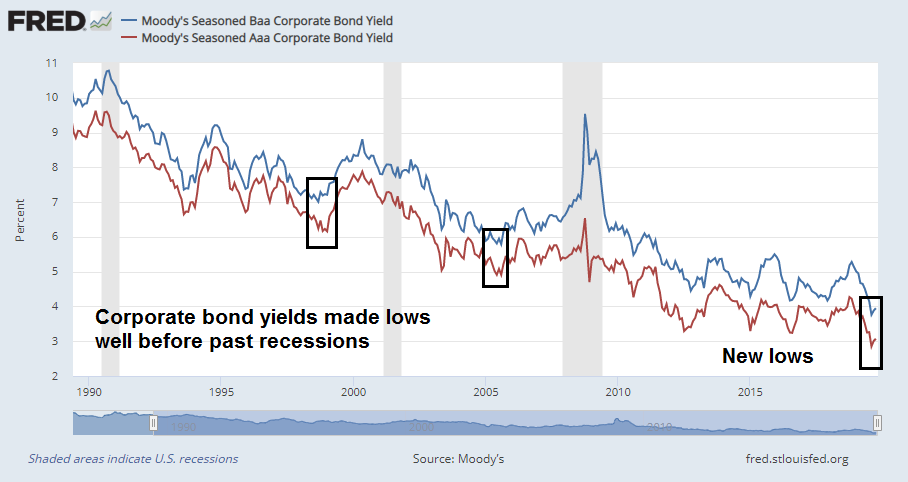
The weak flank of the economy is the corporate sector. While it is true that corporate bond yields have historically bottomed out 2-3 years ahead of recessions, and they made a new low recently, the corporate sector is not ready to sound the all-clear.
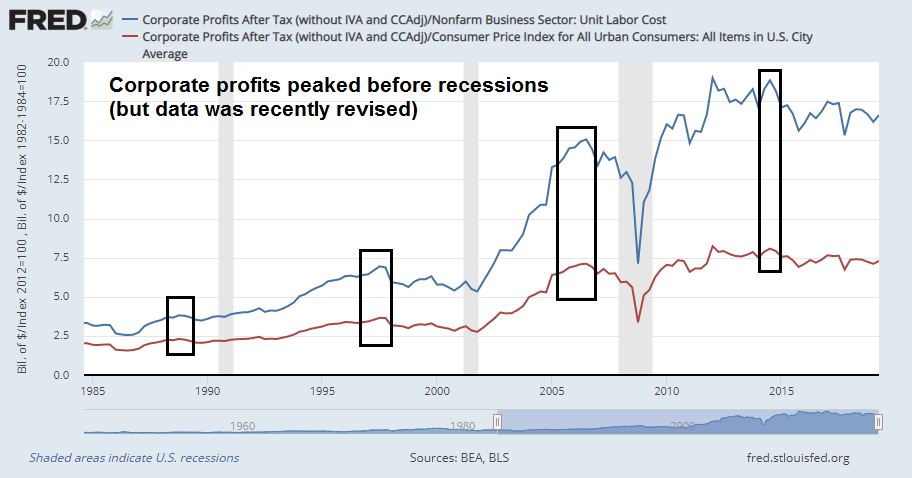
NIPA corporate profits deflated by unit labor costs (blue line) has historically turned down ahead of recessions. That’s where the economy looks vulnerable.
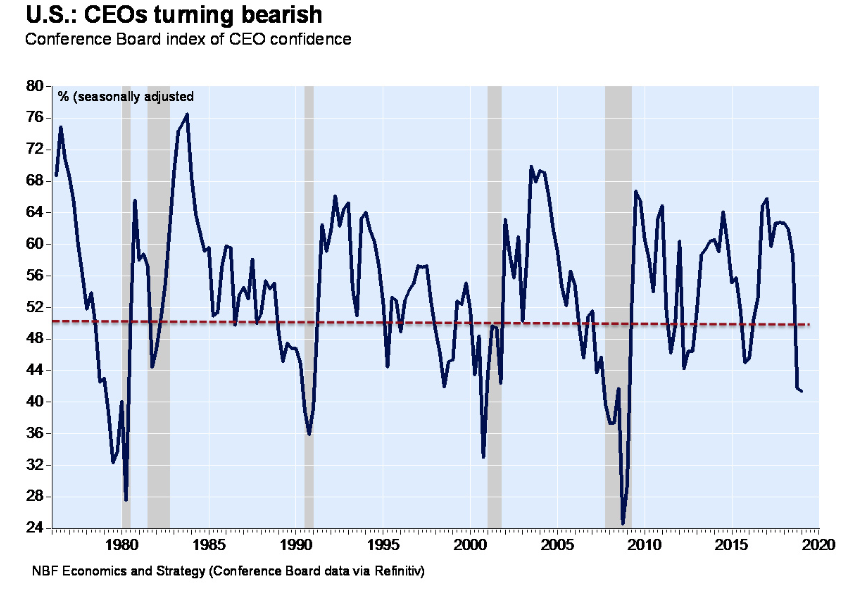
The trade war has been a drag on the corporate sector. It is therefore not surprising that CEO confidence has tanked. Similarly, other survey based indicators, such as ISM and PMI, are all showing signs of weakness.
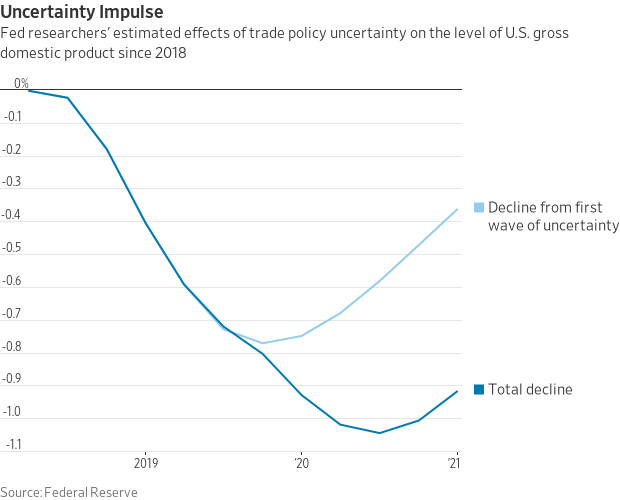
As business confidence wanes, so does business investment. A recent Fed study found that the trade war had knocked about 1.0% from potential GDP growth. No wonder the Fed has been pre-emptively easing.
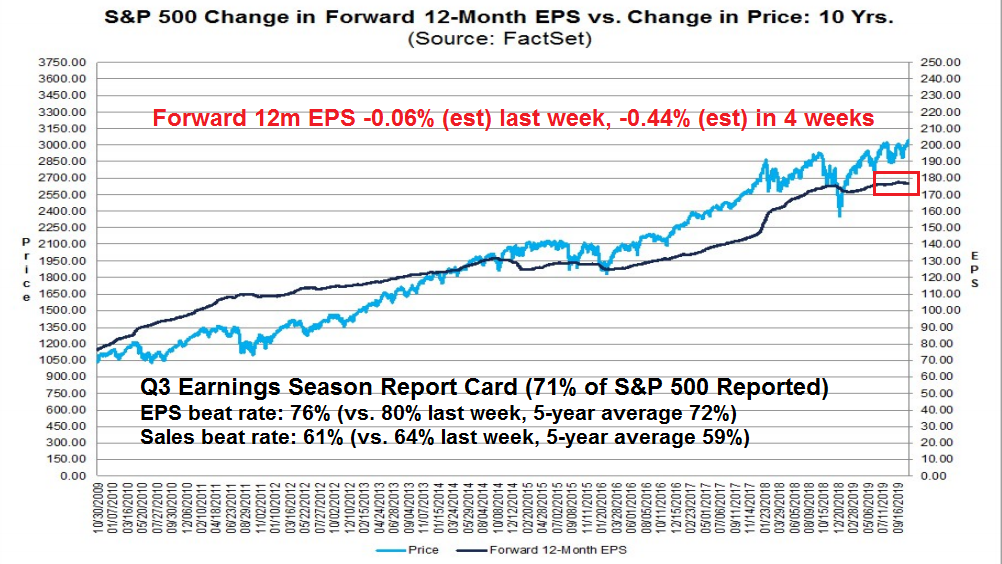
From a tactical perspective, forward 12-month EPS estimate revisions are still stagnant, despite an above average Q3 earnings season. Stock prices may struggle until it becomes evident that the fundamental outlook is improving.
There are some bright spots to the earnings picture. Brian Gilmartin of Trinity Asset Management identified Consumer Discretionary and Real Estate sectors as showing positive estimate revisions.
Consumer Discretionary is housing and autos and in terns of individual stocks, it’s Amazon, McDonald’s, Home Depot, Starbucks, etc.
Those subsectors and stocks have performed well in 2019, and AT LEAST THUS FAR, analysts are taking numbers up for the consumer discretionary sector for 2020, versus the normal downward revisions.
None of this means this will hold for the next 15 months, but with the decent US job growth reported this morning, and three fed funds rate cuts in the last 3 months, nothing has changed so far for 2020 in terms of being concerned about the US consumer.
Corporate weakness, but no recession
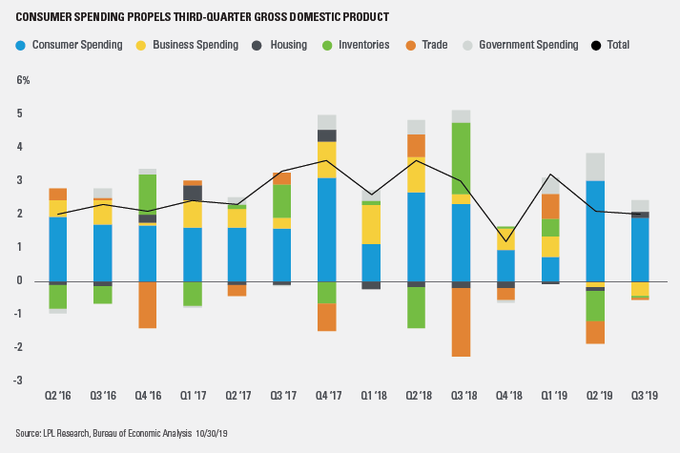
To summarize, the US economy is going through a soft patch because of weakness in the corporate sector, but corporate weakness will not drag the US into recession. Ryan Detrick of LPL Financial recently highlighted this chart of the sources of GDP growth. While business spending (yellow bar) is weak, consumers spending (blue bar) remains strong. It is difficult to see how the economy could fall into recession in light of the difference in the magnitude of these effects.
For another perspective, Bloomberg reported former Fed chair Alan Greenspan is also calling for no recession:
We’re still in a period of deleveraging. No recession in the last half century, at least, began from a period of deleveraging.

Currency strategist Marc Chandler found signs of a “synchronized emergence from [a global] soft patch”:
There have been plenty of developments warning of a global economic slowdown. Yet, seemingly to justify the continued advance in equity prices, there has begun to be talk of possible cyclical and global rebound.
That is the new constellation, connecting the better than expected Japanese, South Korean, and Chinese September industrial output figures, a slightly stronger than expected Q3 GDP reports from the US and the eurozone. Ahead of the weekend, China reported an unexpected increase in the Caixin manufacturing PMI and a sharp rise in the forward-looking new orders component. The US labor market, which helps drive consumption and 70% of the economy, is faring better than expected. Not only was the October job growth more than expected, but the past two months had under-counted by 95k.
A new bull?
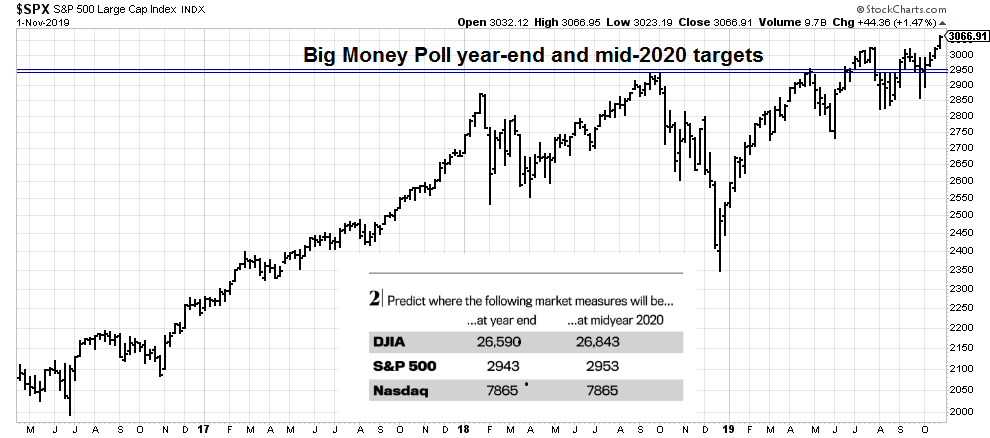
In conclusion, global markets are staging coordinated upside breakouts. These are unambiguous signs of a global rebound in growth. Recession risks are low. This is likely the start of a new leg in an equity bull. Institutions are still too bearish, and they are going to get caught leaning the wrong way. The latest Barron’s Big Money Poll shows year-end and mid-year 2020 targets below current market levels.
SentimenTrader put it a slightly different way.
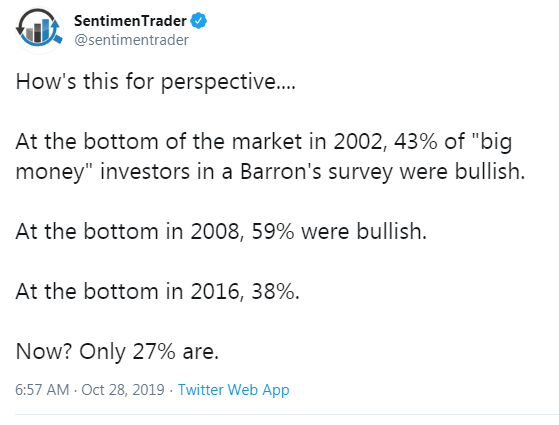
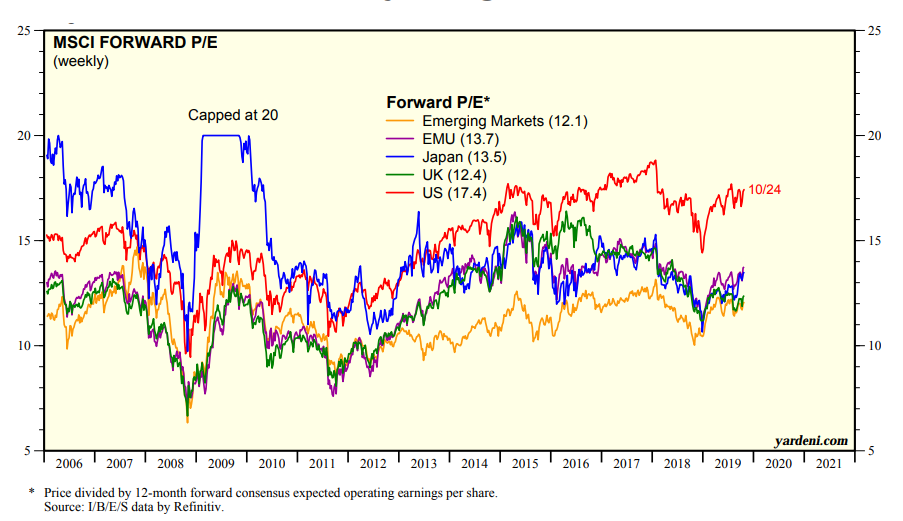
That said, I reiterate my belief that US equity valuation is stretched compared to other regions in the world. Investors will find better risk/reward tradeoffs with non-US exposure.
The Trend Asset Allocation Model is now bullish. Enjoy the new bull.
The week ahead
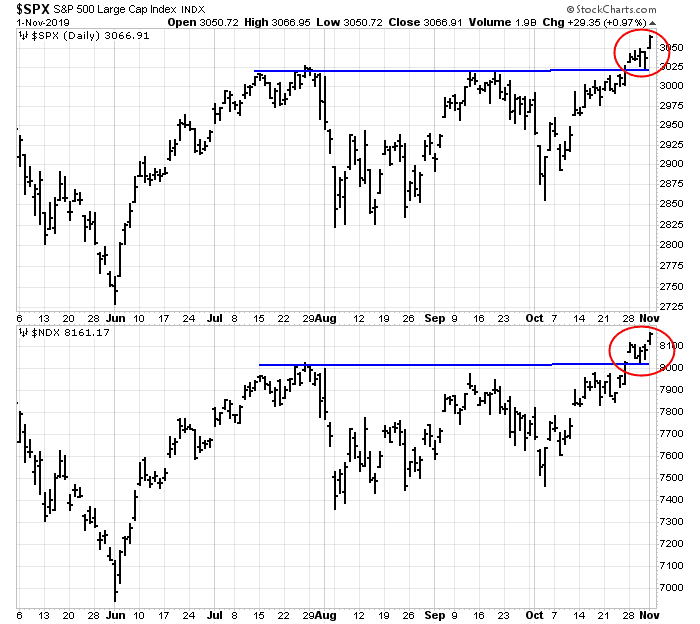
Looking to the week ahead, the short and intermediate term outlooks look bullish. The SPX and NDX staged decisive upside breakouts over resistance to achieve all-time highs.
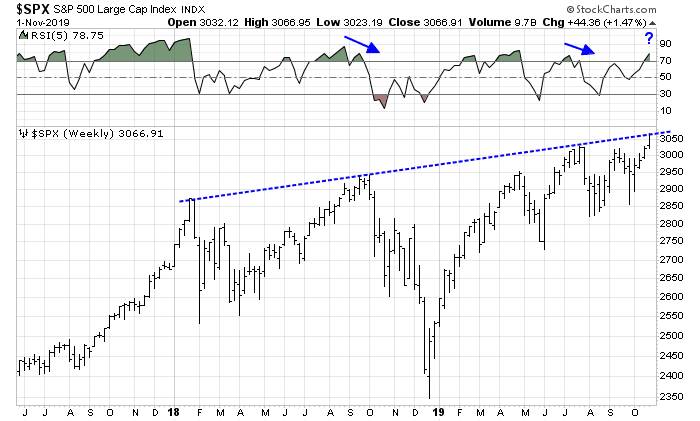
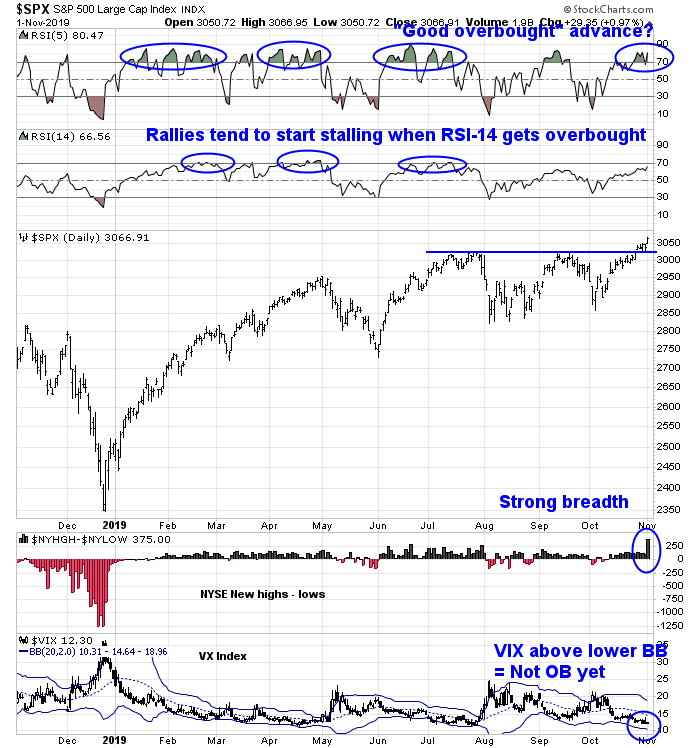
The weekly chart of SPX shows the index testing a rising trend line. Usually, at these junctures, it is not unusual for the market to take a breather to pull back and consolidate its gains. What is unusual about this test is past touches of the trend line were accompanied by negative 5-week RSI divergences. This time, there is no bearish divergence.
Looking at the daily chart, the challenge for the bulls is to achieve a series of “good overbought” conditions on the 5-day RSI, with pauses when the 14-day RSI reaches the 70 overbought level. Other internals appear to be constructive. Friday’s advance was accompanied by a surge in new new highs. In addition, the VIX Index has not reached its lower Bollinger Band, which is a level when past rallies have stalled.
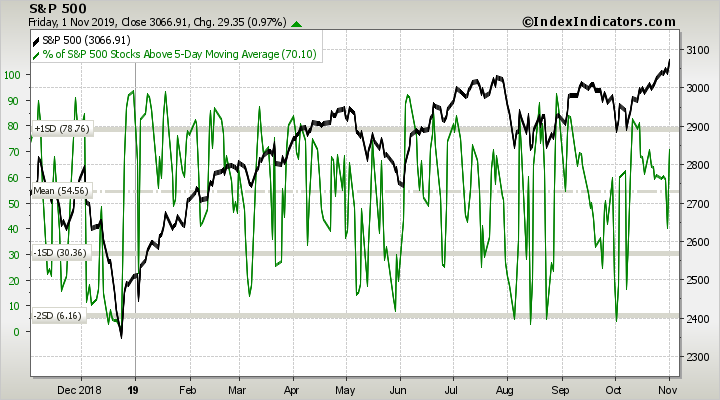
Despite Friday’s test of overhead resistance, short-term momentum is surprisingly not overbought, indicating a possible overthrow of the rising trend line depicted in the weekly chart early next week.
The NYSE McClellan Summation Index (NYSI) stands at 706, and it is nowhere near a 1000+ overbought level yet. Past NYSI peaks in the last 10 years have seen the market stall (red), with only a small minority (red) resolving with a continued advance. These conditions suggests that this rally has more room to run.

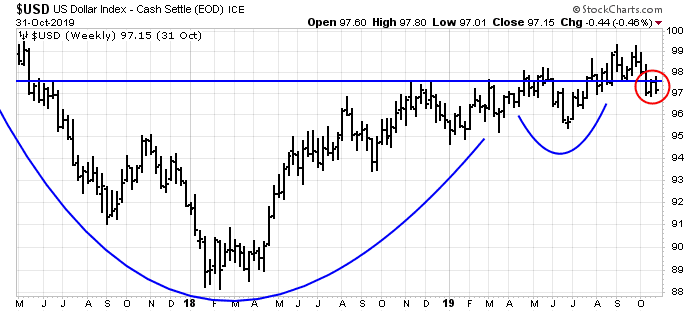
Cross-asset analysis from the foreign exchange market is also hopeful for the bull case. The USD continues to weaken after exhibiting a failed breakout from a multi-year base. USD has two benefits. First, it alleviates any pressure on the offshore dollar market for weak credit borrowers, and reduces the risk of an EM crisis. As well, it is helpful to the operating margins of US large cap multi-nationals operating in foreign markets.
I am also watching the USDJPY rate. The Japanese Yen has been a haven for safe assets, and it is an indicator of global risk appetite. USDJPY is forming a possible inverse head and shoulders formation, and should it stage an upside breakout, it would be another bullish signal for risky assets such as stocks.

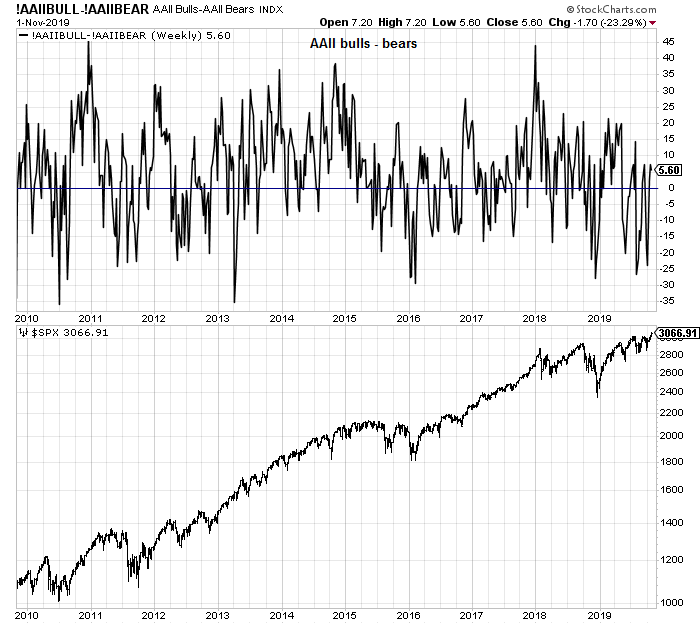
Sentiment models are mixed. The AAII bull-bear spread, while net bullish, can be said to be in neutral territory and not at an extreme reading.
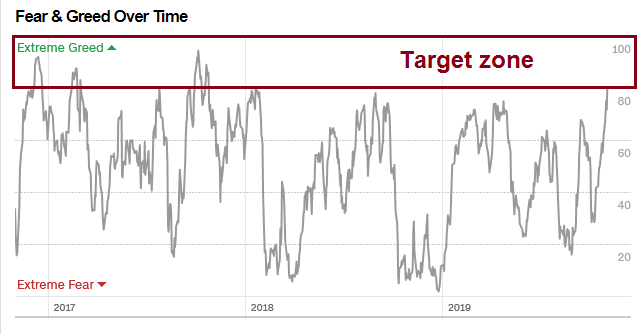
On the other hand, the Fear and Greed Index reached 80 on Friday, which is at the bottom of the overbought zone where past rallies have topped out.
My inner investor is gradually moving his portfolio from a neutral position>to an overweight position in equities. My inner investor trader is long the market. He bought the upside breakout last week.
Disclosure: Long SPXL
I think the last sentence you meant to say your inner trader is long the market.
You are correct. That has been corrected.
Hi Cam:
I didn’t receive this article in my email. Did you send it out yet?
Thanks,
Kevin
I too didn’t get the morning email. It just arrived at 12:17pm…. I just went to the web site and found the article in the morning…
On it Cam, many thanks for your hard work always!!